

Abstract
Forests play a critical role in mitigating climate change, and, at the same time, are predicted to experience large-scale impacts of climate change that will affect the efficiency of forests in mitigation efforts. Projections of future carbon sequestration potential typically do not account for the changing economic costs of timber and agricultural production and land use change. We integrated a dynamic forward-looking economic optimization model of global land use with results from a dynamic global vegetation model and meta-analysis of climate impacts on crop yields to project future carbon sequestration in forests. We find that the direct impacts of climate change on forests, represented by changes in dieback and forest growth, and indirect effects due to lost crop productivity, together result in a net gain of 17 Gt C in aboveground forest carbon storage from 2000 to 2100. Increases in climate-driven forest growth rates will result in an 81%–99% reduction in costs of reaching a range of global forest carbon stock targets in 2100, while the increases in dieback rates are projected to raise the costs by 57%–132%. When combined, these two direct impacts are expected to reduce the global costs of climate change mitigation in forests by more than 70%. Inclusion of the third, indirect impact of climate change on forests through reduction in crop yields, and the resulting expansion of cropland, raises the costs by 11%–38% and widens the uncertainty range. While we cannot rule out the possibility of climate change increasing mitigation costs, the central outcomes of the simultaneous impacts of climate change on forests and agriculture are 64%–86% reductions in the mitigation costs. Overall, the results suggest that concerns about climate driven dieback in forests should not inhibit the ambitions of policy makers in expanding forest-based climate solutions.
Export citation and abstract BibTeX RIS
1. Introduction
Forests play a critical role in the long-term health of our planet and in meeting the goal of mitigating climate change (IPCC 2018, Roe et al 2019). The role of forests as a low-cost mechanism for carbon sequestration has long been recognized (Stavins 1999, Sohngen and Mendelsohn 2003, Kindermann et al 2008). Analysis of afforestation, reduction of deforestation, and changes in forest management in the literature indicates that forests should be an important part of any national and global strategy to combat global warming (Tavoni et al 2007, Murray et al 2009), and a number of recent studies have reinforced the argument that protecting, planting, and managing forests can be efficient in mitigating climate change (Griscom et al 2017, Bastin et al 2019, Busch et al 2019, Austin et al 2020). Most of these studies, however, have not considered the potential risks and benefits that climate change carries (Anderegg et al 2020).
Climate change is predicted to have widespread impacts on forested ecosystems both regionally (Hubau et al 2020, Bauman et al 2022) and globally (Tian et al 2016, Kim et al 2017, Favero et al 2018, IPCC 2018), with some regions presenting unique opportunities for carbon sequestration (Koch and Kaplan 2022). Recent forest fires in Australia, Canada, and the United States highlight the important concern that established forest carbon sinks are susceptible to climate-driven fire losses (Abatzoglou and Williams 2016). Two direct impacts of climate change will exert a strong influence on the efficiency of forests in mitigating climate change: climate driven changes in forest growth and disturbance. Efforts to protect forests and maintain carbon stocks will be the cheapest, and the most effective, in locations that have limited climate-driven forest losses. On the other hand, efforts to increase carbon storage through afforestation and reforestation will be most effective in areas where carbon fertilization has a strong effect on timber growth.
However, the effect of these direct impacts may be tempered by indirect effects that will also exert a strong influence on the efficiency of forests. First, timber prices may change in response to altered forest dieback and growth (Sohngen et al 2001, Tian et al 2016). Because timber outputs are an important co-benefit with carbon sequestration services, changes in prices will affect the costs of afforestation, reforestation, forest management, and even forest protection in some regions. Impacts of climate change on timber output and prices at global and regional levels have been examined in the literature (Joyce et al 1995, Sohngen and Mendelsohn 1998, Perez-Garcia et al 2002, Hanewinkel et al 2013, Wear et al 2013, Tian et al 2016, Favero et al 2021). Favero et al (2021) provides a detailed summary of studies of climate change impacts (CCI) on forests. Many of these studies come to the conclusion that climate change is expected to increase timber supply and reduce global timber prices. However, the question of how climate change affects mitigation costs has been left largely unexplored.
Second, agricultural productivity will be affected by climate change through the impacts of changing temperature, CO2 fertilization, and rainfall on crop yields (Nelson et al 2014, Baldos et al 2019). By altering the productivity of agriculture, climate change will influence the opportunity cost of land, which is a critically important determinant of the costs of carbon sequestration in forests.
Nearly all of the studies that have suggested an expansive role for land use in climate mitigation have either focused on the near term (Griscom et al 2017), or they have ignored the role of the simultaneous impacts of climate change on both forests and agriculture (Riahi et al 2017, Roe et al 2019, Wade et al 2022). Given the large-scale impacts that climate change is projected to have on the underlying forest resources, these factors could generate misleading estimates of the costs of carbon storage in forests. In particular, given the spatial extent and the longevity of forests, errors in the forest component of climate policy could have far-reaching and long-term consequences.
This paper develops a fully intertemporal dynamic economic model of global forests and agricultural systems and integrates it with MC2 dynamic global vegetation model (DGVM) (Kim et al 2017) and the results of a meta-analysis of climate impacts on agricultural yields (Challinor et al 2014) to assess how CCI influence the costs of reducing emissions and increasing carbon sequestration in forests over the course of this century (figure 1).
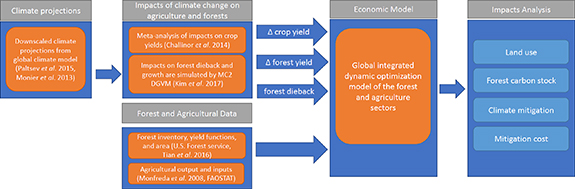
Figure 1. Relation among data sources and models within the global integrated dynamic optimization model of the forest and agriculture sectors.
Download figure:
Standard image High-resolution imageThe economic model incorporates two direct impacts of climate change on forests based on results from the MC2 DGVM: the adverse effect of climate change on forest fires through increased dieback, and the change in growth due to changes in net primary productivity (NPP). By accounting for forest fires, the analysis considers how changes in disturbance regimes over time affect forest stocks and thus influence decisions to plant trees or maintain them. By accounting for changes in NPP, the analysis accounts for the influence that shifts in forest growth have on forest investments for timber and carbon. These impacts are embedded in a long-run model of global land use in which climate change alters the productivity of both forestry and agricultural sectors.
2. Methods
2.1. CCI
The data on CCI on forests are obtained from the MC2 DGVM (Kim et al 2017) developed by the US Forest Service and its collaborators. Representing land surface as a grid, MC2 reads as input elevation, soil, and climate projections on a monthly time step, and calculates plant productivity, and carbon and water fluxes through above- and below-ground pools. MC2 simulates CO2 effects on NPP and potential evapotranspiration, simulates fire occurrence as a function of the current vegetation type and fuel conditions, and calculates fire consumption of vegetation and the associated ecosystem carbon pools (Conklin et al 2016).
Two key results from MC2 are passed to the dynamic forward-looking economic optimization model of global land use. First, NPP is used to perturb forest yields. NPP is the gross carbon allocated to plant growth annually after respiration and is calculated by the MC2 DGVM without accounting for disturbance. The forest growth functions used in the economic model are also gross yield functions, measured in cubic meters of biomass per hectare (m3ha−1) before disturbance. Second, in MC2 changes in disturbance by biome are measured as changes in consumption of aboveground biomass by fires. In the economic model, disturbance is applied equally to all age classes of hectares as a direct reduction in the stock of forests.
MC2 estimates the impacts of climate change on forests at the 0.5° resolution at a monthly time step, while the economic land-use model solves for forest harvest, agricultural output, timber investment, and land-use allocation at the biome level at decadal step. To pass information from MC2 to the economic model, the MC2 results are aggregated across space and time to represent changes over a decade at the biome level. Because NPP generated by MC2 at the biome level of aggregation is correlated with atmospheric CO2 concentration, a unique function is calibrated for each biome, linking changes in NPP to CO2 concentration. A similar approach is used to model forest dieback, in which biome-specific functions are calibrated to link MC2-generated dieback rates to global surface temperature. These functions are then incorporated into the economic optimization to determine forest growth and dieback in each future time period in the model.
Information on CCI on crops is obtained from a meta-analysis by Challinor et al (2014) that finds an average yield loss of 4.9% per 1 °C increase in temperature. In the economic model, crop output depends not only on inputs used and improvements in technology but also on changes in global surface temperature.
2.2. The economic model of global land use
We develop a dynamic forward-looking economic optimization model (Judd 1998, Cai 2019) of global land use with a detailed representation of the timber sector (model equations are listed in the SI). In the model, a representative household derives utility from the consumption of land-based goods and other goods and services. Global welfare, represented by the sum of discounted global utilities, is maximized subject to endowments and production function constraints, and equations of motion:


where D is a set of control variables (investment in timber management, harvested and planted hectares in managed forests, accessed natural forest area, and allocation of land and other resources),  is the compound utility discount factor,
  is global population, u is per capita utility derived from final consumption goods y, and t is time period in the model. F represents a vector of production functions, with A denoting a vector of exogenous sectoral technology variables, C denoting exogenous climate variables, and O representing other goods and services, set equal to exogenous path E determined by global income growth. For a consistent representation of the future global economy, including population, income, and climate, we use the 'business as usual' (SSP2) scenario available in Shared Socioeconomic Pathways database (Riahi et al
2017).
is global population, u is per capita utility derived from final consumption goods y, and t is time period in the model. F represents a vector of production functions, with A denoting a vector of exogenous sectoral technology variables, C denoting exogenous climate variables, and O representing other goods and services, set equal to exogenous path E determined by global income growth. For a consistent representation of the future global economy, including population, income, and climate, we use the 'business as usual' (SSP2) scenario available in Shared Socioeconomic Pathways database (Riahi et al
2017).
Preferences of a global representative consumer are modeled with An Implicit Directly Additive Demand System (Rimmer and Powell 1996). This demand system is very flexible in its description of the evolution of consumer demands, with marginal budget shares for staple foods falling toward zero as per capita income rises. This flexibility plays an important role in governing the competition for land over a long time horizon with significant increases in per capita income.
We highlight the United States—a region where we have better data, and disaggregate the production side of the global economy into the USA and the Rest of the World (RoW). Within each of the two regions, the global land endowment is split into biomes, and competition for land between agriculture and forests occurs within each biome (figure 2(a)). Crop, livestock, and timber production functions are biome-specific. Crop and livestock production activities are represented with nested constant elasticity of substitution functions. The timber sector output in each biome and each forest age class is a product of harvested area and timber yield. Timber yield functions for accessible and inaccessible forests are based on Tian et al (2016). The important difference between the two is that the specification of accessible forest yield considers the impacts of timber management on biophysical yield.
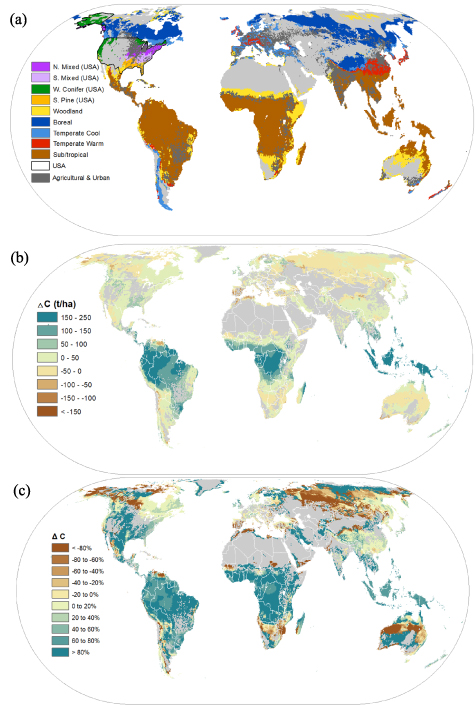
Figure 2. Biomes projected by MC2 DGVM and changes in aboveground forest and woodland carbon stock over the course of the 21st century. (a) Forest and woodland biomes in the MC2 model. Absolute (b) and relative (c) changes in carbon stock between recent historical period (1983–2021) and the end of the 21st century (2070–2099) produced by MC2 DGVM under the reference climate change scenario, a high-warming scenario analogous to RCP 8.5 (Kim et al 2017). The △C maps represent the average of 70 simulations performed under the reference scenario. The 70 simulations result from seven variations in model configurations, each variation replicated ten times to capture variability in MC2's stochastic behavior. The variations in model configurations include different climate sensitivity, net aerosol forcing, and natural variability (initial conditions) and are described in detail in section 2.1 and table 1 in Kim et al (2017).
Download figure:
Standard image High-resolution imageProduction of the land-based consumption goods, as well as intermediate inputs required to produce these goods, are explicitly modeled within this framework. A composite of all other goods and services is used as intermediate input as well as representing competing final consumption. The production of these other goods and services is not explicitly modeled but is set equal to exogenous path E in (1), and for this reason, the model is termed partial equilibrium.
By solving the global welfare maximization problem (1) we find the optimal age class and area of timber harvest, optimal paths of the intensity of investments in forest management at replanting time (which are fixed for the life of the tree), the area of forests to manage for timber production, the area of forests to leave in a natural state, cropland and pasture areas, and other resource allocation. The solution also finds optimal forest stocks which are a function of the timber investments and the land area in forests (both managed and natural). Details of the model and implementation of the forest carbon sequestration policies are provided in the SI.
3. Results
3.1. Ecological impacts on forest carbon stock
To gauge the ecological effects of climate change on forest carbon stock, in isolation from market interventions, we examine the output from MC2 DGVM runs under the Reference emissions scenario (Kim et al 2017), a scenario analogous to Representative Concentration Pathway 8.5 (RCP 8.5) used by the IPCC (Riahi et al 2011). The model predicts that while most of the biomes are geographically stable (Kim et al 2017), the carbon stocks of most forests around the world will increase over the course of this century. Large gains are projected in tropical forests in South America, Sub-Saharan Africa, and South-East Asia. In contrast, temperate forest regions are projected to see productivity increases offset by carbon loss to fire, and boreal forests in Alaska, Canada and Russia are projected to lose carbon (figures 2(b) and (c)).
3.2. Ecological and economic impacts on forest carbon stock
Impacts of climate change on forests simulated by MC2 are passed to the economic model in the form of calibrated functions (figure 3). When the effects of climate change on managed and natural forests are integrated with the economic drivers under SSP2 assumptions, but no carbon policies are considered, the integrated model projects that global forest carbon stocks increase by 121 gigatons of carbon (Gt C) by 2100, a significant increase relative to the 263 Gt C at the beginning of the century. Most of this increase in carbon, 104 Gt C, or 86%, results from changes that are predicted to occur without climate change (table 1). A large increase (520 Mha) in managed forest area globally leads to a 44.2 Gt C increase in carbon storage by 2100. This increase in managed forests is derived from existing natural forests (33%) and pastureland (67%). Cropland increases modestly, by about 14 Mha by the end of the century, but most increases in food production occur through intensification of existing crop and livestock production. There is a small increase in the carbon stock of 2.3 Gt C (0.02 t C ha−1 yr−1) in managed forests, resulting from the combined effects of increases in management intensity and changes in timber rotation ages. A large increase in carbon, 69.4 Gt C (0.22 t C ha−1 yr−1), occurs in natural forests, resulting from shifts in the age class distribution toward older trees.
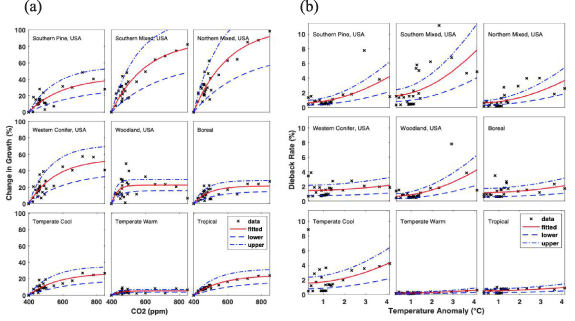
Figure 3. Impacts of climate change on forests. (a) Relationship between CO2 concentration and change in forest growth, defined as the percent change in new tree biomass growth over the course of one decade, in five biomes in the United States (Southern Pine, Southern Mixed, Northern Mixed, Western Conifer, and Woodland) and four biomes in the rest of the world (Boreal, Temperate cool, Temperate warm, Tropical). Forest growth in the Woodland biome in the RoW does not change with increased CO2 concentration. (b) The relationship between temperature anomaly (relative to the beginning of the 21st century) and dieback rate is defined as the percent reductions in forest stocks per decade due to forest fires. The relationship for the Woodland biome in the RoW is similar to the one for Temperate Warm in the RoW and is not shown. Crosses are simulation results from the MC2 DGVM (Kim et al 2017) for the three emissions scenarios (see section 5 in the supplementary information). The solid line represents the fitted relationship between change in timber growth and CO2 concentration (a) and dieback rate and change in global surface temperature (b). Dashed lines represent lower and upper bounds on fitted relationships.
Download figure:
Standard image High-resolution imageTable 1. Net changes in aboveground carbon storage in global forests in the no-climate-impact baseline contrasted with the results including the impacts of climate change on forests, decomposed into direct effects of dieback and forest growth, and the indirect effect of crop productivity. Positive (negative) values indicate a gain (loss) of C from (to) the atmosphere and an increase (reduction) in carbon storage. The upper and lower bounds in parentheses show uncertainty in the changes in carbon storage. The uncertainty is quantified using upper and lower bounds on the relationship between atmospheric CO2 concentration and timber growth (figure 3(a)) and the relationship between change in global surface temperature and dieback (figure 3(b)). Upper and lower bounds on the relationship between global surface temperature and crop yields are set at ±50% of the central impact. The uncertainty in the carbon stock change due to all three CCI is quantified using a combination of upper (lower) bounds on the fitted relationship between change in global surface temperature and dieback, lower (upper) bounds on the fitted relationship between CO2 concentration and timber growth, and upper (lower) bounds on the relationship between global surface temperature and crop yields.
| 2000–2050 | 2050–2100 | 2000–2100 | |
|---|---|---|---|
| Gt C | |||
| Baseline (no climate impacts) | |||
| Managed forest area change | 17.6 | 26.6 | 44.2 |
| Forest management changes | −0.4 | 2.6 | 2.3 |
| Natural forest area change | −7.7 | −3.9 | −11.5 |
| Natural forest biomass accumulation | 54.2 | 15.1 | 69.4 |
| Net w/o climate change impacts | 63.8 | 40.5 | 104.3 |
| With climate change impacts | |||
| Dieback climate effects | −4.2 (−7.8, −0.6) | −5.9 (−9.2, −2.5) | −10.1 (−17.0, −3.1) |
| Forest growth climate effects | 10.3 (5.8, 15.4) | 19.6 (13.0, 25.3) | 29.9 (18.8, 40.7) |
| Crop productivity climate effects | −1.5 (−2.4, −0.7) | −1.4 (−2.3, −0.6) | −2.9 (−4.6, −1.3) |
| Net with climate change impacts | 68.5 (59.6, 78.0) | 52.7 (41.5, 62.7) | 121.2 (101.1, 140.6) |
In our integrated model, climate change is projected to add 17 Gt C (0.04 t C ha−1 yr−1) in aboveground carbon storage globally by 2100 (table 1). This net change is composed of a 10 Gt C emission due to additional dieback in forests, a 30 Gt C increase due to additional carbon fertilization, and a 3 Gt C loss due to deforestation caused by the encroachment of cropland into forests in the wake of reduced farm productivity. The effects of climate change on forests, both through dieback and forest growth, accelerate through the century.
Considering the effects of climate change on forest growth in isolation from the effects on dieback and crop yields, nearly all forested regions in the world are predicted to experience an increase in biomass by 2100 compared to the no-climate-impact baseline (green bars in figure 4). Even though climate change causes forest growth to increase in the temperate warm biome of the rest of the world (figure 3(a)), the increase is the smallest across biomes. This gives agricultural activities in this biome a comparative advantage relative to biomes with larger increases in timber growth. As a result, pasture and cropland expand, and forests contract in the Temperate Warm biome in the RoW, relative to the baseline.
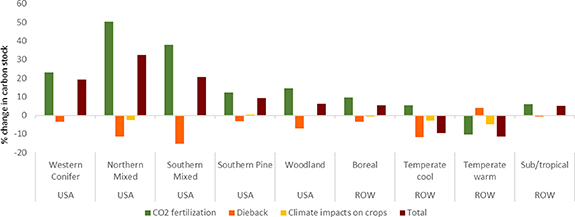
Figure 4. Impact of climate change on aboveground forest carbon stock in managed and natural forests in 2100 by biome, %. The impacts are calculated as the difference between forest carbon stock with and without impacts of climate change in 2100, relative to forest carbon stock in 2100 when climate impacts are not considered. Green ( ), orange (
 ) and yellow (
 ) columns show deviations in forest carbon stock when impacts of climate change on growth, dieback, and crops, respectively, are incorporated into the model one at a time. Brown columns (s) show deviations in forest carbon stock when all three impacts are incorporated into the model.
  . The reduction in forest carbon stock in the Woodland biome in the RoW is small (0.28%) and not shown.
Download figure:
Standard image High-resolution imageIf dieback is the only effect of climate change, the integrated model predicts that all forested biomes, except the Temperate Warm biome in the RoW, will contain less carbon in 2100 compared to the baseline without climate impacts (orange bars in figure 4). The forest carbon losses are the largest in forest types that have the largest increases in dieback with global warming, such as Southern Mixed forests in the United States and Temperate Cool forests in the RoW. While these changes are largely driven by the direct effect of climate change on forest stocks (figure 3(b)), the indirect price effects also play an important role. More dieback makes forestry less productive, thereby raising timber prices, and inducing natural forests with high carbon stocks to be harvested and converted to managed forests and agriculture. Increasing dieback also alters the comparative advantage of forestry and agriculture across biomes. Dieback rates in the Temperate Warm biome of the RoW are small initially and not very sensitive to global warming (figure 3(b)), making this biome relatively more attractive for forestry production. As a result, managed forests expand mostly at the expense of agricultural lands, and forest carbon stock increases relative to the baseline in the Temperate Warm biome of the RoW.
Global warming results in reduced average crop yield (Challinor et al 2014), which in turn leads to larger cropland area to meet global food demand. This is achieved by the conversion of forests to agricultural lands and results in a 0.8% reduction in global forest carbon stocks by the end of the century. Of course, this abstracts from other potential climate impacts. Globally, this indirect impact is small compared to the direct impacts of climate change on forests. The largest impact is observed in the Temperate Warm biome in the RoW where a global reduction in crop yields results in the expansion of agricultural lands at the expense of forests, and 4.7% reduction in carbon stock relative to the baseline (yellow bars in figure 4).
When all three climate effects are modeled together (brown bars in figure 4), all U.S. biomes experience an increase in carbon stock, with Northern Mixed gaining the most in relative terms. In the RoW, temperate biomes accumulate less carbon when all of the effects of climate change are considered. The Temperate Cool biome of the RoW experiences a reduction in carbon over the century because the increase in forest carbon stock in this biome due to the global effects of climate change on forest growth is not large enough to overcome the global effects of dieback and increased demand for land caused by the climate-driven reduction in crop yields. In the Temperate Warm biome of the RoW, the comparative advantage in timber production due to small and insensitive to climate change dieback rates does not offset the comparative disadvantage due to low increase in timber growth rates and effects of the global reduction in crop yields.
3.3. Costs of forest carbon sequestration policies
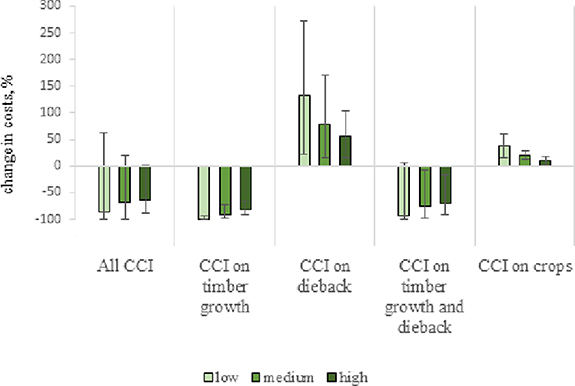
To consider the effects of CCI on the cost of carbon policy, we explore the costs implications of reaching three higher levels of the global forest carbon stock by 2100—low (5% higher), medium (10% higher) and high (20% higher). Each of these policies is implemented as a lower bound constraint on forest carbon stock in the model. The target forest carbon stock in 2100 is calculated relative to the projected stock of 368 Gt C in 2100 in the no-climate-impact baseline, resulting in 386, 405, and 442 Gt C targets in 2100. The first set of bars in figure 5 (All CCI) reports the consequences for the cost of achieving these three levels of carbon sequestration when all three climate impacts are factored into the analysis. In every case, the central outcome involves a cost reduction, ranging from 86% reduction for the low to 64% reduction in the case of the high increase in the global forest carbon stock. However, our bounding analysis shows that we cannot rule out the possibility that climate impacts might raise mitigation costs. The potential increase in costs is driven explicitly by scenarios that assume dieback rates take on their most extreme values (upper bounds in figure 3(b)). However, as the overall carbon sequestration target becomes more ambitious, the uncertainty range of relative change in costs is diminished.
Figure 5. Change in the cost of reaching forest carbon stock targets due to climate change impacts (CCI) relative to the costs of reaching the same targets under no climate impacts assumption, %. Low, medium, and high targets correspond to global forest carbon stocks increased by 5%, 10%, and 20% in 2100 relative to optimal forest carbon stock in the no-climate-impact baseline. Costs of the policies are evaluated when all CCI, on timber growth, dieback, and crop yields (first set of bars), only CCI on timber growth (second set of bars), only CCI on dieback (third set of bars), CCI on both timber growth and dieback (fourth set of bars), and only CCI on crops (fifth set of bars) are considered. Error bars show uncertainty in the relative change in forest carbon sequestration costs due to uncertainty in climate change impacts on forests and crops. The uncertainty is quantified as described in the table 1 caption. The uncertainty in the change in costs due to both CCI on timber growth and dieback is quantified using a combination of upper (lower) bounds on the fitted relationship between change in global surface temperature and dieback, and lower (upper) bounds on the fitted relationship between CO2 concentration and timber growth to find a positive (negative) error.
Download figure:
Standard image High-resolution image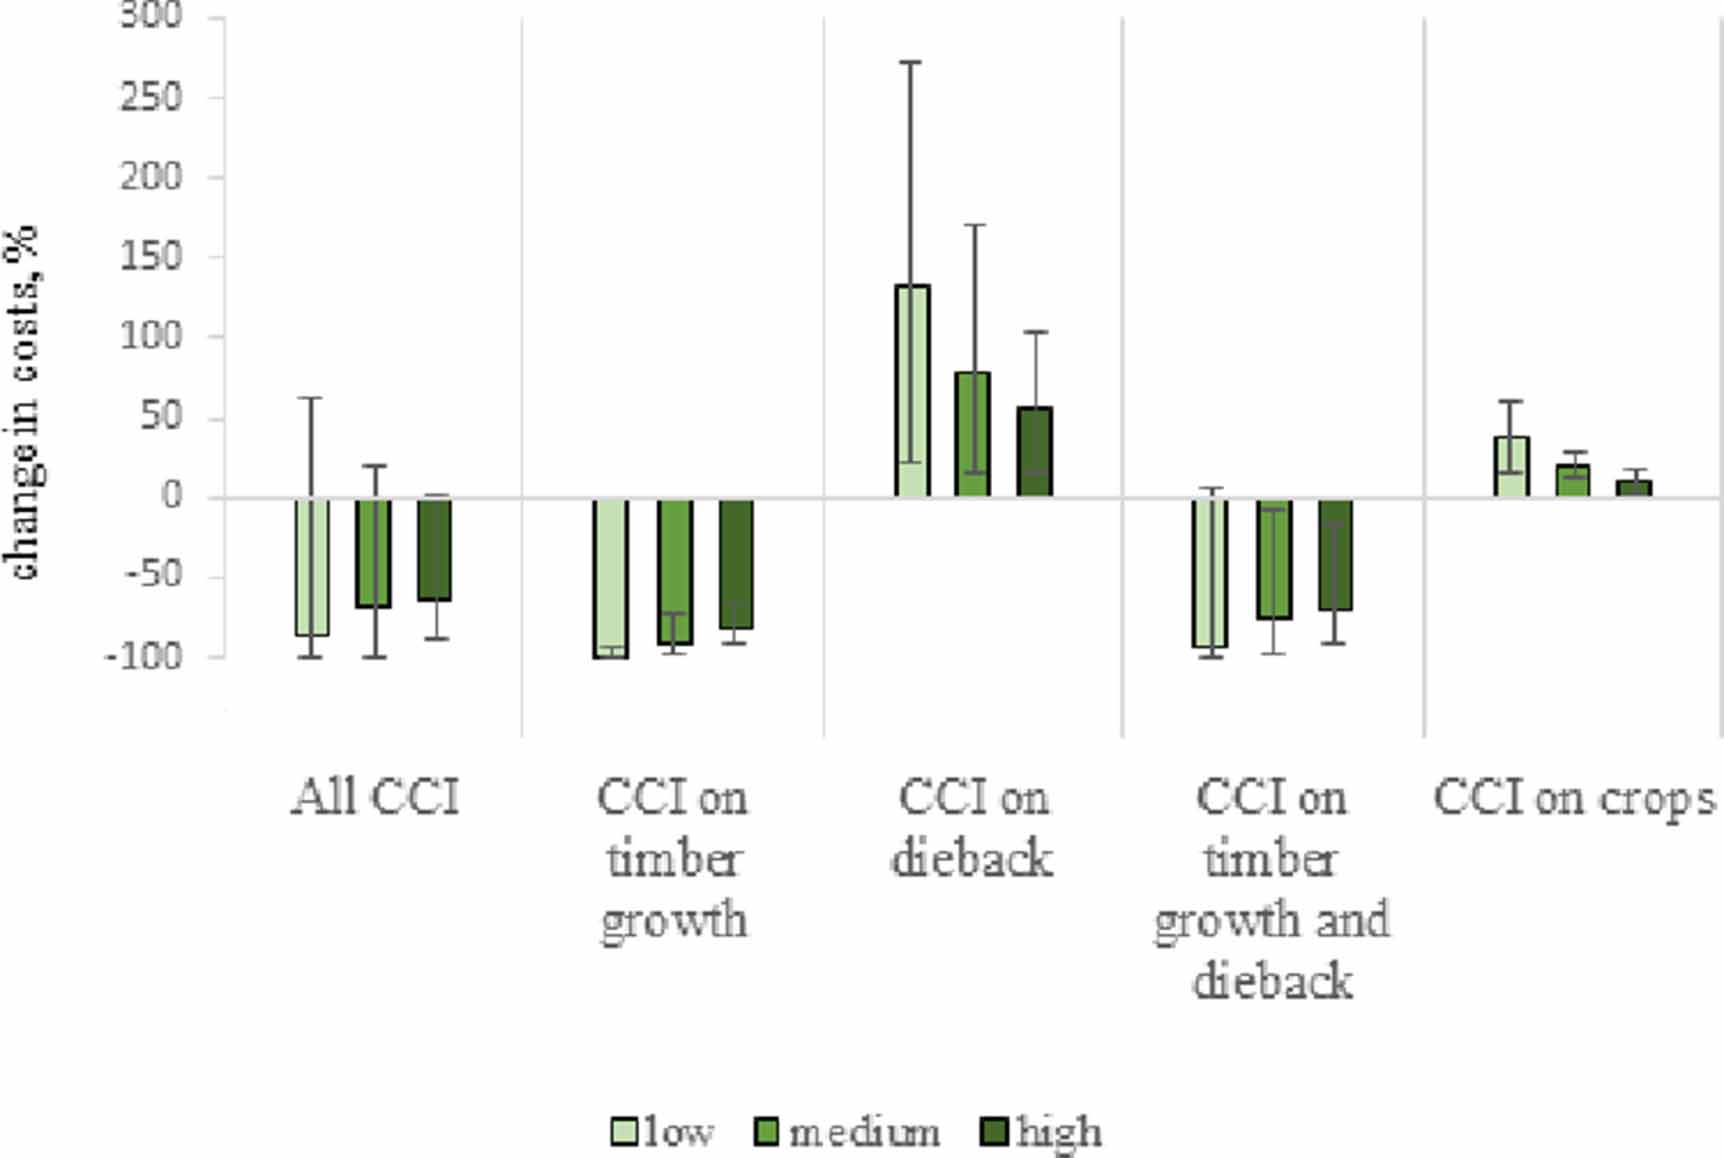
4. Discussion
4.1. Changes in forest carbon stocks
We find that accumulation of carbon due to the aging of global natural forests in the no-climate-impact baseline results in increase in forest carbon stock by 0.22 t C ha−1 yr−1 over the course of the 21st century. The accumulation starts from a rate of 0.44 t C ha−1 yr−1 during the first decade (2000–10) that declines toward the end of the century (table 4 in the SI). The predicted global annual increases in our model are smaller than 1.04 t C ha−1 yr−1 for the period 1990–2007 calculated using inventory data in Pan et al (2011), but our no-climate-impact baseline does not include changes in carbon fertilization and we do not measure carbon in soil. In tropical natural forests, the model predicts increase in carbon storage by 0.39 t C ha−1 yr−1, starting from a rate of 0.72 t C ha−1 yr−1 in the first decade that gradually declines to 0.08 t C ha−1 yr−1 by the end of the century (table 4 in the SI). For purposes of comparison, using African inventory plots and published inventory data for Amazonian forests, Hubau et al (2020) report a stable carbon sink in aboveground biomass at 0.66 t C ha−1 yr−1 in African but a decline from 0.35 to 0.24 t C ha−1 yr−1 in Amazonia tropical forests over 1985–2015.
The 17 Gt C increase in aboveground forest carbon stock due to impacts of climate change in this study is smaller than the 26 Gt C potential by 2115 suggested in Tian et al (2016), as Tian et al (2016) do not account for the effects of climate change in the agricultural sector and their impacts on forests. Favero et al (2021) use the LPX-Bern DGVM model (Stocker et al 2013) and a dynamic economic model (Sohngen et al 2001, Sohngen and Mendelsohn 2003, Favero et al 2018), and report an increase of 88 Gt C under RCP 8.5 in all forest carbon pools in 2100, 10% more than under their no-climate-change scenario. To compare in relative terms, we calculate 16% increase (17 Gt C) relative to our no-climate-change baseline in 2100 (104 Gt C). There are other differences between Favero et al (2021) and this study. SSP5 economic growth and RCP 8.5 temperature increases behind Favero et al (2021) results are stronger than SSP2 economic growth and the ensuing changes in climate used in this analysis. The predicted change in land use also plays an important role in the difference between the results. Our integrated model finds a more limited expansion in forest area under climate change because of competition with agriculture. A large and important uncertainty that influences carbon, however, relates to the potential expansion of forests in regions that currently are classified as tundra. Favero et al (2021) allow substantial increases in temporal and boreal forests, but those increases occur largely after 2100 in that analysis.
4.2. Decomposition of changes in forest carbon sequestration costs
We find that when all three impacts of climate change on forests are taken into account, the central outcome is the reduction in costs of forest carbon sequestration. For each policy considered—low, medium and high ambition, the reduction is decomposed by the underlying drivers of CCI on the forest carbon sequestration costs. The second set of bars in figure 5 shows that the changes in forest growth rates caused by climate change are projected to lower the costs of climate mitigation in the range from 99% for the low to 81% for the highest increase in the global forest carbon stock. In fact, the changes in forest growth are almost sufficient to achieve 386 Gt C of forest carbon stock in 2100, our low target, without any additional policy measures. As a result, the incremental cost of attaining a modest forest carbon policy goal would be negligible. However, as the ambition of the sequestration target rises, the proportional reduction in cost contributed by increasing forest growth rates declines.
In contrast to the impact of the climate-driven increase in forest growth rates, the climate-driven increase in dieback rates raises the cost of forest carbon sequestration policy by more than 70%, although the proportional effect on costs declines as policy ambition increases (third set of bars). The uncertainty range stemming from the parametric bounding analysis also shrinks as the policy ambition increases from low to high suggesting that when growth and dieback effects are combined (fourth set of bars), the error bars no longer extend into the positive region. That is, even with the largest climate-driven increases in dieback and lowest increases in forest growth we examine, climate change is expected to reduce the costs of climate change mitigation in forestry. This allows us to conclude that, for an ambitious forest carbon sequestration policy, climate impacts on forests are expected to reduce the global economic costs of achieving this target.
The last set of bars in figure 5 adds the final piece of climate impacts to our analysis—namely the consequences of reduced crop yields. As expected, when rising temperatures lead to lower global average crop yields, there is an incentive to expand cropland area, relative to the no-climate-impact baseline. This creates additional competition for land, thereby raising the cost of forest carbon sequestration by 11%–38%. The increase, relative to the baseline, is diminished as the carbon sequestration policy becomes more ambitious. However, in every case, the uncertainty bars show that the cost of forest carbon sequestration increases. And it is the inclusion of the impacts on agriculture, in addition to the direct impacts of climate change on forests carbon stocks, that widens the uncertainty range, making the increase in mitigation costs a potential outcome (contrast the error bars associated with the first set of columns with those associated with the fourth set). This highlights the importance of including agricultural impacts in any analysis of climate change and forest carbon sequestration policies.
4.3. Limitations
Limitations exist in our current model, which provide directions for future work. First, the model is highly spatially aggregated, with only two regions (the United States and the Rest of the World), six biomes, and a single agricultural output in each biome. The aggregation does not allow the representation of detailed climate impacts and the economic responses in the Rest of the World region. An increase in the number of regions and biomes will allow accounting for the differential effects of climate change across space. Second, while forests will be shaped by multiple disturbance agents in the future, including drought, fire, and insect and pathogen outbreaks, here we focus primarily on changes in fire regimes. Third, MC2 simulations indicate that while climate change leads to a reduction in forest carbon stock in some biomes and an increase in others, globally forest carbon stock may increase under a warmer climate, driven by longer growing seasons and the positive effect of CO2 enrichment that outweigh the negative effect of higher dieback rates. However, recent studies call into question whether higher CO2 concentrations will enhance the capacity of mature forests to act as carbon sinks (Jiang et al 2020). On the other hand, forest wildfires may lead to shifts in tree species that effectuate a net increase in carbon storage (Mack et al 2021). Indeed, the role of wildfire is a key source of uncertainty in global vegetation simulations. More research is needed to quantify uncertainty in the impacts of climate change on forests.
5. Conclusions
Forest carbon sequestration is a critical tool for any effort to keep the global temperature below a 1.5 or 2 °C threshold (IPCC 2018, 2022, Roe et al 2019). However, the cost of sequestration in forests depends on the effects of climate change and this study is the first to quantify how climate change may influence those costs. We do so by integrating the output from MC2 DGVM (Kim et al 2017) with a dynamic economic model of the global forest and agricultural sectors. Because forest carbon represents a stock that takes many years to accumulate, but can be lost rapidly with disturbances like fires, it is critical to deploy a dynamic economic model to measure both the costs of carbon sequestration in forests, as well as the impacts of climate change on forested ecosystems.
Market, natural, and climatic drivers contribute to a predicted 121 Gt C increase in carbon in forests over the course of this century. Market drivers, including the establishment of new forests, forest management, and conversion of natural forests to managed forests or agriculture lead to a net increase of 35 Gt C, while the accumulation of carbon due to the aging of natural forests leads to a net increase of 69 Gt C. Climate change impacts, represented by changes in dieback, forest growth, and indirect effects due to lost crop productivity, contribute a net gain of 17 Gt C.
The simultaneous impacts of climate change on forests and agriculture result in 64%–86% reduction in costs of reaching a range of global forest carbon stock targets in 2100. The increases in climate-driven forest growth rates are projected to reduce these costs, while the increases in dieback rates are projected to raise them. When combined, these two direct impacts are expected to reduce the costs of climate change mitigation in forests. The inclusion of the third, indirect impact of climate change on forests through reduction in crop yields and resulting expansion of cropland, raises the costs and widens the uncertainty range.
The results illustrate the importance of incorporating each of the effects of climate change on forests when calculating carbon sequestration costs. Ignoring climate change entirely will lead to cost estimates that are more than double, however focusing only on the effects of carbon fertilization on forest growth, without modeling the effects of changes in disturbance, as well as changes in crop productivity, can also lead to understating carbon sequestration costs. The MC2 DGVM predicts dieback increases in all biomes as a result of climate change, with the largest increases predicted to occur in the Southern Mixed biome in the United States and the Temperate Cool biome in the Rest of the World. The effects of dieback increase carbon sequestration costs by more than 80% in low and medium size policies considered here. The analysis presented in this paper highlights the key role of dieback in determining the contribution of climate change to mitigation costs. Given how poorly the relationship between dieback and climate change is understood, we suggest that this is a high priority for future research.
Although concerns about permanence and potential losses in forest stocks due to disturbance have been raised, the results of this study suggest that these risks are modest. For instance, even when dieback effects are at their highest levels in our model, and forest growth effects are at their lowest levels, climate impacts are still expected to reduce the costs of climate change mitigation in forestry. An important reason for this outcome is that our model allows for decision makers to anticipate the effects of dieback and therefore they expend more mitigation effort in those regions that are less exposed to dieback.
Current integrated assessment models (IAMs) do not include many of the features of this study, including forest management and CCI, suggesting that their results likely understate the potential for forests to contribute to climate change mitigation. We predict a large potential flux in carbon contributed by shifts in managed forests; this expansion is much greater than that predicted by the current suite of IAMs (Roe et al 2019). Therefore, it is critically important to introduce more realistic forest management into IAMs so that they can more accurately capture the cost of forest carbon sequestration under a changing climate.
Acknowledgments
We appreciate the valuable suggestions from anonymous referees that improved the paper. AG, BS, YC and TH acknowledge research funding from the United States Department of Agriculture NIFA-AFRI (2015-67023-22905) and National Science Foundation (SES-1463644) under auspices of the RDCEP project at the University of Chicago. TH acknowledges support from NSF-CBET 1855937. JK acknowledges support from the U.S. Environmental Protection Agency (interagency agreement IA-11261952.
Data availability statement
The data that support the findings of this study are available upon reasonable request from the authors.
Supplementary data (0.4 MB PDF)