

Abstract
The relationship between meteorological factors and the risk of hand, foot, and mouth disease (HFMD) has been well documented. However, researchers have failed to consider the complex interactive relationships among meteorological factors. The weekly number of HFMD cases along with meteorological factors were collected between 2009 to 2017 in four cities in Guangdong Province. We used Bayesian kernel machine regression to investigate the nonlinear and interactive relationship between meteorological factors, such as temperature and humidity, on the risk of HFMD. Multivariate meta-analysis was used to pool the city-specific effect estimates and identify factors underlying the inter-city heterogeneity. The risk ratios (RRs) for each percentile increase in temperature from the 50th percentile value, while humidity was at its 10th, 50th, and 90th percentile values, were 1.621(95%CI: 1.226, 2.141), 2.638(2.169, 3.208), and 3.734(2.908, 4.792), respectively (Q= 19.132, Pinteraction< 0.001). In contrast, the RRs for each percentile increase in humidity from its 50th percentile, while holding temperature at its 10th, 50th, and 90th percentile values, were 0.901(95%CI: 0.592, 1.369), 2.026(1.679, 2.448), and 0.884(0.632, 1.238), respectively (Q= 24.876, Pinteraction < 0.001). Increased wind speed and sunshine duration were also observed to strengthen the impact of other meteorological factors. Furthermore, we found increased gross domestic product per capita and per capital area of parks and green land in city tended to significantly strengthen the interactive effects of humidity on other meteorological factors including sunshine duration (P = 0.013 and 0.042), rainfall (P = 0.017 and 0.035), temperature (P = 0.021 and 0.031), win speed (P = 0.011 and 0.045), and pressure (P = 0.013 and 0.042). Our study contributed further understanding of complex interactions between meteorological factors on the risk of HFMD. Our findings provide epidemiological evidence for meteorological interactions on HFMD, which may provide knowledge for future research on the health effects of meteorological factors.
Export citation and abstract BibTeX RIS

Original content from this work may be used under the terms of the Creative Commons Attribution 4.0 license. Any further distribution of this work must maintain attribution to the author(s) and the title of the work, journal citation and DOI.
1. Introduction
Hand, foot, and mouth disease (HFMD) is a contagious disease. Large, severe outbreaks affecting thousands of people occurred frequently particularly in the Asian-Pacific regions such as China (Hong et al 2022), Singapore (Min et al 2021), Japan (Gonzalez et al 2019), India (Rao et al 2017), Malaysia (Lee et al 2021), and New Zealand (Hayman et al 2014). Usually, HFMD is self-limiting, but a small proportion of children may experience severe complications such as meningitis, encephalitis, acute flaccid paralysis and neurorespiratory syndrome, leading to death. Therefore, HFMD has become one of the leading public health concerns in the world.
The relationship between meteorological factors and the risk of HFMD has been widely studied. For example, Kim et al found that the HFMD rate increased by 10.3% and 6.6% for every unit rise in average temperature and relative humidity below the cutoffs of 18 °C and 65%, and then decreased as temperature and humidity increased (2016). Gou et al found that the increase in weekly HFMD incidence were associated with every unit increase in average temperature (2.8% increased in HFMD incidence), and relative humidity (2.47%) in Lanzhou (2018). Abdul Wahid et al found that the risk of HFMD increased with rainfall below 60 mm and decreased with rainfall exceeding 60 mm (2021). One of our previous studies also showed an increase in risk up to 23.5 °C temperature and decreased passed this point while risk was increased with increasing relative humidity (Du et al 2019a).
This evidence suggests a potential adverse impact of multiple meteorological factors on the risk of HFMD. The mechanism behind the relationship between meteorological factors and HFMD remains unsure. Several proposed factors, including pathogen infectivity outside the host, human behavior, and immune function fluctuations, could be involved in the risk of HFMD (Fares 2013). For example, during the suitable weather time, individuals are more likely to have outdoor activities, thereby it may increase the chances that susceptible individuals contact with infectious individuals or contaminated environment. In addition, according to the previous studies in the laboratory, the reproduction and survival rates of the enterovirus that cause HFMD are strongly affected by fluctuations in environment (Arita et al 2005).
Although a plenty of evidence on the association between meteorological exposures and the risk of HFMD was available, significant gaps remain in our understanding of interactions among these factors on the occurrence of HFMD. Such knowledge would provide a better understanding of the meteorological exposure periods that lead to the highest risk of HFMD and improve predictions in the temporal trend for HFMD epidemics. However, the existing evidence is limited. Zhang et al assessed the interactive effects between temperature and humidity by including an indicator of high/low temperature/humidity in models but did not find any significant estimates (2016). This study was limited by it is statistical techniques, given that converting two continuous variables into a single categorical variable would increase uncertainty in the results due to the loss of information. In our previous studies, we used classification and regression tree models to evaluate the association of HFMD incidence with temperature, humidity, and air pressure, while allowing the interactions among meteorological factors to be examined (Du et al 2016). Risk of HFMD was higher when the temperature was greater than 24 °C and the relative humidity was less than 61% such as during non-autumn seasons. However, our study was only able to classify HFMD risk by meteorological factors with cutoff values and could not consider continuous interaction effects of meteorological factors (i.e. regression coefficients or RRs). In addition, only a very few interactions between meteorological factors have been considered in the available studies. Given the highly correlated nature of meteorological factors, it is imperative to include multiple interaction terms. Furthermore, health impacts of meteorological events are likely to be nonlinear, leading to an increased complexity of the models.
To address these methodology gaps and add new evidence for the interactive relationship among meteorological factors, we used Bayesian kernel machine regression (BKMR) to investigate interactive effects among the possible meteorological factors on the risk of HFMD while minimizing the uncertainties that arise in traditional models. In addition, we explored the city-specific factors that were attributed to the heterogeneity of interactive effects between cities on HFMD.
2. Methods
2.1. Study area
Guangdong is a coastal province in southern China with a humid subtropical climate. According to the statistical yearbook, 21 cities in Guangdong are divided into four regions: (a) the Pearl River Delta, including, Guangzhou, Shenzhen, Zhuhai, Foshan, Huizhou, Dongguan, Zhongshan, Jiangmen, and Zhaoqing; (b) the East, including, Shantou, Shanwei, Chaozhou, and Jieyang; (c) the West, including, Yangjiang, Zhanjiang, and Maoming; (d) the North, including, Shaoguan, Heyuan, Meizhou, Qingyuan, and Yunfu. Among these counties, Guangzhou (506 757 cases), Shantou (72 321 cases), Zhanjiang (64 983 cases), and Meizhou (88 868 cases) were suffering from the heaviest burden of HFMD between 2009 and 2017 among all the cities in their corresponding regions. Guangzhou was selected as the primary study area to assess meteorological effects, and Shantou, Zhanjiang, and Meizhou provided secondary comparisons (e.g. additional population for analysis), and to assess variation across cities.
2.2. Case data
The weekly number of HFMD cases reported from the four cities during the study period were collected from the Centre for Disease Control and Prevention (CDC) of China. Beginning in May 2008, all clinically diagnosed and laboratory confirmed HFMD cases were statutorily reported to the China CDC. A clinically diagnosed HFMD case was defined as a patient with papular or vesicular rash on hands, feet, mouth, or buttocks, with or without fever. A confirmed case was defined as a clinically diagnosed case with laboratory evidence of enterovirus infection (including EV71, coxsackievirus A16 (CVA16), or other non-EVA71 and non-CVA16 enteroviruses) detected by reverse-transcriptase polymerase chain reaction (RT-PCR), real-time RT-PCR, or virus isolation. All the individual cases were organized by city and date into weekly case counts for each city in Guangdong Province.
2.3. Meteorological data
We collected meteorological data including temperature (°C), humidity (%), rainfall (mm), barometric pressure (hPa), wind speed (m s−1), and sunshine duration (h) from the China Meteorological Data Service Center (http://data.cma.cn/). According to the layout of the national monitoring sites, a total of 36 monitoring sites were distributed across Guangdong with each city having at least one monitoring site. The meteorological data were used to calculate the weekly average meteorological exposures in each city. In Guangzhou, the average values of meteorological factors were 22.1 °C (temperature), 78.3% (humidity), 37.3 mm (rainfall), 10 074.7 hPa (pressure), 20.4 m s−1 (wind speed) and 45.0 h (sunshine duration per week), respectively (table S1).
2.4. Data of potential effect modifiers
In this study, we considered multiple factors at the city-level which may modify the association between meteorological exposures and the risk of HFMD across the cities. Specifically, we included annual average meteorological factors and multiple socio-economic factors including per capita gross domestic product (GDP) (RMB, Yuan), population density (person km−2), rate of sewage treatment (%), rate of consumption waste treatment (%), per capita passenger traffic (no.), and per capital area of parks and green land in city (m2). All of the socio-economic factors were collected from the Guangdong Statistical Yearbook (http://stats.gd.gov.cn/gdtjnj/).
2.5. Statistical analysis
The kernel machine regression (KMR) model (Bobb et al 2018) was used to estimate the risk of HFMD as a function of meteorological exposures. The major advantage of KMR is that it allows the nonlinear impact of continuous exposures and more importantly the interactive effects between any two exposures while holding all other factors constant at a specific value. We specified our model as follows:
where caset
is the weekly number of HFMD cases, t is the index of week, i.e. 1,...52 × 9 (a total of 9 years), there were weeks with 0 incidence cases, which we replaced with 0.5 to avoid errors in the logarithmic function, h denotes the nonlinear association and interaction between meteorological factors on the risk of HFMD to be estimated, m = 1,...,6 (a total of six meteorological factors), β (β∼ N(0, σβ
2)) is the corresponding vector of coefficients of the trigonometric functions 'cos((2πt)/52) + sin((2πt)/52)' for modeling seasonality (time trend) as recommended (Meyer and Held 2017), and the residual  ∼ N(0, σ
2) is assumed to be independent and identically (iid) normally distributed with a common variance.
∼ N(0, σ
2) is assumed to be independent and identically (iid) normally distributed with a common variance.
We used the Gaussian kernel function to flexibly capture the various forms of h as follows:
where factorim and factorjm represent two different values of the m meteorological factor. rm denotes the tuning parameter that controls the smoothness of h as a function of factorm . In particular, we defined univariate exposure as the risk ratios (RRs) of HFMD over the range of a certain exposure while all the other meteorological factors were fixed at their median value. Similarly, we defined bivariate effect as the RRs of HFMD over the range of the first meteorological factor while the second factor was fixed at the 10th, 50th, and 90th percentiles and the rest of factors were fixed at their median value.
We fitted the KMR model in a Bayesian framework using Markov Chain Monte Carlo with 10 000 iterations. The prior distributions for the unknown parameters were specified as follows:


To assess the robustness of our findings which could be particularly sensitive to rm , we performed a sensitivity analysis by specifying a geometric sequence of rm values to fit separate models to each of the meteorological factors as recommended (Bobb et al 2018). In addition, we assessed model convergence using the trace plots of the variance of the residuals. All the trace plots showed a relatively constant mean and variance, indicating that the model has well converged (figure S11).
We examined the interaction between meteorological factors using the heterogeneity test in meta-analysis. Specifically, for each city, we estimated RRs per each unit increase in the first meteorological factor at its 50th percentile while the second meteorological factor was fixed at its 10th, 50th, and 90th percentile values (therefore, three RRs were obtained), respectively. For each RR, we then pooled city-specific estimates using meta-analysis based on linear mixed-effect model. The Cochran's Q statistic (which follows the Chi-square distribution) and its corresponding P value were obtained from the meta-analysis and were used to determine the significance of the interactive effects. A larger value of Q statistic represents a greater interactive effect. The relationships between the Q statistic and the city-specific factors were examined using the linear regression to identify differences in interaction effects among cities.
All statistical analyses were performed using R version 4.1.3 (the R Foundation for Statistical Computing, Vienna, Austria), including the packages of bkmr, metafor, and ggplot2. There was no missing value in these data.
3. Results
Figure S1 shows the long-term time trends of HFMD cases and meteorological factors in Guangzhou, in a time-series within a 1 year period. An intuitive relationship can be observed given that the peaks of temperature, humidity, rainfall, and sunshine duration occur at approximately the same time as the peaks in the HFMD cases. However, the peak occurrence times of pressure and wind speed were the inverse of the HFMD cases. Similar results were also observed in Shantou, Zhanjiang, and Meizhou (figures S2–S4).
Figure 1 shows the univariate effect of meteorological factors on the risk of HFMD in Guangzhou. An inverted V-shaped relationship was observed between the risk of HFMD and temperature, with the peak at about 62.5th percentile (22.0 °C). An inverted U-Shaped relationship was observed between the risk of HFMD and wind speed, with the peaks at about 62.5th percentile (3.2 m s−1). An almost linear relationship was observed between the risk of HFMD and pressure, rainfall, and sunshine duration. At the 50th percentile, the RRs were 1.773(95%CI: 1.458, 2.156) for temperature, 1.055(0.874, 1.274) for humidity, 1.013(0.739, 1.391) for rainfall, 1.017(0.871, 1.183) for pressure, 1.238(0.981, 1.558) for wind speed, and 1.016(0.878, 1.174) for sunshine duration, respectively (table 1). Similar results were observed in Meizhou and Shantou (tables S2, S3, figures S5 and S6), while Zhanjiang had its own characteristics (table S4 and figure S7).
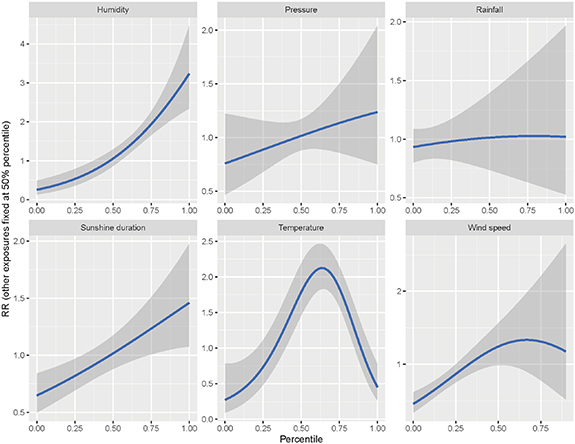
Figure 1. Univariate effect of meteorological factors on the risk of HFMD in Guangzhou.
Download figure:
Standard image High-resolution imageTable 1. The risk ratios of meteorological factors on HFMD at different percentiles in Guangzhou.
| Variable | Percentiles | ||||
|---|---|---|---|---|---|
| 10th | 25th | 50th | 75th | 90th | |
| Temperature | 0.396(0.190, 0.825) | 0.788(0.532, 1.178) | 1.773(1.458, 2.156) | 1.782(1.509, 2.107) | 1.031(0.792, 1.359) |
| Humidity | 0.342(0.198, 0.588) | 0.535(0.365, 0.786) | 1.055(0.874, 1.274) | 1.946(1.642, 2.306) | 2.668(2.090, 3.416) |
| Rainfall | 0.954(0.828, 1.100) | 0.981(0.818, 1.176) | 1.013(0.739, 1.391) | 1.026(0.634, 1.664) | 1.024(0.570, 1.842) |
| Pressure | 0.811(0.552, 1.193) | 0.889(0.689, 1.152) | 1.017(0.871, 1.183) | 1.135(0.862, 1.502) | 1.199(0.800, 1.804) |
| Wind speed | 0.614(0.509, 0.742) | 0.871(0.753, 1.005) | 1.238(0.981, 1.558) | 1.303(0.782, 2.207) | 1.206(0.532, 2.644) |
| Sunshine duration | 0.712(0.574, 0.884) | 0.819(0.693, 0.968) | 1.016(0.878, 1.174) | 1.232(1.007, 1.510) | 1.368(1.056, 1.772) |
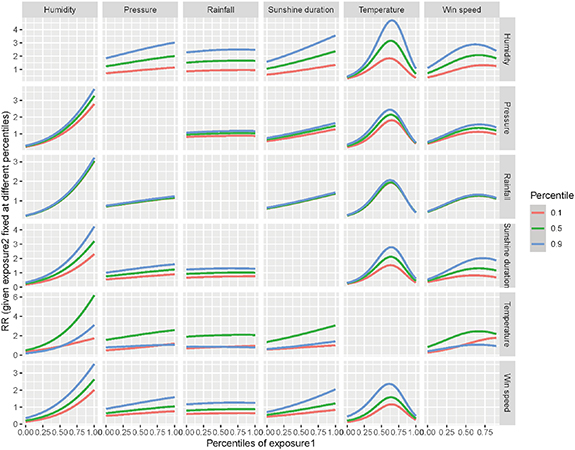
Figure 2 shows a bivariate relationship between two meteorological factors on the risk of HFMD in Guangzhou. As displayed in the first row of panels, with increased levels of humidity [10th (red curve) vs 50th (green curve) vs 90th (blue curve)], the risk of HFMD associated with the other meteorological factors including pressure, rainfall, sunshine duration, temperature, and wind speed also increased, with a curve for a greater percentile of humidity generally being higher than that for a smaller one. Similarly, we found that the pressure and rainfall had less interactive effects with other meteorological factors as limited disparities between the curves were observed. Based on our estimates, the sunshine duration and wind speed tended to have similar quantitative interaction as humidity with other meteorological factors. In contrast, temperature tended to modify the association between the risk of HFMD and other meteorological factors but not monotonously. These nonmonotonic interactions for meteorological factors indicated a higher level of effect on the risk of HFMD with the median temperature than the other temperature. Similar results were observed in Meizhou and Shantou (figures S8 and S9), while Zhanjiang had weaker interactions (figure S10).
Figure 2. Bivariate relationship of two meteorological factors with the risk of HFMD in Guangzhou.
Download figure:
Standard image High-resolution image
Table 2 presents the RRs of HFMD in Guangzhou for each meteorological factor fixed at its median value while considering an additional factor at its 10th, 50th, and 90th percentiles. In the case of temperature and humidity, the RRs were 1.621(95%CI: 1.226, 2.141), 2.638(2.169, 3.208) and 3.734(2.908, 4.792) at median temperature when the humidity was at its 10th, 50th, 90th percentiles, respectively (Pinteraction< 0.001). Alternatively, the RRs were 0.901(95%CI: 0.592, 1.369), 2.026(1.679, 2.448) and 0.884(0.632, 1.238) at median humidity when the temperature was at its 10th, 50th, 90th percentiles, respectively (Pinteraction< 0.001). For humidity and wind speed, the RRs for humidity held at its 50th percentile value were 0.621(95%CI: 0.491, 0.787), 0.854(0.708, 1.032) and 1.309(1.015, 1.688) when the wind speed was at its 10th, 50th, 90th percentiles, respectively (Pinteraction< 0.001). The RRs of wind speed when held at its 50th percentile value were 1.162(0.860, 1.563), 1.929(1.529, 2.423), and 2.766(2.017, 3.785) when the humidity was at its 10th, 50th, 90th percentiles, respectively (Pinteraction< 0.001). Similar results were observed in Meizhou and Shantou (tables S5 and S6), while Zhanjiang was observed with fewer significant interactions (table S7).
Table 2. The interactive effects between meteorological factors with the first factor at the median and the second factor at the 10th, 50th, and 90th percentiles in Guangzhou.
| First factor | Second factor | 10th | 50th | 90th | Pinteraction |
|---|---|---|---|---|---|
| Sunshine duration | Rainfall | 0.950(0.814, 1.108) | 0.959(0.829, 1.109) | 1.007(0.816, 1.242) | 0.903 |
| Humidity | 0.935(0.746, 1.172) | 1.645(1.423, 1.901) | 2.478(1.992, 3.082) | <0.001 | |
| Temperature | 0.792(0.531, 1.181) | 2.136(1.846, 2.471) | 0.978(0.730, 1.312) | <0.001 | |
| Wind speed | 0.627(0.521, 0.755) | 0.853(0.738, 0.986) | 1.260(1.003, 1.582) | <0.001 | |
| Pressure | 0.879(0.648, 1.191) | 1.027(0.889, 1.187) | 1.155(0.870, 1.533) | 0.434 | |
| Rainfall | Sunshine duration | 0.736(0.534, 1.013) | 1.005(0.732, 1.382) | 1.309(0.867, 1.976) | 0.086 |
| Humidity | 0.933(0.615, 1.418) | 1.642(1.195, 2.258) | 2.472(1.811, 3.376) | 0.001 | |
| Temperature | 0.850(0.450, 1.609) | 2.066(1.503, 2.843) | 0.862(0.576, 1.291) | 0.001 | |
| Wind speed | 0.643(0.458, 0.902) | 0.866(0.631, 1.189) | 1.253(0.854, 1.839) | 0.038 | |
| Pressure | 0.874(0.595, 1.282) | 1.025(0.747, 1.409) | 1.156(0.750, 1.782) | 0.628 | |
| Humidity | Sunshine duration | 0.755(0.561, 1.018) | 1.043(0.866, 1.258) | 1.380(1.107, 1.718) | 0.005 |
| Rainfall | 0.984(0.812, 1.192) | 0.993(0.823, 1.199) | 1.043(0.798, 1.367) | 0.938 | |
| Temperature | 0.901(0.592, 1.369) | 2.026(1.679, 2.448) | 0.884(0.632, 1.238) | <0.001 | |
| Wind speed | 0.621(0.491, 0.787) | 0.854(0.708, 1.032) | 1.309(1.015, 1.688) | <0.001 | |
| Pressure | 0.914(0.641, 1.305) | 1.066(0.884, 1.285) | 1.198(0.902, 1.589) | 0.504 | |
| Temperature | Sunshine duration | 1.299(1.031, 1.632) | 1.763(1.448, 2.146) | 2.278(1.689, 3.074) | 0.011 |
| Rainfall | 1.600(1.307, 1.957) | 1.622(1.334, 1.973) | 1.757(1.329, 2.325) | 0.859 | |
| Humidity | 1.621(1.226, 2.141) | 2.638(2.169, 3.208) | 3.734(2.908, 4.792) | <0.001 | |
| Wind speed | 0.941(0.731, 1.213) | 1.318(1.083, 1.604) | 2.107(1.643, 2.699) | <0.001 | |
| Pressure | 1.459(0.954, 2.241) | 1.787(1.475, 2.163) | 2.101(1.701, 2.590) | 0.260 | |
| Wind speed | Sunshine duration | 0.800(0.587, 1.086) | 1.221(0.967, 1.537) | 1.772(1.270, 2.463) | 0.002 |
| Rainfall | 1.168(0.918, 1.481) | 1.178(0.933, 1.482) | 1.231(0.926, 1.631) | 0.958 | |
| Humidity | 1.162(0.860, 1.563) | 1.929(1.529, 2.423) | 2.766(2.017, 3.785) | <0.001 | |
| Temperature | 1.123(0.765, 1.639) | 2.290(1.816, 2.877) | 1.015(0.642, 1.598) | <0.001 | |
| Pressure | 1.047(0.745, 1.466) | 1.253(0.991, 1.577) | 1.437(0.989, 2.080) | 0.459 | |
| Pressure | Sunshine duration | 0.726(0.579, 0.907) | 1.007(0.862, 1.172) | 1.332(1.050, 1.685) | 0.001 |
| Rainfall | 0.949(0.805, 1.114) | 0.958(0.820, 1.114) | 1.007(0.813, 1.244) | 0.903 | |
| Humidity | 0.936(0.740, 1.181) | 1.646(1.410, 1.915) | 2.480(1.989, 3.084) | <0.001 | |
| Temperature | 0.798(0.552, 1.159) | 2.119(1.815, 2.464) | 0.967(0.704, 1.329) | <0.001 | |
| Wind speed | 0.635(0.524, 0.766) | 0.859(0.736, 0.999) | 1.258(0.995, 1.586) | <0.001 |
The interactive effects between humidity and other meteorological factors were greater in Guangzhou than the other three cities (table S8). For temperature and humidity, the heterogeneity statistics (Cochran's Q) were 19.132, 0.265, 1.741, and 2.118 for Guangzhou, Shantou, Meizhou, and Zhanjiang, respectively. GDP per capita was positively associated with the interactive effects between humidity and other meteorological factors including sunshine duration (P= 0.013), rainfall (P= 0.017), temperature (P= 0.021), win speed (P= 0.011), and pressure (P= 0.013) (tables 3 and S9). In addition, the number of per capita passenger traffic were also positively associated with the interactive effects between humidity and other meteorological factors including sunshine duration (P< 0.001), rainfall (P= 0.001), temperature (P= 0.002), wind speed (P< 0.001), and pressure (P< 0.001). Furthermore, we found increased per capital area of parks and green land was also associated with greater interactive effects between humidity and other meteorological factors including sunshine duration (P= 0.042), rainfall (P= 0.035), temperature (P= 0.031), wind speed (P= 0.045), and pressure (P= 0.042).
Table 3. The statistically significant city-specific factors on the difference in interactive effects among cities.
| First factor | Second factor | Sunshine duration | GDP | Rate of sewage treatment | Per capita area of parks and green land in city |
|---|---|---|---|---|---|
| Sunshine duration | Rainfall | 0.772 | 0.442 | 0.33 | 0.842 |
| Humidity | 0.225 | 0.013(+) | 0.612 | 0.042(+) | |
| Temperature | 0.071 | 0.613 | 0.014(−) | 0.265 | |
| Wind speed | 0.168 | 0.033(+) | 0.523 | 0.02(+) | |
| Pressure | 0.846 | 0.169 | 0.661 | 0.481 | |
| Rainfall | Sunshine duration | 0.247 | 0.008(+) | 0.646 | 0.053 |
| Humidity | 0.208 | 0.017(+) | 0.586 | 0.035(+) | |
| Temperature | 0.013(+) | 0.301 | 0.14 | 0.07 | |
| Wind speed | 0.109 | 0.071 | 0.42 | 0.006(+) | |
| Pressure | 0.945 | 0.304 | 0.471 | 0.671 | |
| Humidity | Sunshine duration | 0.246 | 0.008(+) | 0.644 | 0.052 |
| Rainfall | 0.754 | 0.458 | 0.316 | 0.86 | |
| Temperature | 0.022(+) | 0.431 | 0.067 | 0.143 | |
| Wind speed | 0.149 | 0.043(+) | 0.492 | 0.015(+) | |
| Pressure | 0.857 | 0.175 | 0.65 | 0.49 | |
| Temperature | Sunshine duration | 0.281 | 0.003(+) | 0.694 | 0.07 |
| Rainfall | 0.788 | 0.137 | 0.718 | 0.431 | |
| Humidity | 0.198 | 0.021(+) | 0.571 | 0.031(+) | |
| Wind speed | 0.202 | 0.019(+) | 0.577 | 0.033(+) | |
| Pressure | 0.452 | 0.765 | 0.115 | 0.807 | |
| Wind speed | Sunshine duration | 0.246 | 0.008(+) | 0.644 | 0.052 |
| Rainfall | 0.999 | 0.266 | 0.518 | 0.62 | |
| Humidity | 0.231 | 0.011(+) | 0.621 | 0.045(+) | |
| Temperature | 0.024(+) | 0.441 | 0.063 | 0.149 | |
| Pressure | 0.442 | 0.011(−) | 0.903 | 0.166 | |
| Pressure | Sunshine duration | 0.246 | 0.008(+) | 0.643 | 0.052 |
| Rainfall | 0.754 | 0.457 | 0.316 | 0.86 | |
| Humidity | 0.224 | 0.013(+) | 0.61 | 0.042(+) | |
| Temperature | 0.069 | 0.606 | 0.015(−) | 0.261 | |
| Wind speed | 0.164 | 0.035(+) | 0.516 | 0.019(+) |
All the numeric values in the table are P values. (+) and (−) indicate the positive and negative regression coefficients. GDP: per capita gross domestic product.
We found greater interactive effects of temperature with other meteorological factors in Shantou than the other three cities. For temperature and humidity, the Q statistics for the interaction between humidity and temperature were 24.876, 69.877, 31.785, and 24.217 for Guangzhou, Shantou, Meizhou, and Zhanjiang, respectively. The annual sunshine duration was positively associated with the interactive effects between temperature and other meteorological factors including rainfall (P = 0.013), humidity (P = 0.022), and wind speed (P = 0.024). While increased rate of sewage treatment was associated with greater interactive effects of temperature with other meteorological factors including sunshine duration (P = 0.014) and pressure (P = 0.015).
We also conducted multiple sensitivity analyses. First, to verify the reliability of the results of the inter-city heterogeneity analysis, we doubled the number of cities for sensitivity analysis. The results of the sensitivity analysis found that sunshine duration, GDP per capita, rate of sewage treatment, and per capita area of parks and green land in city were dominant predictors underlying the inter-city heterogeneity, which was consistent with the results of the main analysis (table S10). Second, we further used the multivariable linear regression instead of the KMR to explored the interactions between meteorological factors in Guangzhou. However, only 3 out of 15 interaction terms were statistically significant (table S11).
4. Discussion
We found that increased humidity may be associated with a greater effect of temperature, rainfall, pressure, wind speed, and sunshine duration on the risk of HFMD. For humidity and temperature, one of our previous studies reported a relatively high risk of HFMD when the temperature was greater than 24.85 °C and the relative humidity was above 80.59% (Du et al 2016). Similar results were also observed for other infectious diseases. For example, Liu et al reported an interaction between temperature and relative humidity on the risk of influenza in Shaoyang, China. The cold temperatures and lower humid conditions were associated with the increased risks (Liu et al 2019). The potential mechanisms underlying the interaction may be that humid conditions improve the viability and spread efficiency of the virus by providing suitable circumstances for transmission (Lowen and Palese 2009). Particularly, the humid environment was more suitable for the reproduction and spread of enteroviruses which is a major pathogen of HFMD.
We found that a moderate rather than low or high temperature strengthened the effect of humidity, rainfall, pressure, wind speed, and sunshine duration on the risk of HFMD. Although there were few studies on temperature modifying the effects of other meteorological factors, most studies on temperature and HFMD reported that moderate levels of temperature correspond to the highest risk. Consistent with the findings of many previous studies, the current findings and our previous studies have found an inverted V-shaped temperature-HFMD relationship (Du et al 2019a). Qi et al also found an inverted V-shaped relationship between temperature and HFMD (2018). There is a potential that at the peak of the inverted V-shaped relationship between temperature and HFMD, the median temperatures, which is the most suitable for outdoor activities, increased the infectivity of enterovirus (Averett 2016). These temperatures along with other meteorological conditions, such as humidity, increase the likelihood of contact between infected and susceptible people by increasing their social network (Du et al 2019b).
In addition to the humidity and temperature, we also found that increased wind speed could strengthen the effect of sunshine duration, rainfall, humidity, temperature, and pressure on the risk of HFMD. Without considering the interaction effects, Ma et al found that wind speed was positively associated with HFMD consultation rates (2010). Liao et al reported a positive correlation between HFMD incidence in children and wind speed (2015). The potential reason for an increase in HFMD with increased wind speed could be that wind can transport pollutants and water droplets containing these viruses, accelerating the propagation velocity of droplets, and therefore spreading the HFMD virus. This mechanism can also explain the role of wind speed in promoting the risk on HFMD associated with other meteorological factors.
We found that the cities with greater per capita GDP and area of parks and green land were suffering from greater interactive effects between humidity and other meteorological factors (e.g. temperature). Without assessing the relationship between meteorological factors, Gao et al (2021) and Li et al (2018) also found that GDP was positively associated with increased HFMD incidence. This association was potentially due to susceptible people in cities with a higher GDP having more access to resources (e.g. raincoats or umbrella) and likely had more options for outdoor spaces at different humidity levels. The per capital area of parks and green land may increase risk of transmission due to shared space among susceptible populations, and prior studies by our group found that the green space would increase the contact rate and increased the risk of HFMD (Du et al 2022).
Cities with higher annual hours of sunshine duration and lower rate of sewage treatment were found to have statistically significant interactive effects of temperature on other meteorological factors (e.g. humidity). Again, without considering the relationship between other meteorological factors, van Pham et al also found that the risk of HFMD increased with the increase in hours of sunshine (2019). The potential reason the number of hours of sunshine could impact HFMD is that susceptible people may enjoy more outdoor activities in days with favorable temperature and increased hours of sunshine. In regard to the rate of sewage treatment, Ji et al found the HFMD viral pathogens were highly prevalent in the raw sewage (86%) and treated wastewater (29%) (2012). Thus, the lower rate of sewage treatment would result in high background levels of environmental exposure, thereby increasing the risk of infection in susceptible populations.
While our study had many strengths, including the large sample size (a total of 468 weeks in 9 years) and the new insight for complex interactions between meteorological factors, there were also some limitations. First, as with other ecological studies, we cannot determine a causal relationship between meteorological factors and the risk of HFMD because the time series study is essentially an ecological design. Second, HFMD infections may have mild symptoms or be asymptomatic resulting self-management of health rather than seeking medical care. Although the cases reported to the surveillance system could be assumed to cover the almost entirely infections, underestimation is unavoidable. Third, the possible higher-order interactions were not analyzed in this study due to limitation of the existing methodologies. Future studies would be needed to clarify such higher-order interactions.
5. Conclusions
Our study contributed further understanding of complex interactions between meteorological factors on the risk of HFMD. It appears that good weather leads to higher infection rates of HFMD. This finding may be related to improved viability of the virus under these conditions as well as increased social interactions between infected and uninfected people leading to viral spread. Our findings provide epidemiological evidence for meteorological interactions on HFMD, which may guide health authorities to integrate various meteorological conditions to precisely identify high-risk days and thus make timely and effective preventive and control strategies.
Acknowledgments
This work was supported by the National Natural Science Foundation of China (Nos. 82103947 and 81973150) and the Natural Science Foundation of Guangdong, China (No. 2022A1515010823).
Data availability statement
The data generated and/or analysed during the current study are not publicly available for legal/ethical reasons but are available from the corresponding author on reasonable request.
Ethical statement
This study was approved by the Institutional Review Board at the School of Public Health, Sun Yat-sen University (Approval number: 2021-018). All patient information of HFMD surveillance data were collected from China Center for Disease Control and Prevention (China CDC). No confidential information was included and all methods were carried out in accordance with relevant guidelines and regulations. All data employed in this study were deidentified prior to analysis and anonymized confidentiality, thus informed consent was not required.
Conflict of interest
The authors declare no competing interests.
Supplementary data (3.8 MB DOCX)