

Abstract
A differentiated urban metabolism methodology is developed to quantify inequality and inform social equity in urban infrastructure strategies aimed at mitigating local in-boundary PM2.5 and co-beneficially reducing transboundary greenhouse gas (GHG) emissions. The method differentiates community-wide local PM2.5 and transboundary GHG emission contributions by households of different income strata, alongside commercial and industrial activities. Applied in three Indian cities (Delhi, Coimbatore, and Rajkot) through development of new data sets, method yields key insights that across all three cities, top-20% highest-income households dominated motorized transportation, electricity, and construction activities, while poorest-20% homes dominated biomass and kerosene use, resulting in the top-20% households contributing more than three times GHGs as the bottom-20% homes. Further, after including commercial and industrial users, top-20% households contributed as much or more in-boundary PM2.5 emissions than all commercial OR all industrial emitters (e.g. Delhi's top-20% homes contributed 21% of in-boundary PM2.5 similar to industries at 21%. These results enabled co-benefit analysis of various infrastructure transition strategies on the horizon, finding only three could yield both significant GHG and PM2.5 reductions (>2%-each): (a) Modest 10% efficiency improvements among top-20% households, industry and commercial sectors, requiring a focus on wealthiest homes; (b) Phasing out all biomass and kerosene use within cities (impacting poorest); (c) Replacing gas and diesel vehicles with renewable electric vehicles. The differentiated PM2.5 and GHG emissions data-informed social equity in the design of the three co-beneficial infrastructure transitions by: (a)-prioritizing free/subsidized clean cooking fuels to poorest homes; (b)-increasing electricity block rates and behavioral nudging for wealthiest homes; and, (c)-prioritizing electrification of mass transit and promoting electric two-wheelers ahead of providing subsidies for electric cars, where the free-rider phenomenon can occur, which benefits wealthiest homes. The methodology is broadly translatable to cities worldwide, while the policy insights are relevant to rapidly urbanizing Asia and Africa to advance clean, low-carbon urban infrastructure transitions.
Export citation and abstract BibTeX RIS
1. Introduction
Cities produce more than 80% of global gross domestic product [1] and are expected to house ∼66% of world population by 2050 [2, 3]. Seven key infrastructure provisioning systems provide energy, water, transportation, building materials (shelter), food, waste management, and green infrastructure and, enable the basic activities of both producers (industries and businesses) and consumers (households) co-located in cities [4, 5]. However, these provisioning systems contribute to >88% of global greenhouse gas (GHG) emissions [6], as well as indoor and outdoor air pollution resulting in >7 million premature deaths worldwide [7]. A majority of these deaths occur in urban areas and are predominantly (95%) attributed to PM2.5 (i.e. particulate matter smaller than 2.5 µm) pollution [7]. Indeed, the world's most polluted cities, based on PM2.5 concentration, are located in developing countries, with 22 of the 30 most polluted cities in India [8]. Furthermore, social inequality within cities is manifested in, as well as exacerbated by, inequality in access to and consumption of basic infrastructure provisioning systems [6]. For example, in Indian urban areas, 35% of households lack clean-burning cooking fuel (such as liquefied petroleum gas (LPG) or natural gas (NG)) and use more polluting fuels (firewood, cow-dung or kerosene); 38% of households do not have tap-water from a treated source; and 7% of households do not have electricity for lighting [9, 10]. Beyond deprivation, there are also high levels of inequality in consumption. In several Indian cities, the wealthiest populations consume manyfold the amount of electricity, and live in homes with more than six times the floor area compared with the poorest groups [11, 12].
Recent research has quantified how inequalities in household consumption contribute unequally to GHG emissions across income groups internationally, informing equitable decarbonization strategies and infrastructure transitions [13]. However, air pollution requires community-wide consideration of local industries and businesses, alongside households, in terms of their contribution to local pollution. At the same time, strategies to mitigate air pollution can also advance GHG mitigation. Therefore, the overall goal of this paper is to develop a systems approach evaluating infrastructure strategies for mitigating local PM2.5 emissions that offer GHG mitigation co-benefits, while also advancing social equity. The methodology is developed for Indian cities where PM2.5 air pollution is high and massive urban infrastructure development is underway [14–16]; the approach can generally be translatable to other global cities.
Previous studies of Indian cities have analyzed social inequality in infrastructure access within one or two sectors as they shape PM2.5 emissions, e.g. municipal solid waste (MSW) [17, 18] and access to clean cooking fuels [19, 20]. However, PM2.5 emissions within cities come from multiple infrastructure sectors, including transportation, construction, and commercial and industrial fuel use, including local power plants providing electricity, in addition to MSW and solid cooking fuel burning. City-scale air pollution inventories track PM2.5 emissions from these sectors and sources in urban areas [21, 22], but most inventories do not further disaggregate contributions by household socioeconomic status (SES) to address social inequality, nor compare disaggregated household emissions from different SES households with industrial and commercial users. Such disaggregation can help identify which household SES strata and users (e.g. residential, industrial, or commercial) should be prioritized in infrastructure policy for PM2.5 reductions, with potential for GHG co-benefits, thereby informing equitable clean, low-carbon infrastructure transitions in cities.
This paper develops such as socially-differentiated urban metabolism methodology drawing upon the terminology of differential metabolism previously applied to households in Cape Town, Africa [23]. Here we expand the method by comparing households by socioeconomic strata with industrial and commercial entities, assessing their differentiated contributions to urban material and energy flows and associated in-boundary PM2.5 emissions relevant to local pollution [21, 24, 25], and transboundary GHGs (local plus supply chain) [26]; relevant to global climate change, addressing multiple infrastructure provisioning systems in cities. Drawing upon key literature [27–29], we define social equity as addressing fairness in the apportionment of the burdens and benefits associated with specific policies, with the goal of reducing disparities for the most disadvantaged. In the context of clean, low-carbon infrastructure planning in cities, this means exploring inequality in access to clean infrastructure (e.g. poor households seeking clean cooking fuels), as well as inequalities in consumption (e.g. high consumption among the wealthiest households), both of which shape PM2.5 and GHG emissions. More equitable policy choices would then consider the fairness criterion by asking: Who are the most disadvantaged in society? Who is responsible for the majority of the pollution? How are burdens and benefits of a policy choice distributed relative to the above?
Overall, the paper asks what infrastructure policies can Indian cities employ to significantly reduce both local in-boundary PM2.5 emissions and transboundary GHG emissions and how can these policies be designed to advance social equity. To answer this question, the method involves two parts, each addressing the following questions:
- (a)Differentiated Urban Metabolic Accounting of infrastructure use activities, PM2.5 and GHG emissions: What is the relative contributions of business, industries and household of different SES strata to local PM2.5 emissions and trans-boundary community-wide GHG emissions, addressing multiple infrastructure sectors in cities?
- (b)Inequality Analysis to Inform Equity: How can information on differentiated contributions be coupled with quantitative analysis of emerging infrastructure policies to design equitable transitions?
We use a case study approach to develop the methodology, analyzing three Indian cities of varying population size, household income, and levels of basic infrastructure provisioning (e.g. clean cooking fuels, MSW. The methodology developed for three Indian cities is broadly applicable to cities worldwide, while the key insights may be particularly relevant to efforts toward equitable urban infrastructure transitions in Africa and Asia, with massive incipient urbanization, high levels of inequality and air pollution levels [14–16].
2. Methods
The overall methods for modeling inequality, PM2.5, and GHG emissions are described in figure 1 and detailed in the following sections.
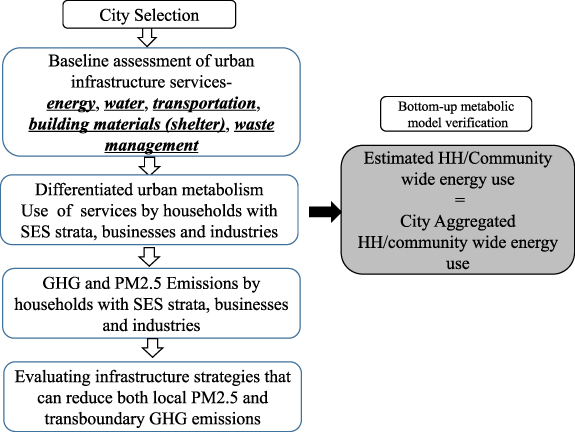
Figure 1. Methods for modeling inequality, PM2.5, and GHG emissions in cities.
Download figure:
Standard image High-resolution image2.1. Quantifying baseline infrastructure use inequalities in case study cities
Three case study cities, located in different geographies, are Delhi (National Capital Territory), Coimbatore (Tamil Nadu-State), and Rajkot (Gujarat-State). The cities varying by population sizes, employment, household income, expenditure, and levels of basic infrastructure services such as clean water and cooking fuels (table 1 and SI) and were selected for their diversity and availability of key infrastructure end-use data (e.g. residential, commercial, and industrial categories) (see SI and tables SI1–SI4).
Table 1. Aggregate socio-demographic, economic, employment, and infrastructure data for cities, including inequality in monthly per capita expenditure (MPCE) of households represented and employment data disaggregated by the sectors.
| Delhi | Coimbatore | Rajkot | |
|---|---|---|---|
| Household (Number of HH) | 3435 999 | 354 715 | 279 150 |
| Population (Number) | 16 787 941 | 1601 438 | 1286 678 |
| Population density (person km−2) | 11 297 | 9950 | 8172 |
| Total Number of Main Workers (2011) | 5309 803 | 612 759 | 435 218 |
| Cultivators (%) | 0.52% | 2.47% | 1.55% |
| Agricultural laborers (%) | 0.59% | 2.56% | 5.88% |
| Plantation, Livestock, Forestry (%) | 0.26% | 1.67% | 3.57% |
| Mining and Quarrying (%) | 0.01% | 0.16% | 0.13% |
| Manufacturing (%) | 17.73% | 33.05% | 27.85% |
| Electricity, Gas, Steam and Air conditioning Supply & Water Supply; (Sewerage, Waste Management, and remediation activities) (%) | 1.40% | 1.69% | 0.53% |
| Construction (%) | 6.60% | 10.01% | 10.44% |
| Wholesale and Retail Trade (Repair of motor vehicles and motorcycles) (%) | 21.65% | 18.59% | 14.10% |
| Transportation and Storage (%) | 7.79% | 6.59% | 5.75% |
| Accommodation and food service activities (%) | 1.92% | 0.99% | 2.11% |
| Information and Communication (%) | 2.43% | 0.85% | 3.00% |
| Financial and Insurance activities, Real Estate activities, Professional, Scientific and Technical activities (%) | 4.87% | 3.32% | 3.64% |
| Administrative and support service activities Public Administration and Defense, Compulsory Social Security (%) | 18.78% | 3.15% | 6.40% |
| Education Human Health and Social Work activities (%) | 7.18% | 4.60% | 6.15% |
| Arts, Entertainment and recreation & Other Service Activities& Activities of Households as Employers: Undifferentiated Goods and Services& Activities of Extra (%) | 8.26% | 10.27% | 8.89% |
| Household Access to Basic infrastructure | |||
| Tap water from treated source (% HH) | 75.2% | 95.8% | 86.9% |
| Electricity as Main Source of lighting (%HH) | 99.1% | 98.3% | 98.5% |
| LPG for Cooking (%HH) | 89.93% | 82.30% | 70.60% |
| Households with permanent structure (%HH) | 96.1% | 88.5% | 95.6% |
| Household Expenditure and Literacy | |||
| Average HH Monthly per Capita Expenditure (MPCE) (Rs.) | Rs.3676 | Rs.3856 | Rs.2853 |
| Literacy | 76% | 82% | 78% |
2.1.1. Representing inequality in household infrastructure provision and use
We assessed infrastructure demand (e.g. of energy or construction materials, and associated production of emissions) of different household segments using a novel bottom-up method integrating several household surveys. The Census of India [30] provided data on population, households, and employment, and deprivation in basic infrastructure access, e.g. the percentage of households lacking clean cooking fuels, permanent housing, clean water, sanitation, vehicle ownership, etc for each city (table 1). Data on household energy use, construction data, and vehicle/asset ownership data for different household segments were acquired from the National Sample Survey (NSS) of India [12] and Consumer Pyramid Survey [31], revealing inequality across five household population quintiles: bottom 20% (lowest expenditure group); 20%–40%; 40%–60%; 60%–80%; and top 20% (highest expenditure group) (table SI1). Because NSS did not report household income, we used expenditures as a proxy for income, an approach validated by high correlation between the two observed in Consumer Pyramid Survey. Data from the above sources enabled estimating the variation in consumption of several infrastructures uses (e.g. household cooking fuel use, electricity use, transportation fuel use) by SES strata (table 2–5). Details about other infrastructure sectors (i.e. construction and wastewater) were provided in the SI. The main contribution is the integration of social inequality, addressing both access and consumption, incorporating data from multiple sources.
Table 2. Average per capita electricity (kWh/capita) consumption estimated from NSS, (2014) for Delhi, Coimbatore, and Rajkot by wealth with a number of sampled households (N) with population by SES and electricity consumption.
| Households with SES | Delhi | Coimbatore | Rajkot | |||||||||
|---|---|---|---|---|---|---|---|---|---|---|---|---|
| Data from HH survey | Scaling up by population | Scaled up electricity use | Data from HH survey | Scaling up by population | Scaled up electricity use | Data from HH survey | Scaling up by population | Scaled up electricity use | ||||
| N | kWh/capita | Population | Million kWh | N | kWh/capita | Population | Million kWh | N | kWh/capita | Population | Million kWh | |
| Poorest Bottom 20% | 149 | 208 ± 10 | 3357 588 | 698 ± 34 | 24 | 182 ± 20 | 320 288 | 58 ± 6 | 17 | 160 ± 24 | 257 336 | 41 ± 6 |
| 20%–40% | 125 | 320 ± 14 | 3357 588 | 1074 ± 47 | 29 | 254 ± 18 | 320 288 | 81 ± 6 | 26 | 248 ± 15 | 257 336 | 64 ± 4 |
| 40%–60% | 158 | 451 ± 20 | 3357 588 | 1514 ± 67 | 47 | 436 ± 40 | 320 288 | 140 ± 13 | 37 | 310 ± 14 | 257 336 | 80 ± 4 |
| 60%–80% | 243 | 642 ± 22 | 3357 588 | 2156 ± 74 | 93 | 431 ± 23 | 320 288 | 138 ± 7 | 40 | 395 ± 20 | 257 336 | 102 ± 5 |
| Richest Top 20% HHs | 266 | 1244 ± 39 | 3357 588 | 4177 ± 131 | 123 | 776 ± 45 | 320 288 | 249 ± 14 | 40 | 574 ± 55 | 257 336 | 148 ± 14 |
| Total Sum | 941 | Average use for all HH 598 ± 16 | 16 787 940 | 9619 ± 353 | 316 | Average use for all HH 531 ± 23 | 1601 438 | 666 ± 47 | 160 | Average use for all HH 326 ± 13 | 1286 678 | 434 ± 33 |
| Residential total electricity utility reported by city | 10 396 | 574 | 434 | 443 | ||||||||
| Difference of reported utility and scaled up estimated electricity | 7% (Min 4%- Max 11%) | −16% (Min −24%- Max-8%) | 2% (Min −5%- Max 9%) | |||||||||
Table 3. Average per capita mixed cooking fuel consumption with primary (main) and secondary fuel categories for Delhi, Coimbatore, and Rajkot with the different population segment.
| Main fuel users HH (%) | HH SES (%) | No of sample | Per capita/year fuel use | |||||
|---|---|---|---|---|---|---|---|---|
| LPG (kg) | Kerosene (l) | Coal (kg) | Firewood (kg) | Dung cake (kg) | ||||
| Delhi | Mainly LPG user (90% of HH) | Bottom 20% | 124 | 24.8 ± 0.5 | 0.8 ± 0 | 0 | 3.2 ± 0.1 | 3.2 ± 1.3 |
| 20%–40% | 111 | 30.4 ± 0.6 | 0.6 ± 0 | 0 | 2.4 ± 0.7 | 0 | ||
| 40%–60% | 124 | 33.8 ± 0.7 | 0 | 0 | 0 | 0 | ||
| 60%–80% | 190 | 37 ± 0.7 | 0 | 0 | 0 | 0 | ||
| Top 20% | 204 | 41.3 ± 0.8 | 0 | 0 | 0 | 0 | ||
| Average | 753 | 33.7 ± 7 | 0.4 ± 0 | 0 | 1.3 ± 0.3 | 0.2 ± 0.3 | ||
| Mainly Kerosene user (5.3% of HH) | 29 | 0 | 41.9 ± 32.8 | 0 | 0 | 0 | ||
| Mainly Firewood (3.4% of HH) | 35 | 2.3 ± 0.4 | 3 ± 0.5 | 0 | 153.8 ± 8.5 | 21 ± 3.7 | ||
| Mainly Cow Dung (0.5% of HH) | 8 | 1.8 ± 0.6 | 2.4 ± 0.4 | 0 | 59.9 ± 7.2 | 231.2 ± 13.4 | ||
| Mainly coal (0.1% of HH) | 10 | 0 | 0 | 44.3 ± 40 | 0 | 0 | ||
| Coimbatore | Mainly LPG user (82% of HH) | Bottom 20% | 16 | 20.3 ± 2.1 | 4 ± 0.2 | 0 | 37.3 ± 6.6 | 0 |
| 20%–40% | 23 | 32.6 ± 2.6 | 2.5 ± 0.2 | 0 | 37.3 ± 16.7 | 0 | ||
| 40%–60% | 40 | 36.1 ± 3 | 3 ± 0.2 | 0 | 0 | 0 | ||
| 60%–80% | 83 | 34.8 ± 2.6 | 0 | 0 | 0 | 0 | ||
| Top 20% | 101 | 41.4 ± 3.1 | 0 | 0 | 0 | 0 | ||
| Average | 263 | 35.8 ± 2.9 | 2 ± 0.2 | 0 | 0 | 0 | ||
| Mainly Kerosene user (14% of HH) | 12 | 0.0 | 42.4 ± 14 | 0 | 14.5 ± 0 | 0 | ||
| Mainly Firewood (3% of HH) | 16 | 0.0 | 11.5 ± 0.2 | 0 | 472 ± 5 | 0 | ||
| Mainly Cow Dung (0.1% of HH) | 14 | 0.0 | 4 ± 0.1 | 0 | 192 ± 1 | 123 ± 1 | ||
| Rajkot | Mainly LPG user (71% of HH) | Bottom 20% | 12 | 19.8 ± 2.2 | 3.9 ± 1.6 | 0 | 7.1 | 0 |
| 20%–40% | 19 | 26.9 ± 1.7 | 0 | 0 | 7.1 | 0 | ||
| 40%–60% | 28 | 25.4 ± 2.1 | 0 | 0 | 4.6 | 0 | ||
| 60%–80% | 34 | 30.5 ± 2 | 0 | 0 | 0 | 0 | ||
| Top 20% | 35 | 35.7 ± 4.5 | 0 | 0 | 0 | 0 | ||
| Average | 128 | 28.3 ± 1.2 | 1.2 ± 0.4 | 0 | 0 | 00 | ||
| Mainly Kerosene user (18% of HH) | 13 | 0.0 | 30.7 ± 3.4 | 0 | 33.6 ± 17 | 9.7 | ||
| Mainly Firewood (8% of HH) | 8 | 0.0 | 12.2 ± 1.8 | 0 | 226.8 ± 17.2 | 28.6 ± 0.7 | ||
| Mainly Cow Dung (2% of HH) | 8 | 0.0 | 11.4 ± 2.1 | 0 | 29.2 ± 14.8 | 218.4 ± 29.7 | ||
Table 4. Per capita expenditure for petrol & diesel and public transport use in all three cities (Source: NSS, (2014)).
| Delhi | Coimbatore | Rajkot | |
|---|---|---|---|
| Per Capita Petrol & Diesel Expenditure (Rs./Month) | |||
| Bottom 20% (Low SES) | 74 ± 5 | 66 ± 15 | 57 ± 6 |
| 21%–40% (Low Mid SES) | 121 ± 7 | 143 ± 21 | 69 ± 4 |
| 41%–60% (Mid SES) | 172 ± 8 | 139 ± 14 | 129 ± 8 |
| 61%–80% (Mid SES) | 248 ± 9 | 219 ± 16 | 132 ± 11 |
| Top 20% (High SES) | 642 ± 30 | 602 ± 79 | 282 ± 40 |
| Per Capita taxi, auto-rickshaw fare (Rs./Month) | |||
| Bottom 20% (Low SES) | 13 ± 1 | 0 | 14 ± 2 |
| 21%–40% (Low Mid SES) | 25 ± 2 | 33 ± 26 | 17 ± 2 |
| 41%–60% (Mid SES) | 31 ± 3 | 33 ± 26 | 19 ± 2 |
| 61%–80% (Mid SES) | 59 ± 6 | 44 ± 16 | 26 ± 3 |
| Top 20% (High SES) | 104 ± 11 | 438 ± 121 | 49 ± 10 |
| Per Capita bus/tram fare (Rs./Month) | |||
| Bottom 20% (Low SES) | 39 ± 3 | 45 ± 8 | 17 ± 2 |
| 21%–40% (Low Mid SES) | 66 ± 4 | 69 ± 8 | 29 ± 3 |
| 41%–60% (Mid SES) | 85 ± 5 | 104 ± 14 | 43 ± 6 |
| 61%–80% (Mid SES) | 118 ± 6 | 96 ± 11 | 54 ± 7 |
| Top 20% (High SES) | 172 ± 11 | 172 ± 22 | 132 ± 23 |
Table 5. Estimated number of new buildings constructed and average floor areas for Delhi, Coimbatore, and Rajkot (annual average 2001–2011 from Census of India, 2011).
| Delhi | Coimbatore | Rajkot | |
|---|---|---|---|
| Bottom 20% (Number) | 6769 | 923 | 786 |
| 20%–40% (Number) | 8714 | 1188 | 1012 |
| 40%–60% (Number) | 9936 | 1355 | 1154 |
| 60%–80% (Number) | 12 015 | 1639 | 1395 |
| Top 20%(Number) | 53 565 | 7306 | 6220 |
| Average per HH floor area (m2/HH) | 43 | 37 | 51 |
| New Non-Residential Buildings (Numbers & Floor Area) | |||
| Education Institutes (Number) | 232 | 13 | 12 |
| Average Floor Area (Covered Area) | |||
| Primary School (m2/School) | 910 | 1596 | 2945 |
| Middle School (m2/School) | 479 | 722 | 1809 |
| High/Higher Secondary School (m2/School) | 607 | 456 | 1156 |
| Hotel/Lodge (Number) | 196 | 8 | 28 |
| Average Floor Area m2/Room | 10.5 | 10.5 | 10.5 |
| Hospital/ Dispensary (Number) | 19 | 45 | 37 |
| Average Floor Area m2/Bed | 6 | 6 | 6 |
| Factory, Work- shop (Number) | 1140 | 66 | 706 |
| Average Floor Area (m2/Room) | 21 | 21 | 21 |
| Place of worship (Number) | 43 | 19 | 33 |
| Average Floor Area (m2/Room) | 21 | 21 | 21 |
| Other non- residential (Number) | 15 479 | 625 | 576 |
| Average Floor Area (m2/Room) | 27 | 27 | 27 |
a NSS, (2008). b NCERT, (2005). c Government of Delhi, (2011).
2.1.2. Community-wide multi-sector data, incorporating households, commercial and industrial activities
Commercial and industry electricity and other fossil fuel use was estimated via a bottom-up methodology based on energy use intensity per employee extracted from the Annual Survey of Industry and scaled by the number of employees in each industrial sector, reported at the urban district level in the Census of India [30]. Community-wide water and wastewater data for the three cities are from [32] and [33]. Registered vehicle counts of all commercial and industrial vehicles for Delhi are from Statistical Abstract of Delhi [34], and from open government data for Rajkot and Coimbatore [35] (figure SI2). Vehicle kilometers traveled (VKT), and age of vehicles are acquired from the literature [36, 37] and a primary survey by our research collaborators (tables SI4 and SI5). Differentiated urban metabolic data, which present energy and material use by household income strata, along with commercial and industrial sectors, are shown in tables 2–5 for electricity, cooking fuels, transportation, non-transportation fuel use, and construction area. Details on construction and waste sectors are provided in the SI.
2.1.3. Bottom-up metabolic model verification
We conducted several comparisons to affirm that the bottom-up socially differentiated urban metabolism methodology developed in this paper is consistent with overall physical flows of electricity and fuels in cities, as well as estimates of local PM2.5 emissions.
First, we assessed differences between total residential electricity use computed using bottom-up household survey data with total residential electricity use reported independently by electric utilities, finding reasonable agreement across the three cities (−16%–7%) (table SI3), particularly given that electricity line losses in India can be as high as 20% [38]. When comparing community-wide electricity, LPG, and kerosene used (households, industry, and commercial) reported in Delhi's statistical summary, the differences were likewise relatively small (14%–18%) (table 6). Furthermore, a recent paper applying the same method to all 640 districts of India conducted multi-level uncertainty analysis and found the bottom-up method of scaling up household survey data and employee numbers provided reasonable estimates of district-level energy use that aligned well, within 2% of national totals [39].
Table 6. Comparing bottom-up metabolic data estimated for Delhi from surveys (differentiated urban metabolism approach from this paper: see table 1) with at-scale data from other sources. Part a: energy use data for residential, commercial, and industrial users for Delhi from HH survey with at-scale data provided by electric utilities and statistical abstract.
| Data | HH | Industry | Commercial | Total | |
|---|---|---|---|---|---|
| Electricity | Consumption reported by city utility report (million kWh) | 10 396 | 2989 | 6253 | 19 638 |
| Estimated in current study by bottom-up methodology (million kWh) | 9619 | 3500 | 3787 | 16 906 | |
| Difference (%) | 10% | −17% | 39% | 14% | |
| LPG | Consumption reported by city utility report (Gg) | NA | NA | NA | 731 |
| Estimated in current study by bottom-up methodology (Gg) | 499 | 32 | 71 | 602 | |
| Difference (%) | NA | NA | NA | 18% | |
| Kerosene | Consumption reported by city utility report (million liters) | NA | NA | NA | 48 |
| Estimated in current study by bottom-up methodology (million liters) | 41 | NA | NA | 41 | |
| Difference (%) | NA | NA | NA | 17% |
City utility data sources: SAD, (2014), Bottom-up method data sources: IND-CSO-ASI-2012-13, (2012), Census of India, (2011), NSS, (2014), NSS, (2013).
Second, we quantified uncertainty in estimating household energy use by income quintiles due to survey sample sizes (see table 2), and found overall uncertainty for total residential electricity use to be small (e.g. 7% in Delhi; 2% in Rajkot), while survey uncertainty can be larger within the lowest income groups in some cities, e.g. Coimbatore, when survey samples are low (see bottom row of table 2). Third, we compared in-boundary PM2.5 emissions from our study with another study in Delhi [40], finding a small difference within 2%–4%, although data sources were different in two studies (table SI6). Taken together, these comparisons suggest that the differentiated urban metabolism methodology developed in this paper are consistent with the overall physical flows of electricity and fuels, as well as estimates of PM2.5 emissions, supporting its use for informing social equity in co-beneficial mitigation strategies.
2.2. Socially-differentiated metabolic modeling of PM2.5 and GHG emissions
To assess baseline GHG emissions associated with multiple infrastructure provisioning systems in a city, we applied a transboundary community-wide infrastructure-based carbon footprinting (Scope 1 + 2 + 3) approach, identified in a recent consensus article to be well-suited to inform community-wide zero-carbon urban infrastructure transitions [41]. Urban infrastructure provisioning systems included in this paper are energy supply, transportation, water, sanitation, MSW, and building construction materials (dominated by cement). The community-wide infrastructure-footprinting approach is consistent with advanced GHG protocols developed by practitioners [26, 42] and researchers [41, 43–45]. The method accounts for emissions arising from the use of a sector (e.g. energy use, mobility, building construction etc), and tracing lifecycle emissions across the use phase (e.g. using cooking fuels, driving a car, using electricity, constructing a home) to upstream/supply chain production of electricity, petrol fuels, construction materials at power plants, refineries, and cement factories, respectively, and further extraction of fuels/minerals from mining operations [42, 46, 47]. Aligning with the scope concept, emissions from in-boundary emission sources are called Scope 1. Scope 2 includes GHGs embodied in imported grid-supplied electricity, heat, steam, and/or cooling. Scope 3 includes transboundary lifecycle GHGs embodied in other upstream infrastructure supply chains serving cities. In this paper, we limit upstream Scope 3 GHGs to powerplants, cement factories, and oil refineries which substantially dominate life-cycle energy use and GHG emissions of producing electricity cement and petrol fuels [48]; further upstream accounting of GHGs was limited by data unavailability in India.
Equation (1) shows the computation of the transboundary infrastructure GHG emission footprints ( ) differentiated by different users within cities k, including by different household segments and residential and commercial, as well as infrastructure sectors i.
where MEFA use represents direct community-wide material, energy flow, and use of various infrastructure i (such as VKT, water/wastewater, MSW generation, and burning) by user category k (tables 1–5). GHG emission factors are represented for in-boundary use activities,  (e.g. fossil fuel combustion), as well as
  representing production of infrastructure services that may be produced inside or outside the city boundary. This methodology is standard and reported in several practitioners and research papers [43, 44, 46].
India-specific IPCC emission factors were used (tables SI7–SI11), except for biomass burning, which is assumed by the IPCC to have no net CO2 emissions (carbon neutral). Following recent debates on the literature [49] and European Union guidance on wood-burning [50] given (un)sustainable regrowth of harvested biomass, we applied a factor of 25% to CO2 emissions from wood-burning based on India data on the carbon content of firewood (table SI7) [51], with ∼75% assumed to be regrown [52].
To address co-beneficial local PM2.5 reduction, we quantify local PM2.5 emissions arising from the same community-wide infrastructure use activities in the GHG footprinting approach. Since PM2.5 pollution in cities is typically dominated by local/proximal sources [53, 54], we focused on in-boundary (Scope 1) PM2.5 emission sources using a well-established city-level emission inventory approach used in India [55] and by the US-EPA [56]. This PM2.5 inventory approach was appropriate to answer our question on local PM2.5 emission reduction and in- and trans-boundary GHG mitigation co-benefits from city-scale infrastructure strategies of interest to cities. Using similar notation as in equation (1) for sectors i and users k, in-Boundary PM2.5 emissions (IBE) were computed as:
where EF now represents the PM2.5 emission factors for activities and fuel consumption for the different infrastructure sector. In cases of unavailability of local emissions factors, data from other South Asian countries [26, 44–48, 53, 54] were used and are available in SI (tables SI7–SI11).
2.3. Evaluating in-boundary PM2.5 and transboundary GHG mitigation co-benefits of urban infrastructure policies
Based upon baseline emissions computed in equations (1) and (2), we conducted a what-if analysis of 11 city-level policies that have potential for PM2.5 and GHG reduction (table 7), covering interventions in transportation, household energy use, industrial energy use, construction, and MSW sectors. The first ten policy strategies are derived from the Indian government's policy proposals detailed in the SI. In addition, we proposed one policy strategy (Policy 11) based on the results of the differentiated metabolism data developed in this paper.
Table 7. Achievable air pollution mitigation strategies and Indian policy landscape for different sectors.
| Policy Strategies | Policy Documents and associated action targets proposed in India [Document and associated policy-making body) | How Implemented in the Scenarios | |
|---|---|---|---|
| Transportation | Policy 1: Replacing diesel cars with petrol cars | National Green Tribunal handles the environmental issues and provides direction and environmental laws in India has directed in its order M.A. No. 1369 of 2017 that diesel vehicles more than ten years old should not be permitted on the road (NGT, 2017) | Instead of phasing out more than ten years old diesel cars, we proposed a what-if scenario of replacing all on-road diesel cars with new petrol cars |
| Policy 2: Converting diesel-operated buses to CNG | Government of India Policy Commission-National Institution for Transforming India (NITI Aayog), has recommended use of CNG in commercial buses for intra-city travel (NITI Aayog, 2018a) | We proposed a what-if scenario of replacing on-road diesel-operated intra-city buses with CNG buses in all three cities | |
| Policy 3: Promote shared transportation services | NITI Ayog recommended a target of shifting 10% of personal vehicle travel to CNG buses for intra-city travel (NITI Aayog, 2018a)) | We followed NITI Ayog recommendations for all three cities and replaced 10% of private travel with public transit | |
| Policy 4: Encourage electric vehicle adoption | Target of shifting 30% of cars, 60% of 2-wheelers, and 100% of 3-wheelers to renewable electric vehicles(FICCI, 2017). | Based on the potential of electric mobility present in report" Enabling the Transition to Electric Mobility In India" by FICCI we assumed the target shifting to electric vehicles in all three cities | |
| Polluting Fuels | Policy 5: Eliminate dirty fuel use | Replacing in-boundary firewood, charcoal, biomass & kerosene use by all users with clean fuels* (LPG for households, natural gas for industrial coal) (Center for Study of Science, 2015)(NCAP, 2018; Prime Minister Ujjwala Yojna, 2018) | Under Prime Minister Ujjwala Yojna, the government of India has targeted zero polluting fuel policy for household cooking and National Clean Air Program (NCAP) has recommended clean fuels for all sectors |
| Municipal Solid Waste | Policy 6: Eliminate MSW burning | Under the clean India mission government of India has targeted 100% MSW collection in Indian cities also Implement an Integrated Waste Management Policy (NITI Aayog, 2018b) targeted of no in-boundary MSW burning (Government of India, 2018) | We followed both recommendations and proposed what-if scenario of no MSW burning in three cities |
| Diesel Generator Set | Policy 7: Shifting from diesel generators to renewable power | Push rooftop solar and distributed generation with an emphasis on improved power reliability in urban areas to eliminate the operation of DG sets (NITI Aayog, 2018b) | Government India is promoting the use of renewable energy for sectors currently contributing to air pollution and GHG emissions. Following the recommendations, we proposed what-if scenarios for implementing these policies |
| Power Plant | Policy 8: Rooftop solar and distributed generation | Replacing 10% in-boundary thermal power energy to renewable energy for Delhi (NITI Aayog, 2018b) | |
| Industries | Policy 9: Energy conservation in industry | 10%–25% reduction in specific energy consumption by 2030 (Center for Study of Science, 2015) | We have considered the potential energy efficiency improvements suggested by a study. |
| Construction | Policy 10: Halve PM emissions from construction sector | NITI Ayog and the Government of Delhi directed builders to use appropriate protection measures in construction sites to ensure that their activity does not cause any air pollution (Gov of Delhi, 2014; NITI Aayog, 2018b). | Following the recommendation of NITI Ayog and Gov. of Delhi, we proposed a 50% reduction in emissions under what if scenario |
| HH, commercial and Industries | Policy 11: Targeted efficiency among high SES households and commercial and industrial users | Target of 10% efficiency improvement in top 20% of wealthy households and all commercial and industrial users (Proposed by study authors) | |
The impact of these policies on PM2.5 and GHG reduction was quantified either by directly applying a reduction rate to the relevant flows or emission factors, with respect to baseline emissions, or implementing a fuel-switching model.
For modeling fuel-switching of cooking fuels in Policy 5, we computed equivalent energy 'delivered to the pot,' using stove efficiency and calorific value of fuels compiled by the EPA based on India-specific efficiencies [57], comparing LPG as a substitute for kerosene or biomass fuels including firewood and dung cake. Using firewood as an example, the amount of LPG ( ) needed to substitute for the amount of firewood use in the baseline (
 ) can be calculated as:
 is the calorific value of firewood and
  is the calorifc value.
  is the wood stove efficiency and
  is LPG stove efficiency. Table SI7 provides India-specific wood and stove parameters used in equation (3), derived from [51].
Results from the quantitative analyses were then used to inform equitable design of infrastructure policies and solutions.
3. Results
3.1. Household inequality in infrastructure use, and in-boundary PM2.5 emissions
Figure 2 demonstrates multiple infrastructure service provisioning by household income and figure 3 presents the differentiated local PM2.5 emission contributions by household income levels. The top 20% households (with highest income) have disproportionately large impacts on in-boundary PM2.5 emissions from transportation in Delhi and Coimbatore (50%–60% of total in-boundary household transportation emissions) relative to contributions from other income strata (figure 3). In contrast, PM2.5 from cooking fuel used by the 20% lowest-income households is the largest in all three cities, ranging from 96%–99% of total cooking fuel-related PM2.5 emissions in the residential sector. For total in-boundary PM2.5 emissions from all infrastructure uses by households (figure 3), the top 20% (highest-income) and the bottom 20% (lowest-income) households by income make the following contributions to PM2.5 emissions in the different cities: 42% (top-20%) vs. 14% (bottom-20%) in Delhi; 47% (top-20%) vs. 21% (bottom-20%) in Coimbatore largely due to more use of personal vehicles by high-income homes; while the trend is switched in Rajkot as 32% (top-20%) vs. 41% (bottom-20%) due to the prevalence of polluting cooking fuels in poorer homes, (figures 2 and 3).

Figure 2. Household ownership/usage of provisioning systems separated into 5 socioeconomic strata from poorest 20% to wealthiest 20% households in Delhi, Coimbatore, and Rajkot.
Download figure:
Standard image High-resolution image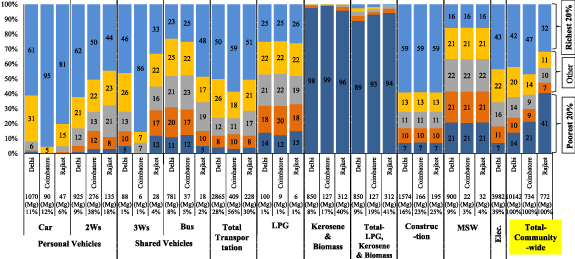
Figure 3. Household in-boundary PM2.5 emission share separated into 5 socioeconomic strata from 20% poorest to 20% wealthiest household in Delhi, Coimbatore, and Rajkot.
Download figure:
Standard image High-resolution imageThese results indicate that the largest contributors to in-boundary PM2.5 vary by city types. As income, wealth and infrastructure improve, often with city size, largest contributors to local PM2.5 transition from polluting cooking fuels to motorized transport. Our model results, derived for the first time from bottom-up data, yield results similar to overall city trends represented by others, e.g. [58].
3.2. Community-wide in-boundary PM2.5 emissions from households, commercial and industrial users
When evaluating the share of PM2.5 emissions from households along with commercial and industrial users (figure 4), it is striking to observe that total in-boundary PM2.5 emissions from the top 20% households (highest-income) can be equivalent or greater than total emissions from either all industrial users or all commercial users. For example, in Delhi, 21% of total PM2.5 emissions are from the top 20% households, similar to all industrial activity (also contributing 21%), with these numbers being 28% in Coimbatore. In Rajkot, the top 20% of households contribute 18% of all emissions, comparing to 28%–36% from industry users and 8%–12% from commercial users.

Figure 4. Community-wide in-boundary PM2.5 emission share, including commercial, industrial and residential users separated into 5 socioeconomic strata from 20% poorest to 20% wealthiest households in Delhi, Coimbatore, and Rajkot.
Download figure:
Standard image High-resolution image3.3. Community-wide transboundary GHG emissions from households, commercial and industrial sectors
Our GHG results also show that the contribution to total trans-boundary emissions from top 20% households (highest income) is equivalent to or greater than the contribution from either industrial users or commercial sector (figure 5). For example, in Delhi, 25% of the total GHG emissions are contributed by the top 20% households, whereas the commercial and industrial sectors only contribute 24% and 19%, respectively. In Coimbatore, top 20% households contribute 25% of GHG emissions, while 40% of GHG emissions are from industrial users and 13% from the commercial sector.
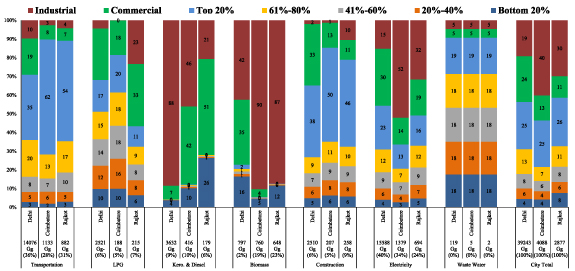
Figure 5. Communitywide infrastructure supply chain (scope 1 + 2 + 3) GHG footprints share among commercial, industrial, and residential users (separated into 5 socioeconomic strata from 20% poorest to 20% wealthiest households) in Delhi, Coimbatore, and Rajkot.
Download figure:
Standard image High-resolution image3.4. In-boundary PM2.5 and trans-boundary GHG reduction co-benefits of different policies
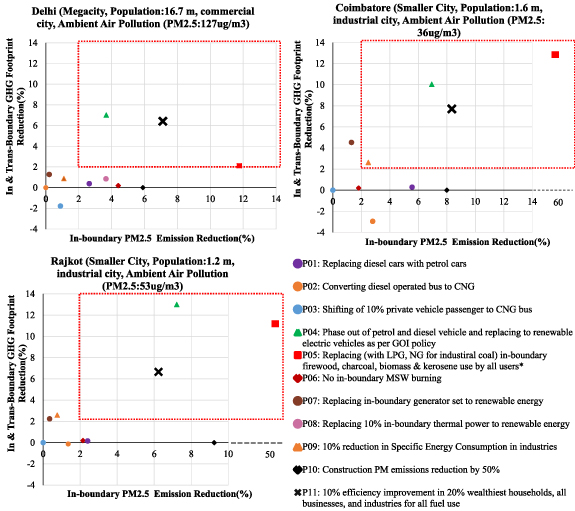
Out of the eleven strategies evaluated (table 7), only three (Policies 4, 5 & 11) yielded a significant reduction (>2%) of both GHG and PM2.5 emissions in all three cities, meaning they have potential for GHG and PM2.5 mitigation co-benefits (figure 6).
- (a)Modest 10% efficiency improvements among the wealthiest 20% households as well as among industry and commercial sectors (Policy 11 in table 7), reduce 7.1%, 8.4%, 6.2% in-boundary PM2.5 emissions, and 6.4%, 7.6%, 6.7% GHG footprints in Delhi, Coimbatore, and Rajkot, respectively. Given that the highest-income households contributed a large proportion of community-wide PM2.5 and GHG emissions, focusing on energy efficiency and conservation among these households is important to achieve co-benefits. Equitable policy designs would address whether the highest-income households, who contribute the most to pollution, should receive incentives for energy conservation (inequitable) or if higher energy rates for higher energy users would be more equitable. In the latter scenario, the additional revenue generated can be earmarked to support low-income households, particularly those who are too poor to afford clean cooking fuels like LPG (discussed next). Furthermore, behavioral nudging using non-price incentives such as social norms [59, 60] can be more suitable to promote efficiency and conservation behaviors among wealthy households.
- (b)Phasing out all biomass and kerosene use within cities from all users (households, commercial and industrial sectors) through fuel substitution to LPG (Policy 5 in table 7) _, reduces 11.8%, 58.4%, and 50.3% in-boundary PM2.5, and, 2.1%, 12.9%, and 11.5% GHG footprint in Delhi, Coimbatore, and Rajkot, respectively. This strategy would impact the poorest homes (figure 2), which already deal with a lack of infrastructure services. Subsidized or free access to clean cooking fuels to low-medium income households would be an important equity consideration for this policy; likewise, banning the use of firewood in industry must also consider that many industries, particularly those using firewood, such as food preparation, may disproportionately impact poorer workers. This policy is also expected to yield substantial health risk mitigation benefits for the impacted population [20, 57, 61] largely concentrated among the poorest households.
- (c)Replacing all gas and diesel vehicles with renewable electric vehicles, is a highly ambitious future target, estimated to reduce 7.0%, 10.0%, and 13.0% of PM2.5 emissions and, 3.7%, 6.9%, and 7.2% of GHG footprints in Delhi, Coimbatore, and Rajkot, respectively. This strategy is expected to largely benefit the top 40% of households (figure 2). Shifting to electric vehicles is expected to already provide cost savings [62]; thus, market forces may suffice to enable this transition. Offering rebates for electric vehicles may create free ridership concerns while offering such rebates to high-income households owning cars can exacerbate inequities. More importantly, equity in electric charging infrastructure should be considered, prioritizing charging infrastructure for electric vehicles in middle-income groups using two-wheeler vehicles over electric car charging.
Figure 6. Different in-boundary PM 2.5 (air pollution) reduction policy options with corresponding GHG co-benefits (life-cycle based with scope 1 + 2 + 3 boundaries) in (A) Delhi, (B) Coimbatore, and (C) Rajkot.
Download figure:
Standard image High-resolution image
Last, looking across policies addressing high levels of energy consumption by wealthy households, along with subsidies to promote LPG use among the poorest households, can be complementary. Together, they can advance equity and reduce both PM2.5 and GHG emissions from Indian cities.
4. Discussion
This paper has developed the first multi-sectoral, multi-user, socially differentiated urban metabolism methodology for delineation of local PM2.5 emissions and transboundary GHG emissions using publicly available data for three Indian cities. The general consistency between disaggregated bottom-up energy-use data estimated from surveys with the utility-provided energy flow estimates gathered for our three Indian cities indicates coherence across diverse data sources in India. Quantifying trans-boundary GHG and in-boundary PM2.5 emissions from industrial and commercial users and homes of different income quintiles enabled PM2.5-GHG co-benefit analysis of future infrastructure policies while also informing more equitable design of these strategies. The differentiated urban metabolism method developed and demonstrated for three Indian cities, can broadly be translated to other cities in India and worldwide. The method is particularly relevant to developing cities in Asia and Africa grappling with the highest levels of income inequality [14–16, 63] as well as air pollution [64]. The methodology also advances literature in political industrial ecology [65–67], i.e. recognizing social and policy impacts on urban material-energy flows. It also broadens the current discourse on urban social inequality in the context of GHG emissions [13, 68], by also addressing inequality in contributing to local PM2.5 emissions.
Co-benefit analysis of 11 infrastructure policies in the three Indian cities, found only three offered both GHG and PM2.5 reductions larger than 2%. These include: (a) Future-oriented electrification of vehicles; (b) Achieving zero biomass and kerosene fuel use through fuel switching in cities; and (c) Achieving a 10% reduction in energy use among the wealthiest households and among industry users. For all three co-beneficial strategies, the socially differential PM2.5 inventory and GHG footprints help inform equity in implementing these policies. Specifically, applying higher block rates or a pollution premium for high levels of consumption by high-income homes can be used to support subsidies for clean fuel use by low-income homes. Furthermore, vehicle electrification programs and subsidies must prioritize mass transit and two-wheeler vehicles ahead of privately owned cars. These general policy guidelines toward equitable, clean, low-carbon infrastructure may also be broadly translatable to other developing world cities. However, we note that city-specific data can also offer new insights—e.g. in industrial cities like Coimbatore, improving industrial energy efficiency can offer high co-benefits.
In addition to the above strategies, several additional policies can yield high PM2.5 reductions, although lower GHG mitigation. Given the serious issue of air pollution in Indian and world cities, these strategies, including the reduction of construction emissions and eliminating MSW burning, can be valuable for addressing air pollution, albeit with little GHG co-benefits. Furthermore, the inclusion of additional construction materials (beyond cement), such as brick and steel, in the Communitywide footprints may also reveal additional co-beneficial strategies, particularly in India, with high pollution from informal brick kilns surrounding urban areas.
Overall, the differentiated urban metabolism approach demonstrated in this paper provides a systematic and quantitative approach for assessing the intersection of climate action, local air pollution, infrastructure, and equity, of interest to local and global sustainable development communities.
Acknowledgments
This research work has been supported by the US National Science Foundation through a Partnership for International Research and Education (PIRE) Grant #1243535 and SRN Grant #1444745. We thank Emani Kumar, Ashish Rao-Ghorpade, Nagendran Nagarajan, Krishnan Sella, and Vandit Patel from ICLEI South Asia, India, Daqian Jiang, and Samuel Tabory from the University of Minnesota for their valuable assistance during data collection and writing.
Data availability statement
The data that support the findings of this study are available upon reasonable request from the authors.
Supplementary data (0.2 MB DOCX)