

Abstract
This study explores the consequences of independent and combined effects of blockings on the northeast Asian cold vortex (NACV), and corresponding cold outbreaks over East Asia (EA) during boreal winters of 1979–2019. The results show that the development of NACV is closely associated with blocking over the Ural Mountains (UB) upstream and eastern Siberia to mid-North Pacific (SPB) downstream. Here we focus on the initial periods before the peak day of NACV events. It is found that the strong NACV events are usually induced by the initial-UB situation, leading to the greatest temperature drop in EA. While the weak NACV events may be associated with the initial-SPB condition, which can bring less dramatic outbreaks but longer duration, owing to the Ural ridge that formed by the westward shift of SPB. Furthermore, an SPB-UB relay effect is discovered against the background of a negative Arctic Oscillation pattern. In such cases, UB is formed by the westward shift of downstream SPB after the occurrence of NACV, forming a relay effect that motivates the second NACV process, hence prolonging the duration of cold anomalies in EA. These findings highlight the importance of the combined effect of blockings and NACV in the intraseasonal time scale. Compared to the 'Initial-UB' and 'Initial-SPB' situation, this 'SPB-UB relay' scenario can produce longer-lasting cold extreme in EA, which may be indicative of the short-term weather forecasting of such extreme cold weather.
Export citation and abstract BibTeX RIS

Original content from this work may be used under the terms of the Creative Commons Attribution 4.0 license. Any further distribution of this work must maintain attribution to the author(s) and the title of the work, journal citation and DOI.
1. Introduction
The cold vortex (CV), also known as cut-off low, is a closed cyclonic eddy that often forms to the south of westerlies (Palmén and Newton 1969), and is typically seen in the middle and upper troposphere as closed geopotential lows with a cold core or cold trough (Hsieh 1949, Hoskins et al 1985), which can lead to extremely cold local temperatures (Xie and Bueh 2015, Lian et al 2016, Shi et al 2020). Northeast Asia is one of the most prevalent places where CVs occur (Nieto et al 2005, Hu et al 2010, Shi et al 2020). The formation of a CV is more frequent in summer than in winter (Kentarchos and Davies 1998, Nieto et al 2005, Hu et al 2011), hence numerous studies emphasize the climate impact of northeast Asian CV (NACV) on East Asia (EA) during warm seasons, particularly for precipitation events (Sakamoto and Takahashi 2005, Hu et al 2010, Lian et al 2010, 2016, Xie and Bueh 2015, Xie and Bueh 2017, Cao et al 2018, Fang et al 2018, 2021, Gang et al 2019). However, NACV also can exert a great influence on cold weather in winter (Shi et al 2020).
Atmospheric blocking, which refers to a quasi-stationary anticyclone over the extratropics, is closely associated with the emergence of CV (Sun et al 1994, Nieto et al 2007). However, most CVs persist only a few days (2–3 days and rarely last more than five days (Kentarchos and Davies 1998, Nieto et al 2005), which is considerably shorter than the duration of blocking (Luo et al 2016). Currently, many studies focus on the impact of the blocking system on the cold weather over the Eurasian continent (Park et al 2011, Cheung et al 2012, Yao et al 2017, Luo et al 2016, 2017, 2019, Pang et al 2020, Dong et al 2020, Li et al 2021), and particularly in the last decade when these extreme cold winters have become more frequent (Tang et al 2013, Cohen et al 2014, Ma et al 2018, Rudeva and Simmonds 2021). The occurrence of blocking can result in more extreme cold events with longer duration and greater intensity (Park et al 2011, 2014, Pang et al 2020, Yang et al 2020). Furthermore, the number of extreme cold days in EA shows an increasing trend in recent years due to the lengthening of the Ural blocking (UB) lifecycle (Luo et al 2018, 2019), and the impact of blocking on extreme cold weather has attracted more attention than has the influence of CV. Therefore, the studies of CV hitherto do not present a comprehensive picture of this phenomenon (see, e.g. Lian et al 2016 for a review), especially during the cold season. The investigation of the joint impact of blocking and CV is also crucial but not yet fully researched. For example, Nieto et al (2007) investigated the association between blocking and CV in winter but focused on the European continent; while Lian et al (2010) and Xie and Bueh (2017) emphasize the favorable role of blocking-type circulation for persistent NACV, but their investigations were limited to the warm season. The combined effect of the atmosphere–ocean system on blocking and NACV has been investigated by Lian et al (2013) but based on the seasonal timescale. Therefore, the relationship between blocking and NACV in winter and their combined effect on cold outbreaks over EA in the intraseasonal time scale is unclear and of importance to investigate, which may be a potential predictive indicator.
In this work, various impacts of NACV events on the climate in EA are investigated, including the roles played by the upstream and downstream blocking and the temperature anomalies in EA as a result of their concurrence. This approach aids in our understanding of the mechanisms of East Asian extreme cold weather and improves the skill of short-range weather forecasts.
2. Data and method
We use daily mean fields averaged from 1-hourly data of 2 m surface air temperature (SAT), 500 hPa geopotential height (Z500), and temperature (T) data on a 1° × 1° grid from the European Centre for Medium-Range Weather Forecasts reanalysis version 5 (Hersbach et al 2020) for boreal winter (December–February) from 1979–2019. Anomalies of each variable are calculated by subtracting the 1979–2019 climatological daily mean for each calendar day at each grid point.
As in previous studies (Nieto et al
2005, Hu et al
2011), a CV system is required to have a closed low-pressure center located in the study area at 500 hPa, accompanied by a cold core or evident cold trough for at least two days. Based on these definitions, we search every grid point in the domain of northeast Asia (30° N–60° N, 100° E–145° E) to find a minimum point whose Z500 is less than that of the four circular grids that surround it in its eight directions, which basically match the horizontal scale of CV (Hu et al
2010). In addition, a positive zonal T500 Laplacian ( should exist in the minimum center or its surrounding eight points. When the above conditions persist for two days or more with the daily longitude and latitude of the cold core shift being less than 10°, it is considered a NACV process. With these criteria, 111 NACV events are identified during the winters of 1979–2019. In our discussion below, lag 0 refers to the peak day with the minimum low-pressure anomaly during its lifecycle. To further examine the relationship between blocking and NACV, we use the two-dimensional blocking index (Davini et al
2012), which can better capture blocking events in wider regions than the one-dimensional blocking index (Tibaldi and Molteni 1990), to identify blocking events over the Ural Mountains (50° N–75° N, 30° E–90° E) (referred to as UB events) and Eastern Siberia to mid-North Pacific (40° N–75° N, 100° E–160° W) (SPB events). This index is based on the reversal of meridional gradients of 500 hPa geopotential height from the south (GHGS) to north (GHGN):
should exist in the minimum center or its surrounding eight points. When the above conditions persist for two days or more with the daily longitude and latitude of the cold core shift being less than 10°, it is considered a NACV process. With these criteria, 111 NACV events are identified during the winters of 1979–2019. In our discussion below, lag 0 refers to the peak day with the minimum low-pressure anomaly during its lifecycle. To further examine the relationship between blocking and NACV, we use the two-dimensional blocking index (Davini et al
2012), which can better capture blocking events in wider regions than the one-dimensional blocking index (Tibaldi and Molteni 1990), to identify blocking events over the Ural Mountains (50° N–75° N, 30° E–90° E) (referred to as UB events) and Eastern Siberia to mid-North Pacific (40° N–75° N, 100° E–160° W) (SPB events). This index is based on the reversal of meridional gradients of 500 hPa geopotential height from the south (GHGS) to north (GHGN):
where  and
and  represent the longitude and latitude of a grid point in the study area,
  ,
,  . Note that the condition in equation (1c
) is added to exclude low-latitude blockings (Davini et al
2012). A UB (SPB) event is detected if the above conditions cover a 5° latitude × 15° longitude region in the Ural (Eastern Siberia to mid-North Pacific) for at least four consecutive days. Accordingly, 52 UB events and 88 SPB events are identified. Similar to above, lag 0 refers to the peak day with maximum high-pressure anomaly during its lifecycle.
. Note that the condition in equation (1c
) is added to exclude low-latitude blockings (Davini et al
2012). A UB (SPB) event is detected if the above conditions cover a 5° latitude × 15° longitude region in the Ural (Eastern Siberia to mid-North Pacific) for at least four consecutive days. Accordingly, 52 UB events and 88 SPB events are identified. Similar to above, lag 0 refers to the peak day with maximum high-pressure anomaly during its lifecycle.
A two-sided Student t-test is used to determine the statistical significance of the anomalies (Wilks 2011).
3. Results
3.1. The characteristic of NACV events and corresponding circulation
To ascertain the susceptible EA area in NACV events, we conduct composite analysis on all cases, and we consider the surface temperature decrease over the target domain (25° N–52° N, 100° E–140° E, green rectangle in figure 2) in five-days averaged (from lag −13 days) composite fields (supporting information figure S1) as the EA area of interest. Note that not all NACV events are accompanied by distinct cold anomalies over EA. Thus, we excluded the case with positive SAT anomaly (SATA) in EA during the main periods (from lag −1 to 3 days) of NACV events, leaving 77 cases for discussion.
Figures 1(a) and (b) depict the probability density functions for durations of these 77 NACV events and corresponding cold days over EA. Note that the cold days here refer only to the period during which the negative East Asian SATA index drops and rises in response to NACV events, i.e. the days with negative SATA index that manifested before or after NACV event are not counted in. Figure 1(a) shows that more than half of the cases last only two days, with an average of around three days, consistent with previous studies (Kentarchos and Davies 1998, Nieto et al 2005). However, the cold anomalies in EA associated with NACV persist for much longer, by 9.2 days on average (figure 1(b)). This further highlights the critical role of NACV in East Asian cold weather. The intensity of NACV at lag 0 and the corresponding averaged East Asian SATA index are shown in figure 1(c). There is a weak upward trend in the intensity of the negative SATA index during 1979–2000, which is in accord with global warming (Choi et al 2009). After 2000, however, the cold anomalies caused by NACV have shown a slight increase in frequency and intensity. This phenomenon, which also has been found in many studies, indicates frequent cold extremes and higher temperature variability throughout the global warming hiatus and Arctic Amplification period (Francis and Vavrus 2012, Zhang et al 2012, Dai et al 2015, Li et al 2015, Cohen 2016, Ma et al 2018). Note that the severity of cold anomalies in EA does not precisely match the intensity of NACV in figure 1(c), and vice versa. The correlation between the intensity of NACV and SATA in EA (after detrended) at lag 0 is 0.23, which exceeds 95% confidence level when considering the autocorrelation effective degrees of freedom. This positive but moderate correlation relationship suggests that there may be other systems in conjunction with NACV to affect the temperature in EA. Hence the strong and weak NACV events will be further examined in the following analysis to identify any other plausible influences.
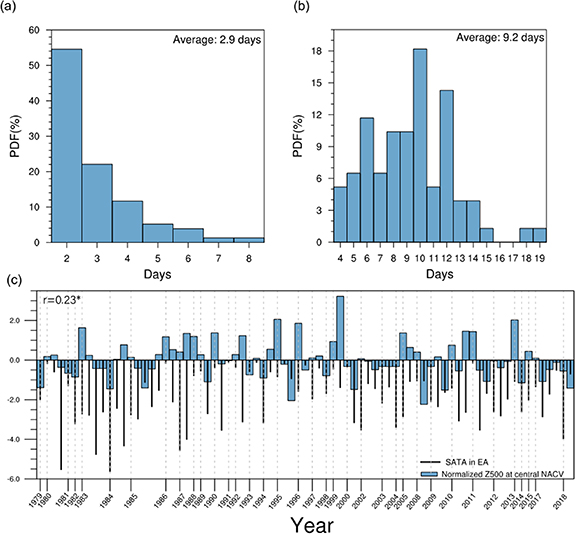
Figure 1. (a) Probability density function (PDF) distributions for lifecycle of 77 NACV events. (b) PDF distributions for cold days with negative SATA in EA caused by NACV events. (c) Time series of normalized Z500 (bar) in NACV center at lag 0 and SATA index in EA (line) averaged from lag −1 to 3 days for 77 NACV events. The coefficient in the left upper corner denotes the correlation between central value of NACV and SATA in EA (after detrended) at lag 0, exceeding 95% confidence level.
Download figure:
Standard image High-resolution imageThe composite anomalous Z500-SAT fields of strong (weak) NACV events, defined as cases where Z500 in the central point is below (above) the 20th (80th) percentile, are shown in figure 2. For the 'Strong-NACV' type (figure 2(a)), a zonal dipole structure of height anomalies over northern Eurasia presents at lag −9; after that, the positive height anomalies progressively grow into a strong UB at lag −6. Then, the UB degenerates and shifts eastward, driving negative height anomalies to migrate southward and form an intense NACV at lag 0. In a word, the strong NACV system develops due to the southward migration of northern low-pressure anomaly promoted by eastward movement of UB, leading to the persistence of cold anomalies over mid-Eurasia to northern EA until lag 6 (figure 2(a)). In contrast, the NACV in the weak type is governed by the positive height anomalies over eastern Siberia at lag −3, which originate from the Pacific area around lag −9 (figure 2(b)). Accordingly, the location of NACV at lag 0 is further south, with subsequently modest cold anomalies across mid-EA persisting no more than six days (figure 2(b)). Therefore, we could deduce that the formation and location of NACV may be regulated by the high-pressure anomaly nearby. Sun et al (1994) also pointed to the vital role of East Asian blocking on NACV, and many studies emphasize the effect of Eurasian blocking on the cold weather in EA, especially for the UB (Park et al 2011, 2014, Luo et al 2019, Yang et al 2020). In our work, though, we note that the blocking high that can affect NACV may originate not only from the Ural Mountains area upstream, but also from the eastern Siberian to mid-North Pacific region downstream. We identified 52 UB and 88 SPB cases, which are detailed in section 2, to explore their possible associations with NACV events.
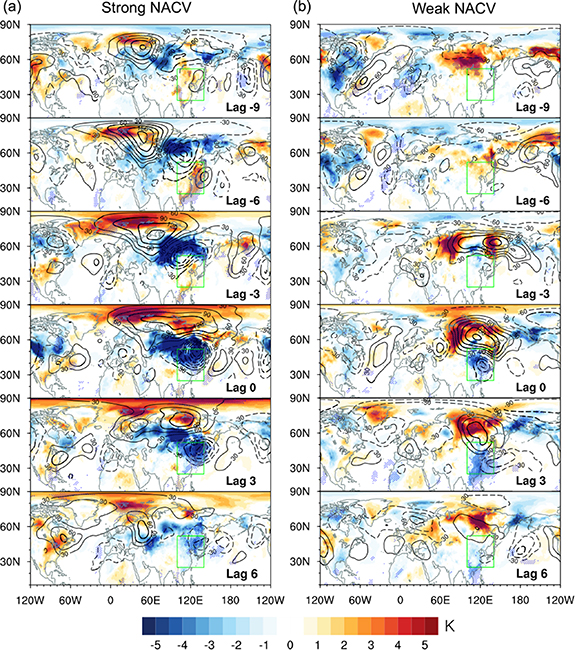
Figure 2. Lead–lag composite of anomalous SAT (shading; K) and Z500 (contour; gpm, CI = 30 gpm) for the strong (a) and weak (b) NACV events, whose central Z500 of NACV is below the 20th and above the 80th percentile, respectively. The thick line and dot denote that the anomaly is statistically significant above the 95% confidence level. The green rectangle denotes the EA domain (as also in following figures).
Download figure:
Standard image High-resolution image3.2. The relationships between blockings and NACV and their combined impacts
The close association of CV with blocking over Europe during its life cycle has been pointed out by Nieto et al (2007). However, the causation of CV and blockings is ambiguous. In this study, we further classify the NACV events according to whether they are associated with blocking. Here we consider a NACV event as being related to UB (SPB) if the peak day of the UB (SPB) event occurs within the periods from lag −10 to 10 days of the NACV event. Compared with the NACV events that occurred without UB or SPB, these blocking-associated cases may generate more severe and prolonged cold anomalies in EA (figure S2), which further highlights the essential function of blocking on NACV and their combined effect on the East Asian cold weather.
Firstly, we focus on the NACV events with blocking precursors. As shown in figure 3, there are 17 (23) NACV events with UB (SPB) occurred during the initial periods from lag −9 to −1 days, which we named accordingly as 'Initial-UB (SPB)' events. Here we use the domain average of Z500 anomalies over the Ural Mountains (50° N–75° N, 30° E–90° E) and Eastern Siberia to mid-North Pacific (40° N–75° N, 120° E–180° W) as UB and SPB index respectively, to measure the strength of the blocking. The NACV index is calculated by domain averaging Z500 anomalies in northeast Asia (30° N–60° N, 100° E–145° E), where the NACV events are identified. It can be seen that the maximum amplitude of temperature drops in EA lag NACV by about 2 days (figures 3(a) and (b)). For the 'Initial-UB' events, the UB index reaches its maximum amplitude around 1.5 standard deviations (std) at lag −4, leading SATA in EA to drop to −1.5std at lag 2 to 3 days. Warm Barents–Kara Seas and cold Eurasian continent can be recognized on the nine-day-mean field (figure 3(c)) and evolution fields (figure S3(a)). This warm Arctic-cold Eurasian continent pattern has also been investigated in many studies (e.g. Luo et al 2016, 2017, Yao et al 2017, Dong et al 2020), which emphasizes the role of local development of UB on the cold extreme over Eurasia. For the 'Initial-SPB' events, both strengths of NACV and temperature drop in EA are weaker than those in the 'Initial-UB' events, similar to figure 2. The SPB index reaches its maximum value of 1.2std around lag −3, followed by SATA in EA drop to the minimum value of −1.2std at lag 2 to 3 days (figure 3(b)). In addition, we notice that the UB index rises to around 0.5std after the SPB develops, which can be recognized in the circulation pattern as a Ural ridge (figures 3(d) and S3(b)). Accordingly, the cold anomalies in EA last longer than the 'Initial-UB' type, with significant negative SATA in EA persisting for nearly two weeks (figure 3(b)). That is to say, the westward shift of SPB might induce the development of the upstream system (figures S3(b) and S4(b)), hence prolonging cold anomalies in EA.

Figure 3. (a) and (b) Normalized composite time series of SPB, UB, NACV index, and SATA index in EA based on the condition of with (a) UB, (b) SPB in the initial periods from lag −9 to −1 days. (c) and (d) Composite anomalies of Z500 (contour, CI = 20 gpm) and SAT (shading, K) fields averaged from lag −4 to 4 days based on two different initial conditions. The thick lines and dots indicate that the anomalies are statistically significant above the 95% confidence level.
Download figure:
Standard image High-resolution imageTherefore, we were led to examine the UB cases that occurred after NACV formed to verify the downstream effect as mentioned above. Interestingly, there are 13 UB cases that matured after lag 0 of NACV, which develop associated with the downstream system. As shown in figure 4(a), the NACV index shows three development phases, while the SATA in EA begins to drop since the second process due to the blocking index rising, highlighting the importance of blocking. It can be seen that the UB index rises to the maximum value at lag 4 after the decay of the SPB index, and therefore induces the NACV index dropped again around from lag 12 to 14 days. Thus, significant SATA in EA persists for nearly 20 days in the UB case, in contrast to the SPB case. In the composite average evolution fields (figures 4(c) and S5), positive height anomalies dominate the Arctic area from lag −10 onwards. As noted in many studies, a negative Arctic oscillation (AO) pattern can offer a beneficial environment for blocking system development (Park et al 2011, 2014, Screen et al 2018), hence promoting the frequency and duration of extreme cold weather in EA (Jeong and Ho 2005, Pang et al 2020, Song et al 2021). In this type of event, the AO index is consistently below −0.5std (AO−) for the whole period (figure 4(a)), providing a favorable environment for double blocking constructions. Under the background of AO−, the westward shift of the SPB contributes to the development of the UB (figures 4(b), (c) and S5), forming a relay effect to motivate NACV process, hence prolonging the duration of cold anomalies in EA. Compared to the 'Initial-UB' and 'Initial-SPB' events mentioned before, this 'SPB-UB relay' type of event can produce a longer-lasting cold extreme in EA, which deserves attention in short-term weather forecasting.
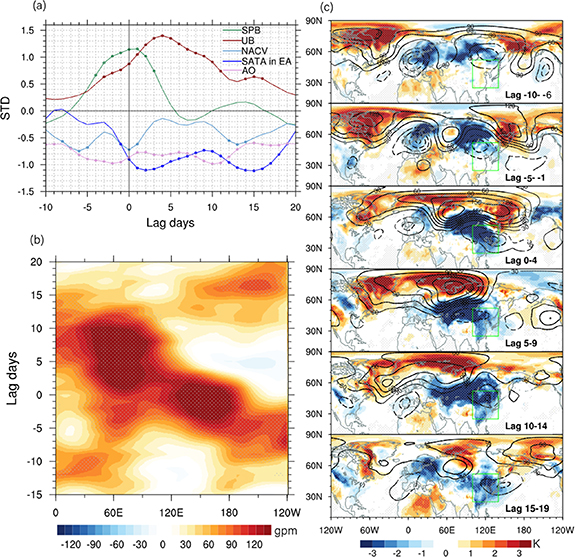
Figure 4. (a) Same as in figure 3(a) but for 'SPB-UB relay' type of NACV events. (b) Time–longitude evolution of composite daily Z500 anomalies averaged over 60°–90° N based on the 'SPB-UB relay' type. (c) Lead–lag composite of averaged anomalous SAT (shading; K) and Z500 (contour; CI = 30 gpm) based on the 'SPB-UB relay' type. Dots and thick lines in c denote the anomalies are statistically significant above the 95% level of confidence.
Download figure:
Standard image High-resolution image4. Conclusion and discussion
In this study, we systematically examined various NACV events and their effects on the East Asian temperature. Close relationships manifest between the NACV and cold anomalies in EA. The results show that the development of NACV is closely related to the blocking or ridging over the Ural Mountains upstream and eastern Siberia downstream. The strong NACV events, which can result in severe cold outbreaks in EA, are facilitated by the eastward movement of UB. The westward shift of ridging over eastern Siberia downstream, however, can lead to weak NACV events and less dramatic temperature drops in EA.
These results led us to further examine the blocking-associated NACV events in various initial situations. As schematically represented in figure 5(a), the NACV events in the 'Initial-UB' condition can bring the greatest temperature drop in EA. For the NACV events associated with the 'Initial-SPB' condition, EA may experience weaker but longer-lasting cold anomalies, which are prolonged by Ural ridging that forms after SPB decay (figure 5(b)). This downstream effect is something of considerable note. In fact, there are some UB cases showing an obvious relay effect with the downstream system, which occurred under the background of AO− pattern (figure 5(c)). In such cases, UB is formed by the westward shift of downstream SPB or ridging after the occurrence of NACV, forming a relay effect that motivates the second NACV process, hence prolonging the duration of cold anomalies in EA. Compared to the 'Initial-UB' and 'Initial-SPB' situation, this 'SPB-UB relay' scenario can produce longer-lasting cold extreme in EA, which has strong implications for short-term weather forecasting.

Figure 5. Schematic showing the configuration of circulation systems with a timeline of NACV events that occurred in the situation of (a) Initial-UB, (b) Initial-SPB, and (c) SPB-UB relay scenario. The color of the upper (lower) bar indicates the corresponding intensity (duration) of East Asian cold anomalies.
Download figure:
Standard image High-resolution image
Generally, the climate in EA can be affected by the development of Eurasian blocking systems upstream (Park et al 2011, Luo et al 2016, 2019, Yang et al 2020, Yao et al 2021). In the Siberia area, the studies of blocking are mainly concentrated on its amplification role on Siberian high (Takaya and Nakamura 2005, Park et al 2014, Pang et al 2020) or modulation effect on East Asian winter monsoon (Cheung et al 2012). In other words, the downstream blocking effect on cold weather in EA has been neglected in favor of the more pronounced upstream blocking effects. Given the difficulty of extreme weather prediction, our results suggest that the mechanisms we have identified could be of assistance in some cases for short-range cold weather forecasting for about a week to ten days. The favorable conditions that sustain the westward migration of SPB, as well as possible links to Arctic sea ice (Wu et al 2011, 2022, Simmonds and Pallavi 2014, Luo et al 2019, Li et al 2021), will be investigated in the future work.
Acknowledgments
The first three authors and Huang acknowledge support from the National Natural Science Foundation of China (Grants 41975068, 42150204, 41790473 and 42075024) and the Chinese Academy of Sciences Strategic Priority Research Program (Grant XDA19070403). Simmonds was supported by the Australian Research Council (Grant DP 160101997).
Data availability statement
The data that support the findings of this study are available upon reasonable request from the authors.
Supplementary data (2.5 MB DOCX)