

Abstract
Climate change is projected to transform agricultural systems around the globe. Though climate strongly influences where and how farmers cultivate, millennia of agricultural innovation have expanded cultivation geographies far beyond what sun, soil, and water alone can support. Evaluating how climate interacts with human activity to shape cultivation possibilities for farmers is vital to understanding the impacts of climate change on agriculture. I assess how climate interacts with agricultural activity to shape the cultivation geographies of six major crops: corn, soy, wheat, cotton, hay and alfalfa. For each crop, I model biophysical suitability, or the probability of a crop's occurrence given only biophysical conditions, and agricultural suitability, or the probability of a crops occurrence given biophysical conditions as well as agricultural inputs, farm resources, and farm(er) characteristics. Though biophysical conditions strongly shape cultivation geographies, agricultural activity—particularly the use of crop insurance and agricultural inputs—amplifies and expands the cultivation geographies of these major crops, often into regions biophysically unsuited to their cultivation. I project biophysically driven shifts in cultivation geographies to 2100 under low, moderate, and high emissions scenarios and find that these geographies will shift strongly north, with the Corn Belt becoming unsuitable to the cultivation of corn by 2100. These results indicate that significant agricultural adaptation will be necessary and inevitable in the Central and Eastern U.S.
Export citation and abstract BibTeX RIS

Original content from this work may be used under the terms of the Creative Commons Attribution 4.0 license. Any further distribution of this work must maintain attribution to the author(s) and the title of the work, journal citation and DOI.
1. Introduction
Climate change is projected to transform U.S. agriculture through changes in yield [1–6] and shifts in the cultivation geographies of many crops [7–10]. Though climate strongly influences where and how humans cultivate [5, 11, 12], millennia of human activity have pushed cultivation geographies far beyond what sun, soil, and water alone can support. Modern agricultural systems emerge from the interactions of biophysical conditions with the cultivation decisions of millions of farmers—themselves shaped by the interactions technological norms, political-economic incentives, and on-farm realities.
The agricultural landscapes that emerge from these complex interactions in the United States (U.S.) are some of the most productive agricultural systems on the planet. Over the last century, these systems have seen a tripling of soy and wheat yields and a five-fold increase in corn yields [13]. Today, over of two-thirds of land in the coterminous U.S. is devoted to the production of food, fuel, and fiber [14]. Six crops—corn, cotton, soy, wheat, hay, and alfalfa—cover nearly 80% of cultivated acreage [15, 16]. The dominance of these crops reflects less biophysical conditions and more political-economic and technological norms that incentivize simplified commodity production [14, 17]. Innovations in input use [18, 19], crop genetics [20–22], irrigation technologies [23, 24], and precision agriculture [25, 26] have strongly contributed to the dominance of these five crops. Federal policies—including the introduction of price floors for major grains and acreage-based production controls [27, 28]—have also contributed, driving a drop in the average number of crops produced per farm from roughly 4.5 to 1 over the last 60 years [29]. Federal crop and income insurance programs further incentivize commodity cultivation by providing a financial buffer against their under-performance [30], slowing adaptation to future climate change [31]. These federal policies are themselves the outcomes of political processes that reflect efforts by private agricultural, food, energy, and environmental organizations to lobby for particular programs [32, 33].
There is strong consensus that significant shifts in the agricultural technologies and political-economic incentives that currently shape U.S. agricultural systems are needed to meet future demand for food, fuel, and fiber in a much warmer climate. For example, Liang et al [5] project that by 2040, climate change will reduce the total factor productivity (TFP)—a measure of agricultural output per unit input—of U.S. agriculture by 4.34% annually (RCP8.5). They conclude that in the next 30 years, climate change will cause the loss of all national TFP gains achieved from 1981 to 2010 and that technological advances would have to double by 2040 to sustain current levels of agricultural output. Burchfield et al [15] find that without maintaining historical rates of innovation, the negative impacts of climate change on U.S. yields corn, soy, and wheat will be increasingly severe; however, if technological innovation grows at even the lowest rates seen in recent decades, yields may actually increase [34]. Other work highlights the adaptive potential of climate-smart agricultural practices [35, 36], on-farm emission reduction efforts [26, 37, 38], cultivar shifts [39–41], infrastructural expansion, and shifting U.S. Farm Bill priorities [17, 42]. Taken together, this research highlights how even small differences in our assumptions about the pace and direction of future technological and political-economic change can significantly alter projected agricultural futures.
Despite the importance of agricultural technology and political-economic incentives in shaping agricultural land use, most contemporary efforts to understand and project cultivation geographies have focused exclusively on the role of biophysical conditions [7, 8, 10, 43–45]. Understanding how biophysical conditions interact with agricultural technologies, political-economic incentives, and on-farm realities to shape cultivation possibilities for farmers (and the socio-environmental consequences of these cultivation outcomes) is paramount to identifying adaptive pathways towards resilient and sustainable agricultural futures. In this paper, I explore how climate has historically interacted with agricultural activity to shape the cultivation geographies of six crops that constitute ∼80% of cultivated land in the Central and Eastern U.S.: alfalfa, corn, cotton, hay, soy, and wheat. For each crop, I first model the probability of a crop's occurrence based solely on biophysical conditions (which I refer to as 'biophysical suitability') and again based on the historical interactions between biophysical conditions and the capacity of various human interventions—such as input use and crop insurance—to alter biophysical realities ('agricultural suitability'). One goal of these modeling efforts is to determine whether we can predict historical cultivation geographies using only biophysical predictors for which reasonable projections into the future exist. Another is to assess the extent to which human interventions have already expanded, amplified, and altered the cultivation geographies defined by biophysical conditions alone. The results indicate that we can, in fact, predict historical cultivation geographies well using only biophysical predictors; however, they also suggest that accounting for endogenous human responses to biophysical realities expands and amplifies cultivation geographies. Using these historical models, I project future shifts in cultivation geographies to 2100 under low, moderate, and high emissions scenarios using only biophysical predictors. While these preliminary projections suggest that biophysical shifts alone are likely to drive the northern shift of current cultivation geographies—with much of the Midwestern US becoming unsuitable to the cultivation of corn by 2100—the projections also likely overestimate these shifts by ignoring the potential impact of technological innovation and adoption, varietal shifts, and a shift towards more adaptive political-economic incentives. I conclude by discussing the importance of supporting efforts across the Central and Eastern U.S. to mitigate these probable geographic shifts through intentional human intervention, while also warning of biophysical limits to these efforts.
2. Methods
2.1. Data
To identify the factors that shape the cultivation geographies of alfalfa, corn, cotton, hay, soy, and (winter) wheat in the Central and Eastern U.S., I applied the random forest algorithm to crop-specific datasets describing the climatic, edaphic, topographic, and agricultural characteristics of regions historically cultivated with each crop (table 2; SI tables 4 and 5 available online at stacks.iop.org/ERL/17/054049/mmedia). To build these datasets, I randomly sampled pixels from the USDA's annually updated 30 meter Cropland Data Layer (CDL) [14] to identify 10 000 'presence' pixels in which each crop was cultivated at least once from 2008 to 2019 and 10 000 'absence' pixels in which each crop was never cultivated over the same period (for CDL categories, see SI table 6). From 1 kilometer monthly climate summaries provided by the DayMet group [46], I constructed 19 indicators used by the WorldClim project [47] of average seasonal climate over the period from 2000 to 2020 [47] and extracted these indicators to each absence/presence pixel centroid. The final model includes only the eight climatic indicators with the highest variable importance when predicting crop presence/absence with a random forest model using only biophysical predictors: annual mean temperature, temperature seasonality, maximum temperature of the warmest month, minimum temperature of the coldest month, mean diurnal range, annual precipitation, precipitation seasonality, precipitation of the wettest month, precipitation of the driest month (see table 1). Using this subset of climatic predictors increases model interpretability with a negligible effect on model performance (SI table 7). I also included indicators of slope and elevation extracted from the National Elevation Dataset [48] and soil characteristics extracted from the Regridded Harmonized World Soils Database [49, 50]. Because the ultimate goal of this research is projection of future cultivation geographies, I included only intrinsic soil properties that are likely to remain static into the future: topsoil gravel, topsoil sand, topsoil clay, topsoil silt, topsoil clay cation exchange capacity, topsoil soil cation exchange capacity, and drainage class (table 1) [51]. Though this excludes use-dependent properties important to agricultural production such as soil pH and nutrient holding capacity, removing these predictors has little effect on model performance (SI table 7).
Table 1. Predictors in the (A) biophysical and (A and B) agricultural suitability models. A more detailed description of the USDA census of agriculture variables in the 'agricultural' category can be found in SI table 9.
| Category | Variable name (units) |
|---|---|
| (A) Biophysical | |
| Topography | Slope |
| Elevation | |
| Climate | Annual mean temperature (°C) |
| Temperature seasonality (standard deviation × 100) | |
| Maximum temperature of the warmest month (°C) | |
| Minimum temperature of the coldest month (°C) | |
| Mean diurnal range (°C) | |
| Annual precipitation (mm) | |
| Precipitation seasonality (coefficient of variation) | |
| Precipitation of the wettest month (mm) | |
| Precipitation of the driest month (mm) | |
| Soil | Topsoil gravel (% volume) |
| Topsoil sand (% volume) | |
| Topsoil clay (% volume) | |
| Topsoil silt (% volume) | |
| Topsoil clay cation exchange capacity (Cmol kg−1) | |
| Topsoil soil cation exchange capacity (Cmol kg−1) | |
| Drainage class | |
| (B) Agricultural | |
| Inputs | Fertilizer ($/acre) |
| Chemicals ($/acre) | |
| Labor ($/acre) | |
| Machinery ($/acre) | |
| Irrigation (irrigation presence from 2002 to 2017) | |
| Farm resources | Total farm income ($/operation) |
| Government receipts ($/acre) | |
| Insurance (% acreage) | |
| Farm(er) characteristics | Years farming |
| % farming as primary occupation | |
| % tenants | |
| Median farm size (acres per operation) | |
a This category consists of direct payments from the government and includes: payments from Conservation Reserve Program, Wetlands Reserve Program, Farmable Wetlands Program, and Conservation Reserve Enhancement Program; loan deficiency payments; disaster payments; other conservation programs; and all other federal farm programs under which payments were made directly to farm operators. Commodity Credit Corporation (CCC) proceeds, local and state government agricultural program payments, and federal crop insurance payments are not tabulated in this category [117]. b Agricultural land enrolled in any Federal, private, or other crop insurance programs, measured as the total number of acres with insurance and standardized by the total number of agricultural acres in a county [117]. This includes acreage of pasture/rangeland enrolled in crop insurance programs in areas where provided.
Table 2. Mean performance metrics on 25% held-out data (n = 1000 iterations). A threshold of 0.5 was used to assess performance, measured using the overall percentage correctly classified (PCC), model sensitivity (the percentage of presences correctly classified), specificity (the percentage of absences correctly classified), kappa (a measure of agreement between predicted presences and absences with actual absences and presences corrected for agreement that might be due to chance alone), and the area under the receiver operating characteristic curve (AUC).
| PCC | Sensitivity | Specificity | Kappa | AUC | |
|---|---|---|---|---|---|
| (A) Biophysical predictors | |||||
| Alfalfa | 0.850 | 0.806 | 0.891 | 0.699 | 0.849 |
| Corn | 0.892 | 0.874 | 0.910 | 0.784 | 0.892 |
| Cotton | 0.951 | 0.933 | 0.969 | 0.903 | 0.951 |
| Hay | 0.818 | 0.772 | 0.862 | 0.636 | 0.817 |
| Soy | 0.895 | 0.860 | 0.928 | 0.790 | 0.894 |
| Wheat | 0.953 | 0.929 | 0.977 | 0.907 | 0.953 |
| (B) Agricultural + biophysical predictors | |||||
| Alfalfa | 0.904 | 0.867 | 0.939 | 0.807 | 0.903 |
| Corn | 0.939 | 0.934 | 0.943 | 0.877 | 0.938 |
| Cotton | 0.975 | 0.969 | 0.981 | 0.950 | 0.975 |
| Hay | 0.847 | 0.819 | 0.873 | 0.693 | 0.846 |
| Soy | 0.942 | 0.935 | 0.948 | 0.884 | 0.942 |
| Wheat | 0.964 | 0.946 | 0.982 | 0.928 | 0.964 |
Unlike wild species distributions, agricultural cultivation geographies are fundamentally defined by human activity. To understand how human activity has altered cultivation geographies historically, to each pixel centroid I extracted rasterized county-level indicators of agricultural inputs (fertilizer, chemicals, labor, machinery, and irrigation), farm resources (income, government support, and crop insurance) and farm(er) characteristics (experience, land ownership, and farm size) from USDA Census data available in 2002, 2007, 2012, and 2017. Variables were averaged across time and standardized by agricultural acres operated in a county unless otherwise noted in table 2 (see SI table 9 for more detailed description of these variables). Because the USDA estimates of irrigated acreage—an important predictor of suitability—have limited availability in the region of interest, I constructed a binary irrigation indicator using 1 kilometer resolution MIrAD-US data [52] (SI figure 16). This indicator designates whether a pixel was ever irrigated in the years for which the MIrAD-US data product was available (2002, 2007, 2012, 2017). Models with this indicator perform marginally better than those including the subset of available USDA irrigated acreage data (SI table 8). The decision to aggregate across time was based on (a) the desire to capture the average conditions shaping cultivation geographies in a specific county, (b) the temporal mismatch in data availability between the USDA Census and the biophysical data, (c) significant levels of missing data in the USDA Census which if included would eliminate counties with missing data from the analysis and (d) the relatively low variability of these predictors through time (see SI figure 18).
2.2. Historical suitability models and validation
Increasingly, species distribution models use data-driven approaches that optimize predictive performance rather than mechanistic explanation [10]. I employ the former approach for two reasons. First, the data-intensive and detailed inputs required to calibrate mechanistic models are not available at large spatial scales. Second, empirical suitability models for agricultural crops typically perform well, attaining the same or better accuracy as mechanistic models when predicting both crop suitability and crop productivity [7–10, 53]. In this study, I used random forests, a predictive algorithm that is well-suited to high dimensional, multicollinear data [54, 55] and that performs exceptionally well when applied to suitability modeling [54, 56, 57]. Crucially, random forests makes no distributional assumptions about the data on which it is trained—allowing it to handle complex nonlinear interactions among predictors.
For each crop, I trained historical suitability models using 75% of the data randomly sampled across space (n = 15 000) with only biophysical predictors ('biophysical models') and with the full set of biophysical and agricultural predictors ('agricultural models') using the randomForest package in R [55]. I applied these historical suitability models to 1 kilometer rasterized stacks of the predictors described in table 1 to generate 1 kilometer resolution estimates of the probability of a crop's occurrence (from 0 to 1) for the entire region. I assessed model performance on 25% held-out data (n = 5000) using the overall percentage correctly classified (PCC), model sensitivity (the percentage of presences correctly classified), specificity (the percentage of absences correctly classified), kappa (a measure of agreement between predicted presences and absences with actual absences and presences corrected for agreement that might be due to chance alone), and the area under the receiver operating characteristic curve (AUC) [54]. I visualize the variable importance estimates generated by the random forest algorithm, which rank the relative contribution of predictors to the prediction of cultivation geographies. Though variable importance estimates do not have causal interpretations, they do provide insights into the factors that most strongly predict cultivation geographies. I also visualize partial dependence, or the dependence of the outcome on one predictor after averaging out the effects of the other predictors in the model, graphically characterizing the relationship between an individual predictor and the predicted probability of occurrence of a crop.
2.3. Future suitability projections
For each crop, I projected future suitability using 2.5 min resolution CMIP6 downscaled data provided by the WorldClim group [47] along with the topographic and edaphic predictors described in table 2 (resampled to 2.5 min resolution using bilinear interpolation for continuous predictors and nearest neighbor interpolation for categorical predictors). I generated projections using four coupled GCMs (CanESM5, IPSL-CM6A-LR, MIROC-E2L, MRI-ESM2) run under relatively high (SSP5-8.5), moderate (SSP3-7.0), and low (SSP2-4.5) emissions scenarios. The shared socioeconomic pathways (SSPs) reflect alternative development pathways over the next century: SSP5-8.5 assumes rapid economic growth and continued use of fossil fuels, with high rates of mitigation and low rates of adaptation; SSP3-7.0 assumes slowed economic growth, higher population growth, and moderate emissions; and SSP2-4.5 assumes modest overall growth in population and increased resource use efficiency [58, 59]. For each scenario, I present the mean suitability score generated across the four GCMs (SI figures 6–11, including visualizations of standard deviation across GCM projections).
For these future projections, we are limited to predictors that are static through time or for which future projections are available to the end of the century. This prevents the inclusion of potentially important predictors such as technological innovation, political-economic (dis)incentives, and farm-level attainability, thus these models are limited in their capacity to project cultivation shifts. However, though these models do not explicitly include these factors, they do include several important assumptions about human activity. First, the historical suitability models used to generate these projections capture how the prices, policies, and technological regimes of the last 20 years have affected cultivation geographies and assume 'business-as-usual' relationships between these factors in the future. In addition, the SSPs reflect our best assumptions about the alternative development pathways that may emerge over the next century.
3. Results
3.1. Historical suitability models
The results suggest that climate, soil, and topography drive cultivation geographies (table 2(A)), with climatic predictors—particularly average temperature, temperature variability, and temperature extremes—dominating variable importance (figure 2, SI figure 1; SI table 1). This finding corroborates previous research indicating that cultivation geographies are strongly driven by biophysical parameters alone [8–10, 60] and confirms my hypothesis that we can predict cultivation geographies reasonably well using only biophysical factors. In particular, indicators of mean, maximum, and minimum seasonal temperature show the highest variable importance across crops (figure 2) and appear to interact with crop suitability in highly nonlinear ways (SI figure 14).
The inclusion of indicators of human intervention—agricultural input use, farm resources, and farm(er) characteristics—increases predictive performance, with the percent of correctly classified crop occurrences rising to 93% for corn and soy, 97% for cotton, and nearly 95% for wheat (table 2(B): Sensitivity). In addition to increasing predictive performance of the models, the inclusion of agricultural predictors alters predicted cultivation geographies in two important ways. First, agricultural activity amplifies biophysical geographies, with regions showing high biophysical suitability to a particular crop increasing in suitability and, conversely, regions less biophysically suited to a crop's cultivation showing declines in suitability (figure 1(C)). Second, agricultural activity expands biophysical suitability, with areas on the periphery of biophysically suited regions increasing in suitability—particularly for alfalfa, corn, and soy (figure 1(C)).

Figure 1. (A) Biophysical and (B) agricultural suitability estimates for the Central and Eastern U.S. (C) The difference between the agricultural and biophysical suitability shows the amplification of biophysical suitability brought by agricultural activity. Due to missing USDA data, 184 of the 2694 counties in the region of interest were excluded from the agricultural suitability models (county list in SI table 2).
Download figure:
Standard image High-resolution image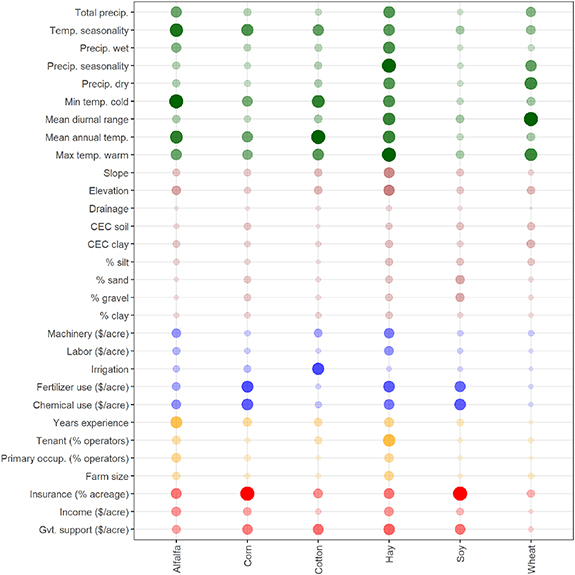
Figure 2. Variable importance, where bubble size and transparency reflect relative variable importance for each crop. Colors represent climatic predictors (green), edaphic characteristics (brown), inputs (blue), farm(er) characteristics (orange), and farm resources (red). Variable importance for the biophysical model and averaged across crops can be found in the SI (SI figures 1 and 2).
Download figure:
Standard image High-resolution imageWhat are the agricultural factors driving the amplification and expansion of biophysical suitability? When averaged across crops, crop insurance coverage—or the total acres enrolled in any federal, private, or other crop insurance program standardized by the total number of agricultural acres in a county—is the most important predictor of crop suitability (figure 2). This is seen most strongly for corn and soy cultivation, which are among the most heavily insured commodity crops in the U.S. [61]. Government receipts—which include payments for participation in conservation programs, loan deficiency payments, disaster payments, and all other federal farm programs under which payments were made directly to farm operators (with the exception of federal crop insurance)—as well as chemical and fertilizer use are also strongly predictive of crop suitability. Despite the relative importance of crop insurance and federal support, climate indicators dominate variable importance across crops, particularly indicators of seasonal temperature (e.g. temperature seasonality, minimum cold temperature, maximum warm temperature) (figure 2; SI figure 2).
Across crops, indicators of agricultural activity are associated with lower levels of crop suitability. Figure 3 shows partial dependence plots for the most important agricultural predictors. These plots visualize the effect of each predictor on the probability of crop presence while holding other predictors constant. For most crops, an increase in the use of inputs (chemicals and fertilizer) and an increase in government support (insurance and government receipts) is associated with a decrease in the predicted suitability of a region to a crop. This suggests that areas of relatively low suitability require higher levels of input use and external resources to support the crop's cultivation. This is further supported by the finding that the regions in which crops move from 'absent' to 'present' with the addition of agricultural predictors (figures 1(B) and (C)) are those with relatively high levels of input use, insurance coverage, and federal support; conversely, regions that move from 'present' to 'absent' are those with relatively low levels of these factors (figure 1; SI figure 18).
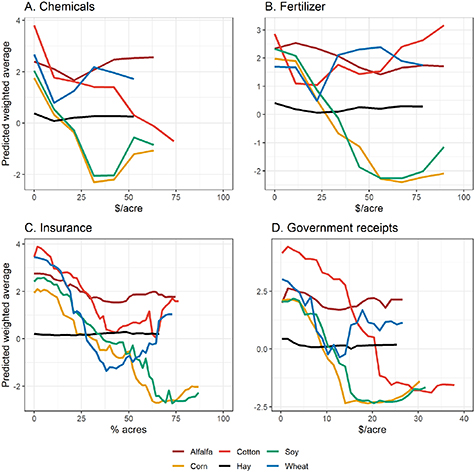
Figure 3. Partial dependence plots visualizing the effect of (A) chemical use, (B) fertilizer use, (C) insurance coverage, and (D) government receipts on the prediction of crop suitability. These plots visualize the predicted weighted average across iterations of the dependence of the probability of presence on one predictor variable while holding other predictors constant.
Download figure:
Standard image High-resolution image3.2. Future suitability projections
The high accuracy of the historical biophysical models (table 2(A)) suggests that we can, in fact, predict major shifts in crop suitability reasonably well using only biophysical predictors; however, our preliminary results also highlight the important ways in which agricultural technology, political-economic incentives, and farm circumstances have already amplified, expanded, and contracted biophysical suitability in many regions. Given the importance of these biophysical predictors in shaping crop suitability, I project suitability to 2100 using only biophysical indicators. These projections, of course, miss important human dynamics driving cultivation geographies, particularly adaptive technological and management efforts to mitigate biophysical changes; however, given the strong performance of historical biophysical suitability models, they also likely capture the major regional shifts in suitability we can anticipate over the next century for these important crops.
With moderate emissions (SSP3-7.0), the Central and Eastern U.S. is projected to see daily mean temperature increases of up to 6 °C by 2100 (figure 4(A)). The maximum temperature in the warmest month of the year is projected to increase by up to 10 °C, with some of the highest increases in agriculturally important regions (figure 4(B)). This corroborates existing studies projecting an increase of at least 2 °C in mean U.S. temperatures by 2050 and of up to 8 °C by the end of the century under severe warming [62, 63]. Though precipitation is generally less predictive of suitability than temperature, the region is also expected to see significant shifts in precipitation (figures 4(C) and (D)), which intensify under more severe emissions scenarios (SI figure 5).
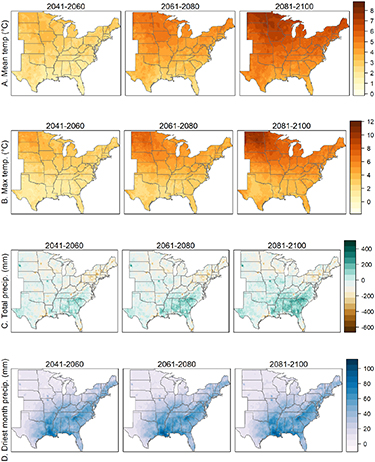
Figure 4. Projected changes in (A) mean annual temperature, (B) maximum temperature, (C) total precipitation, and (D) dry season precipitation from the IPSL-CM6A-LR model under a moderate emissions scenario (SSP3-7.0). Projections for SSP2-4.5 and SSP5-8.5 can be found in the SI (SI figures 4 and 5).
Download figure:
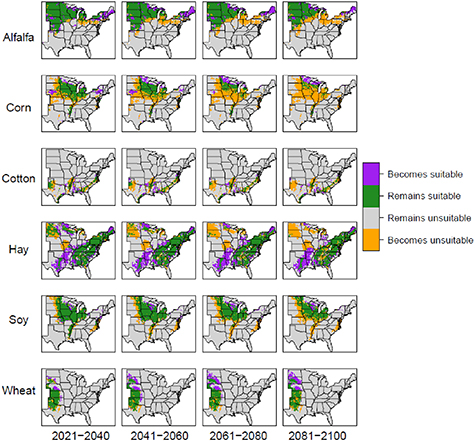
Standard image High-resolution imageThe future climate conditions depicted in figure 4 will significantly reshape biophysical suitability across the Central and Eastern U.S. (figure 5; SI figures 6 and 7), causing a near collapse of corn cultivation in the Midwestern U.S. by 2100. Soy, alfalfa, and wheat cultivation shift strongly northward by the end of the century. The area across the southern U.S. cultivated with cotton strongly contracts, and hay cultivation expands into the Central U.S. These shifts are similar, though less severe under SSP2-4.5, which assumes moderate population growth, slow progress towards sustainable development, and moderate declines in environmental system quality (SI figure 12). These shifts are strongly exacerbated under more severe emissions SSP5-8.5 which assumes continued fossil-fueled development, strong market integration, and rapid economic growth (SI figure 13). Under this more severe scenario, suitability loss is widespread for all crops, with a complete collapse of suitability (as defined by a suitability threshold of 0.4) by 2100 for corn, hay, and cotton. Importantly, in figure 5 I classify crop 'presence' using a suitability threshold of 0.4 rather than higher sensitivity-maximizing thresholds used for historical suitability maps, as these higher thresholds render most crops completely unsuitable to the Central and Eastern U.S. in the future (SI figure 13). Though this lower threshold may not reflect the suitability levels required to meet modern production objectives, it provides a sense of when and where a crop's cultivation may cease to be a viable option for farmers in a region.
Figure 5. Continuous suitability projections (SI figure 6) based on a moderate emissions scenario (SSP3-7.0) are classified as a crop 'presence' or 'absence' for visualization purposes, using a threshold of 0.4. Regions that move from absence to presence as compared to the present are shown in purple ('becomes suitable'). Regions that move from presence to absence as compared to the present are shown in orange ('becomes unsuitable'). Regions in which crops are classified as present both now and into the future are shown in green and absent in gray. Maps using crop-specific suitability thresholds that maximize test-set sensitivity (SI table 3) can be found in SI figure 13.
Download figure:
Standard image High-resolution image
4. Discussion
Although agricultural activity—specifically input use, crop insurance, and government support—plays an important role in amplifying and expanding current cultivation geographies, I find that climate drives suitability, accurately predicting as much as 93% of cotton and wheat occurrences and ∼87 and ∼90% of corn and soy occurrences (table 2(A); SI table 1). This corresponds with existing research highlighting the significant contribution of climate variability to agricultural yields [5, 12, 64] and the nonlinear manner in which climate—particularly temperature—interacts with yields [3, 34] (SI figure 14). This research holds dire warnings for the future of global agricultural systems, suggesting that each 1 °C of warming is projected to decrease global yields of wheat by 6%, maize by 7.4% and soybeans by 3.1% [4]. The research presented in this paper looks beyond production to identify the regions biophysically capable of supporting these crops in the future. The findings suggest massive shifts in suitability for the six crops that currently dominate agricultural landscapes in the U.S. This means that significant agricultural adaptation will be necessary and inevitable in the Central and Eastern U.S.
Understanding the factors that have historically altered otherwise unsuitable landscapes for agricultural production is key to supporting future adaptation. Though indicators of seasonal weather dominate variable importance, the results also indicate that access to crop insurance coverage and agricultural inputs strongly contribute to crop suitability, which has extremely important implications for the future. According to the USDA's Risk Management Agency (RMA), the agency responsible for administering federal crop insurance programs, over 85% of planted acreage for major crops is currently covered by crop insurance, with over 90% of corn and soy cultivation covered by some form of insurance [65]. Though these programs are an important source of income stabilization for U.S. farmers, they are also associated with lower rates of adoption of adaptive, climate-smart management practices that help to mitigate climate change impacts. For example, insured corn and soy have climate sensitivities that are, respectively, 67% and 43% larger than uninsured areas [31]. Similarly, I find that areas with higher rates of insured acreage are strongly associated with decreased crop suitability (figure 3; SI figure 18). Participation in these programs is also associated with other maladaptive practices such as reduced on-farm diversification [66, 67], the cultivation of more water-intensive crops [68, 69], and the expansion of corn and soy production beyond the periphery of the Corn Belt, displacing other crops better suited to the biophysical realities of the region [11, 70–73]. Given the overwhelming importance of federal crop insurance to countless U.S. farmers [31, 61, 74], it is imperative to critically examine whether these insurance programs are decoupling farmers from environmental risk in a manner that disincentivizes agricultural adaptation to changing climate.
Fertilizer and chemical use also contribute to the expansion and amplification of biophysical suitability. Fertilizer and chemical application rates in the Central and Eastern U.S. are some of the highest on the planet [18] and overuse in the region has already affected ecosystem quality [75] and farmers' bottom lines [11], with average per farm expenditures—of which labor, machinery, fertilizer, and chemicals comprise over 30%—reaching over $176 000 in 2017 [13]. Given the importance of input use in supporting crop suitability, three important points must be made. First, considering that an estimated 65% of farming operations currently do not follow best management practices for fertilizer and chemical application [76–78], the adoption and efficient application of existing technologies should be a top priority moving forward [24]. This said, there is emergent research indicating that maximum yields will soon plateau unless more radical changes such as change in crop carbon use efficiency are made [35, 79, 80]. Second, even in areas biophysically suited to the cultivation of a crop, the challenges of modern farming may render cultivation unsuitable for many farmers [81–83]. Increased input expenditures are strongly associated with unprecedented levels of famer debt [84] and a nearly 40% drop in net farm income since 2013 [85–87]. These socioeconomic challenges are deeply exacerbated for Black farmers [42, 88–91] and other underserved groups [92–94]. Additional research is needed to identify how political-economic, technological, sociocultural, and individual factors interact with biophysical suitability to define what is actually attainable for farmers. In addition to these important social thresholds, it is equally important to identify the environmental thresholds that may significantly reshape future suitability. Input-intensive agricultural systems exert a number of negative environmental externalities that erode ecosystem services essential to crop production, including pollination [95, 96], pest management [97], water retention [98], climate regulation [99, 100], and nutrient supply [101, 102]. These externalities can undermine the ecosystem services essential to agricultural production, reducing yields [15] and resilience to changing climate [103].
Despite these climatic, social, and ecological challenges, there is room for optimism. First, the projections presented in this study assume that the fundamental relationships between biophysical conditions, agricultural activity, and suitability do not change in the future. The technological innovations of the last century have drastically increased agricultural productivity, bringing tremendous changes to agricultural systems worldwide. It is highly likely that the next century will bring similarly transformative innovations; however, for these innovations to be effective they must mitigate, rather than accelerate, the socio-environmental externalities associated with current production practices. This is possible through sustainable intensification that leverages information-intensive—rather than input intensive—innovations such as genome editing and precision agriculture as well as ecosystem-based interventions boost ecosystem services to support agricultural productivity [24, 34, 104]. Given that even small shifts in our assumptions about technological innovation significantly alter projected agricultural futures [34], understanding when and how technological change might mitigate suitability shifts as well as how access to these technologies might vary across agricultural communities is a crucial area for continued research. The projections presented in this paper miss important, emergent innovations such as climate-smart agricultural initiatives that reduce greenhouse gas emissions and sequester carbon [36, 105] or the increase of conservation agricultural practices across the region [73, 106, 107]. By missing the potential role of these important future innovations, the tentative projections presented in this paper likely overestimate shifts in cultivation geographies. Understanding how increased participation in these initiatives might mitigate the cultivation shifts suggested by these analyses is a crucial avenue for future research.
Second, these projections assume the political-economic forces manifest in historical cultivation geographies will persist into the future. Since the 1960s, harvested soy and corn acreage has increased by 76%, while acreage for other feed crops such as oats, barley, sorghum, and hay has declined by a combined 50 million acres [17, 108]. Corn and soy alone now comprise nearly 56% of harvested cropland in the U.S. [13], with cultivation expanding well beyond the periphery of the Corn Belt into regions less biophysically suited to these crops [70, 109]. The strong market and policy signals driving the expansion of corn and soy into poorly suited regions limits farmer capacity to explore more sustainable alternatives [110], or worse, locks farmers into maladaptive systems that buffers them economically from environmental change [31]. Rather than incentivizing systems lock-in with a few crops that will require higher rates of agricultural intervention in the future, we must incentivize and support experimentation with alternative crops [111] and management paradigms. These adaptive transitions will not be without significant economic costs, so federal agricultural policy must shift from incentivizing maladaptive lock-in towards incentivizing experimentation to create new cultivation regimes suited to future biophysical realities [112]. This experimentation will be expensive, time-consuming, and difficult for U.S. farmers who are already reporting, on average, negative net incomes [91]. Therefore, it is imperative federal farm policy devote significant funds to compensating farmers for engaging in the hard work of agricultural transition [112]. The research community must support this shift by examining and elevating barriers and bridges to transition—from reliable access to childcare [113] to psycho-social decision-making processes [114, 115] to racial discrimination [42]; by working to design and promote new climate-smart agricultural practices and technologies; and crucially, by pushing for more adaptive federal policies that support resilience over monoculture [116].
This research highlights the ways in which human activity has altered otherwise unsuitable landscapes for agricultural production. Over the last 20 years, agricultural activity—specifically access to crop insurance and the use of agricultural inputs—has expanded and amplified biophysical suitability. Though climate change will challenge many agricultural communities in the Central and Eastern U.S. by altering the biophysical factors that drive suitability, sustaining historical rates of agricultural activity could help to mitigate projected shifts in biophysical suitability in some regions. For these agricultural interventions to be effective, however, they must mitigate, rather than accelerate, the socio-environmental externalities associated with current production practices. In addition to incentivizing experimentation and supporting sustainable intensification, stakeholder-engaged work is needed to increase our fundamental understanding of how agricultural landscapes emerge and to use this understanding to prepare for the major agricultural transitions anticipated over the next century. Agricultural adaptation to climate change in the Central and Eastern U.S. will be necessary and inevitable. The time to start the transition is now.
Acknowledgments
I thank Dr Chris Lant for the conversations that inspired this paper, Dr Tom Edwards for sharing his modeling insights, and to Drs Matt Yost, Jeremy Cowan, and Debjani Sihi for their soil expertise. Special thanks to Drs Andrea Rissing, Doug Jackson-Smith, and Andrea Basche for crucial conversations about future cropscapes and to Britta Schumacher for her invaluable help constructing the USDA Census data. Finally, many thanks to the teams who built and shared the open-source data used throughout the paper.
Data availability statement
No new data were created or analysed in this study.