

Abstract
The Paris climate goals and the Glasgow Climate Pact require anthropogenic carbon dioxide (CO2) emissions to decline to net zero by mid-century. This will require overcoming carbon lock-in throughout the energy system. Previous studies have focused on 'committed emissions' from capital investments in energy-consuming infrastructure, or potential (committed and uncommitted) emissions from fossil fuel reserves. Here we make the first bottom-up assessment of committed CO2 emissions from fossil fuel-producing infrastructure, defined as existing and under-construction oil and gas fields and coal mines. We use a commercial model of the world's 25 000 oil and gas fields and build a new dataset on coal mines in the nine largest coal-producing countries. Our central estimate of committed emissions is 936 Gt CO2, comprising 47% from coal, 35% from oil and 18% from gas. We find that staying within a 1.5 °C carbon budget (50% probability) implies leaving almost 40% of 'developed reserves' of fossil fuels unextracted. The finding that developed reserves substantially exceed the 1.5 °C carbon budget is robust to a Monte Carlo analysis of reserves data limitations, carbon budget uncertainties and oil prices. This study contributes to growing scholarship on the relevance of fossil fuel supply to climate mitigation. Going beyond recent warnings by the International Energy Agency, our results suggest that staying below 1.5 °C may require governments and companies not only to cease licensing and development of new fields and mines, but also to prematurely decommission a significant portion of those already developed.
Export citation and abstract BibTeX RIS

Original content from this work may be used under the terms of the Creative Commons Attribution 4.0 license. Any further distribution of this work must maintain attribution to the author(s) and the title of the work, journal citation and DOI.
1. Introduction
Various sources of inertia, or carbon lock-in, in energy systems hinder a rapid phase-out of fossil fuels (Unruh 2000, Seto et al 2016). Long-lived capital stocks, such as power plants, factories, buildings and vehicles, will continue to emit CO2 during their expected economic lifetime unless they are retrofitted or decommissioned prematurely (Fisch-Romito et al 2021). Previous studies have calculated the cumulative 'committed emissions' (Davis et al 2010, Davis and Socolow 2014) of capital stocks of energy-consuming infrastructure (Pfeiffer et al 2018, Smith et al 2019, IEA 2020a), with Tong et al (2019) finding that they exceed the remaining 1.5 °C carbon budget.
Committed emissions accounting (Matthews 2014) can also be applied to the capital stock in fossil fuel extraction, but this has not previously been done. Governments and companies are developing new extraction facilities without understanding how much CO2 is committed by those already built and the related implications for the Paris Agreement goals: to pursue efforts to limit the increase in average global temperature to 1.5 °C and to hold it well below 2 °C, compared to pre-industrial levels (UNFCCC 2015).
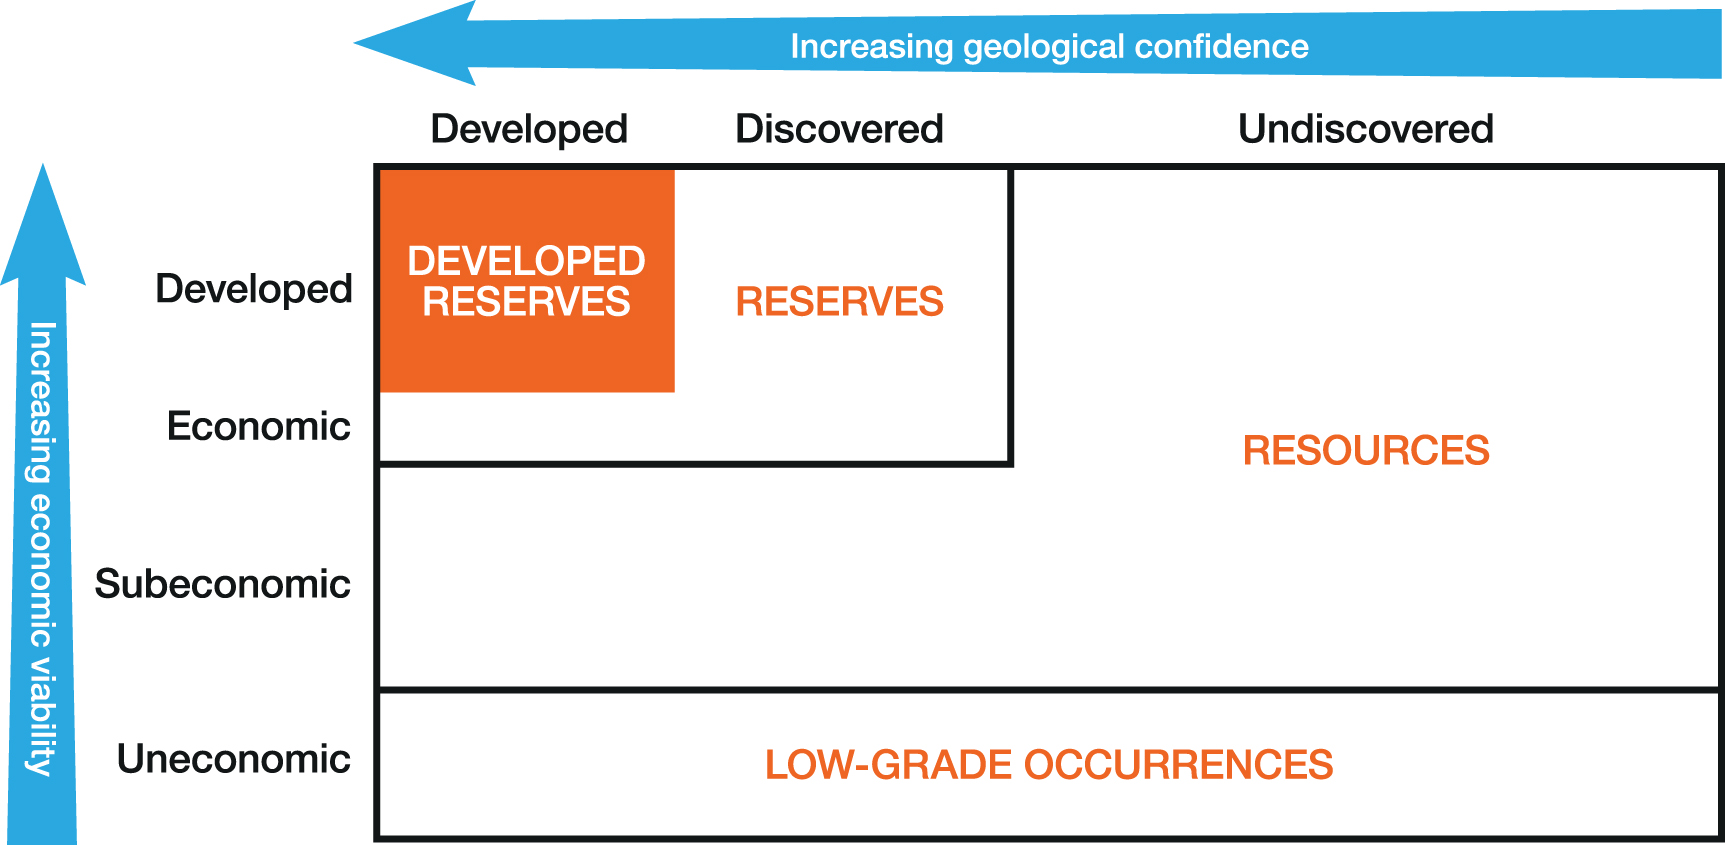
Here we conduct the first assessment of committed emissions from the portion of fossil fuel reserves within actively producing or under-construction oil and gas fields and coal mines, which we call 'developed reserves'. Reserves are the quantity of fossil fuel deposits that have been discovered (geologically assessed) and that can be commercially extracted under anticipated economic conditions (figure 1). While several previous studies have assessed total reserves in relation to carbon budgets (Meinshausen et al 2009, McGlade and Ekins 2015, Welsby et al 2021), no study has yet focused on the subset of reserves that is already developed and, therefore, 'locked-in' by past development decisions (unless those decisions are reversed).
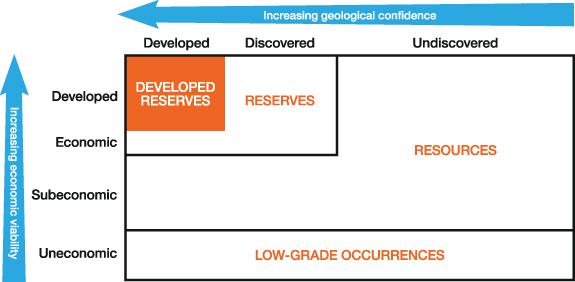
Figure 1. Developed reserves in relation to total reserves and resources. In this analysis, a project-level final investment decision is the threshold for reserves to be developed. Boxes are illustrative and not to an exact scale. Adapted from McKelvey (1972).
Download figure:
Standard image High-resolution imageDeveloped reserves are particularly relevant to climate policy because they reflect the cumulative quantity of oil, gas and coal that companies have already discovered and for which a financial and regulatory commitment to extraction has been made. If cumulative potential CO2 emissions from developed reserves exceed the remaining carbon budgets to limit warming to 1.5 °C or well below 2 °C, this would imply that governments licensing and companies exploring for and developing new fossil fuel reserves is inconsistent with the Paris goals. Furthermore, some existing licences and production, or unabated use, would need to be halted to safely achieve the goals, causing stranded assets. The International Energy Agency (IEA) (IEA 2021) recently elevated the issue of fossil fuel supply in policy debates by finding that new oil and gas fields and coal mines are not needed under its 1.5 °C-aligned 'net zero by 2050' scenario. We interrogate a complementary question: To what extent do existing oil and gas fields and coal mines hold more reserves than we need or can burn under Paris temperature limits?
2. Methods
The most widely used reserves estimates rely on government reporting, which is subject to inconsistent standards and definitions (most importantly regarding economic viability) and to incentives to over-report, as seen with Organisation of the Petroleum Exporting Countries 'political reserves' (McGlade 2012) (supplementary text). We consider only those reserves within projects for which a final investment decision (FID) has been made, which is when the largest portion of capital is committed. This subset of reserves can be consistently defined and evaluated.
We estimate developed reserves as at the start of 2018 (excluding subsequent discoveries or depletion). Our oil and gas estimates reflect the probabilistic mean (expectation) of future extraction from developed projects. This is the amount most likely to be extracted over the projects' lives, when aggregated across all projects. Coal reserves tend not to be considered probabilistically. We estimate proven plus probable coal reserves under the definitions of the Combined Reserves International Reporting Standards Committee (CRIRSCO 2019).
2.1. Oil and gas reserves
To estimate developed oil and gas reserves, we use Rystad Energy's UCube (Rystad 2020), a commercial bottom-up model. The UCube models the investment and operating decisions of 65 000 fields globally (of which around 25 000 are producing or under construction) based on their geology, costs and projected rates of return. Oil and gas prices are exogenous assumptions in the model; our base case uses an oil price projection of USD 60 per barrel (bbl) (supplementary methods 2).
It is commonly observed that bottom-up reserves data provided commercially to the oil and gas industry is more reliable than freely available and widely used sources (Speirs and Sorrell 2009, McGlade 2014), which have been characterised as 'inaccurate, inconsistent, uncertain and/or contested' (Thompson et al 2009) (supplementary text). Rystad's commercial model incorporates a consistent, independent, expert assessment of economic viability (vital to the concept of reserves) and is updated regularly (supplementary methods 2). Other peer-reviewed studies of oil and gas (Erickson et al 2017, Mercure et al 2021) and the IEA (2020b) use Rystad's data and modelling.
We include under-construction conventional oil and gas projects that have received an FID. In contrast, unconventional shale oil and gas production has two main 'commitment' points: to develop an area (installing infrastructure) and to proceed with wells within it. While either approach could be justified, we conservatively count only those shale reserves accessed by already-drilled wells.
2.2. Coal reserves
Since coal reserves data are often of relatively poor quality (Zittel and Schindler 2007), we compile a new dataset for the largest coal-producing countries (Trout et al 2022). Although coal deposits are geologically simpler to estimate than oil and gas, reserves reporting is less regulated.
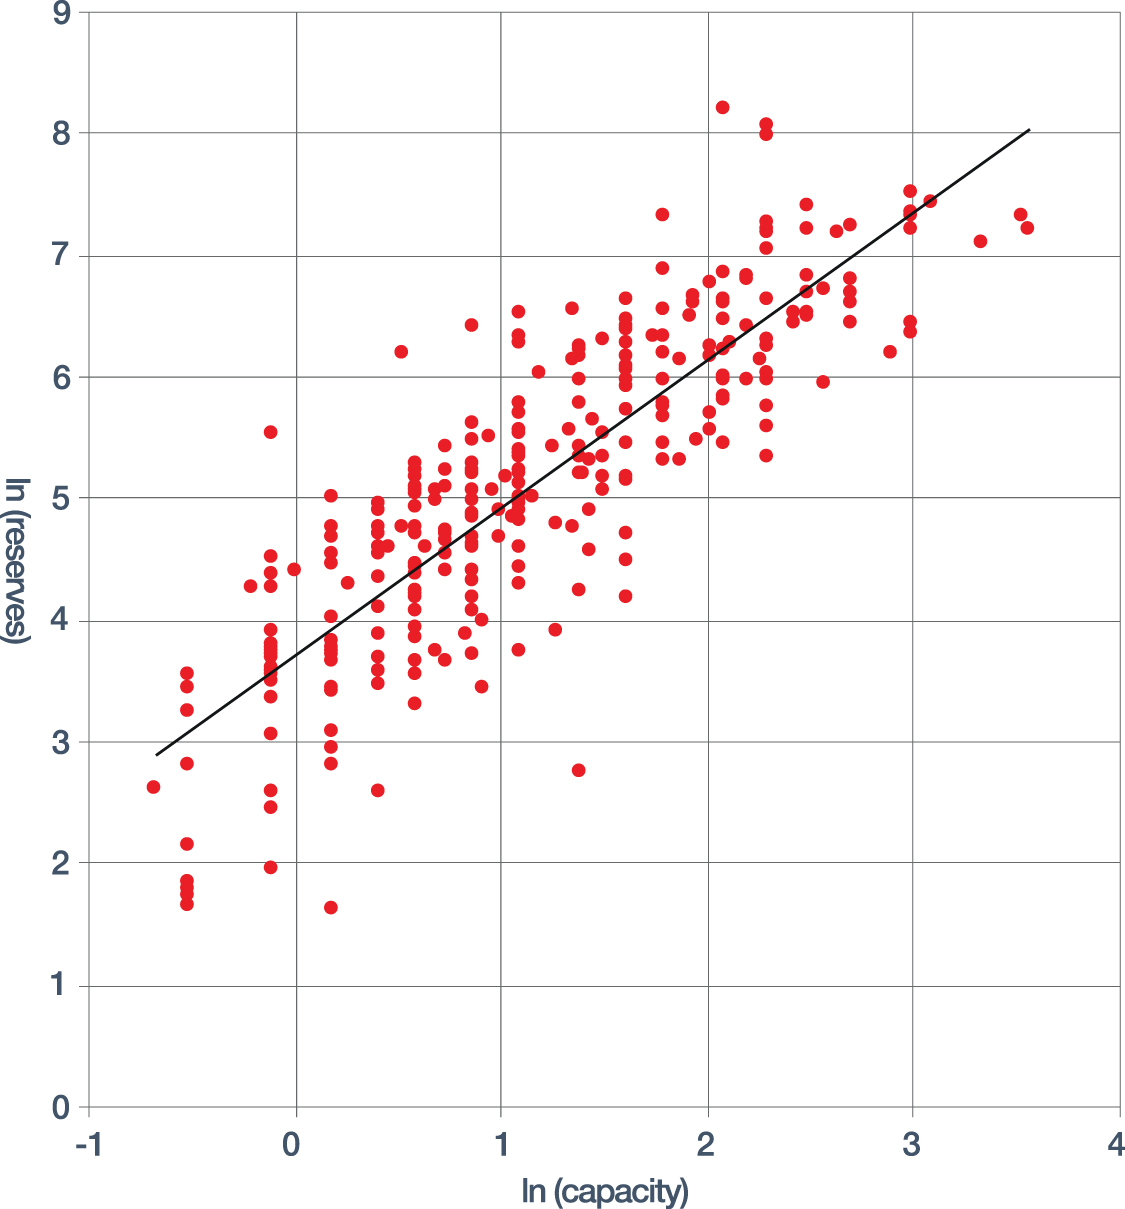
For China, responsible for 45% of global coal production (BGR 2019), we sample close to 300 mines and use a regression analysis to estimate the reserves of the full population of mines (figure 2). For India, the United States, Indonesia, Australia, South Africa and Poland, together representing 37% of global production (BGR 2019), our study collects mine-level data from company financial reporting, government regulatory data and industry data publications (supplementary methods 5). For Russia and Germany (8% of global production), we derive top-down estimates from government and industry sources, respectively (Ministry of Natural Resources and the Environment 2019, DEBRIV 2019). For countries accounting for the remaining 10% of world coal production, we estimate developed reserves as equal to current annual production multiplied by the median ratio of developed reserves to production across our nine studied countries (Mendelevitch 2018).

Figure 2. Relationship between mine capacity and recoverable reserves for 299 sampled Chinese mines. We regress on  , which gives coefficients significant at the 1% level, and R-squared of 0.72. Original capacity is in units of million tonnes per annum (Mt a−1) and reserves in million tonnes (Mt).
Download figure:
Standard image High-resolution imageWhile coal reserves reporting is increasingly being standardised via CRIRSCO, legacy classification systems persist in China, Russia and India, which reflect technical but not necessarily economic extractability (Thomas 2013). For China, we apply an adjustment factor of 0.57 (interquartile range 0.29, 0.83) based on a sample of 30 mines that state reserves under both Chinese and CRIRSCO standards; for Russia we use a defined subset of reserves reported under the Russian system and set wide uncertainty bands; for India, we control reserves estimates against remaining mine life and mine capacity, while setting wide uncertainty bands (supplementary methods 4 and 5).
China: To our knowledge, there is no published dataset nor compiled set of records on all Chinese mines. The National Energy Administration publishes data on the annual production capacity and location of over 3300 operating mines, covering over 90% of national mine operating capacity as of the end of 2017 (supplementary methods 4).
We sample reserves data for 299 mines, covering 42% of China's total operating capacity (Trout et al 2022). For these mines, we directly research recoverable reserves (可采储量), primarily using mine environmental impact assessments, regulatory reports released by the central and provincial governments, and company reports.
We conduct an ordinary least-squares regression of our sample using Long's (2009) generalisation of Taylor's (1977) rule for mine design, relating the scale of the mine (capacity, C) to recoverable reserves (R):  . We rearrange to
  and regress on:
  . The regression (figure 2) gives coefficients with 90% confidence intervals of
  (36.55, 45.26) and
  (1.15, 1.29). We predict recoverable reserves for unsampled mines using
  .
.
2.3. Committed emissions accounting
The purpose of committed CO2 emissions accounting (Davis et al 2010, Davis and Socolow 2014) is to quantify future cumulative emissions implied by existing capital investments at one part of the energy system—in our case, extraction facilities. For fossil fuel-burning infrastructure, key variables are expected operational lifetime and, in the case of power plants, capacity factor (Davis and Socolow 2014, Tong et al 2019). For fossil fuel extraction facilities, the key constraining variable is the volume of reserves that can be economically extracted. If all committed reserves are extracted, the resulting CO2 emissions would be largely unaffected by where or how they are burned (IPCC 2006). The following identity describes our approach to CO2 accounting (specific applications are in supplementary methods 6):
where:
- R = quantity of reserves in physical units (barrels of oil, condensate and natural gas liquids (NGLs), cubic feet of gas, or tonnes of coal).
- h = net calorific value (NCV) of the fuel (terajoules (TJ) per unit of fuel).
- f = default CO2 emissions factor (tCO2 per TJ), derived from carbon content (kgC TJ−1) and assuming 100% oxidation of carbon.
- b = proportion of CO2 emitted to the atmosphere, rather than stored in non-energy uses (%).
2.4. Non-energy use of fuels
A small proportion of extracted fuels is converted into non-energy uses (e.g. plastics and lubricants, fertilisers and carbon fibres). Some uses lead to long-term storage of carbon, whereas others delay the release of carbon into the atmosphere (Marland and Rotty 1984). We use net carbon storage factors calculated by Heede (2014) (8.02% for liquids; 1.86% for gas; 0.016% for coal) to account for this in our results.
2.5. Monte Carlo analysis
For all data listed above, uncertainties are assessed by expert judgment, according to the quality of the sources, and as described in supplementary methods 2, 4 and 5. To calculate the reserves quantities and emissions associated with developed reserves, we perform a Monte Carlo analysis over all the parameters to which we allocate an uncertainty (supplementary methods 6). This includes reserves estimates, oil density, coal rank, and NCV and emissions factors per fuel (figure S3 available online at stacks.iop.org/ERL/17/064010/mmedia), as well as uncertainties specific to our Chinese coal reserves methodology (supplementary methods 4). Each parameter is defined by a lognormal probability distribution function based on a best estimate, a low and high estimate, and the probability range that the high-low range spans.
3. Results
3.1. Global developed fossil fuel reserves
Our central estimate of global developed reserves by fuel, at the start of 2018, is: 870 billion barrels (Gbbl) of oil, 3027 trillion cubic feet (Tcf) of gas, and 220 billion tonnes (Gt) of coal. Using the UCube model, which allows us to apply consistent definitions, our estimate of developed reserves amounts to 66% and 51% of the total reserves of oil and gas, respectively (tables S2 and S3). Well-known sources such as BGR (2019) and BP (2019) give larger estimates of total proven reserves, but also rely on government data that are often politicised and/or use inconsistent definitions for various countries (supplementary text). Welsby et al (2021) provide more technically robust estimates of proven oil and gas reserves, shown in tables S2 and S3, that are close to our estimates of total reserves. Coal reserves are more uncertain, being less regulated. BGR estimates total (developed and undeveloped) coal reserves at five times our developed reserves estimate (table S4).
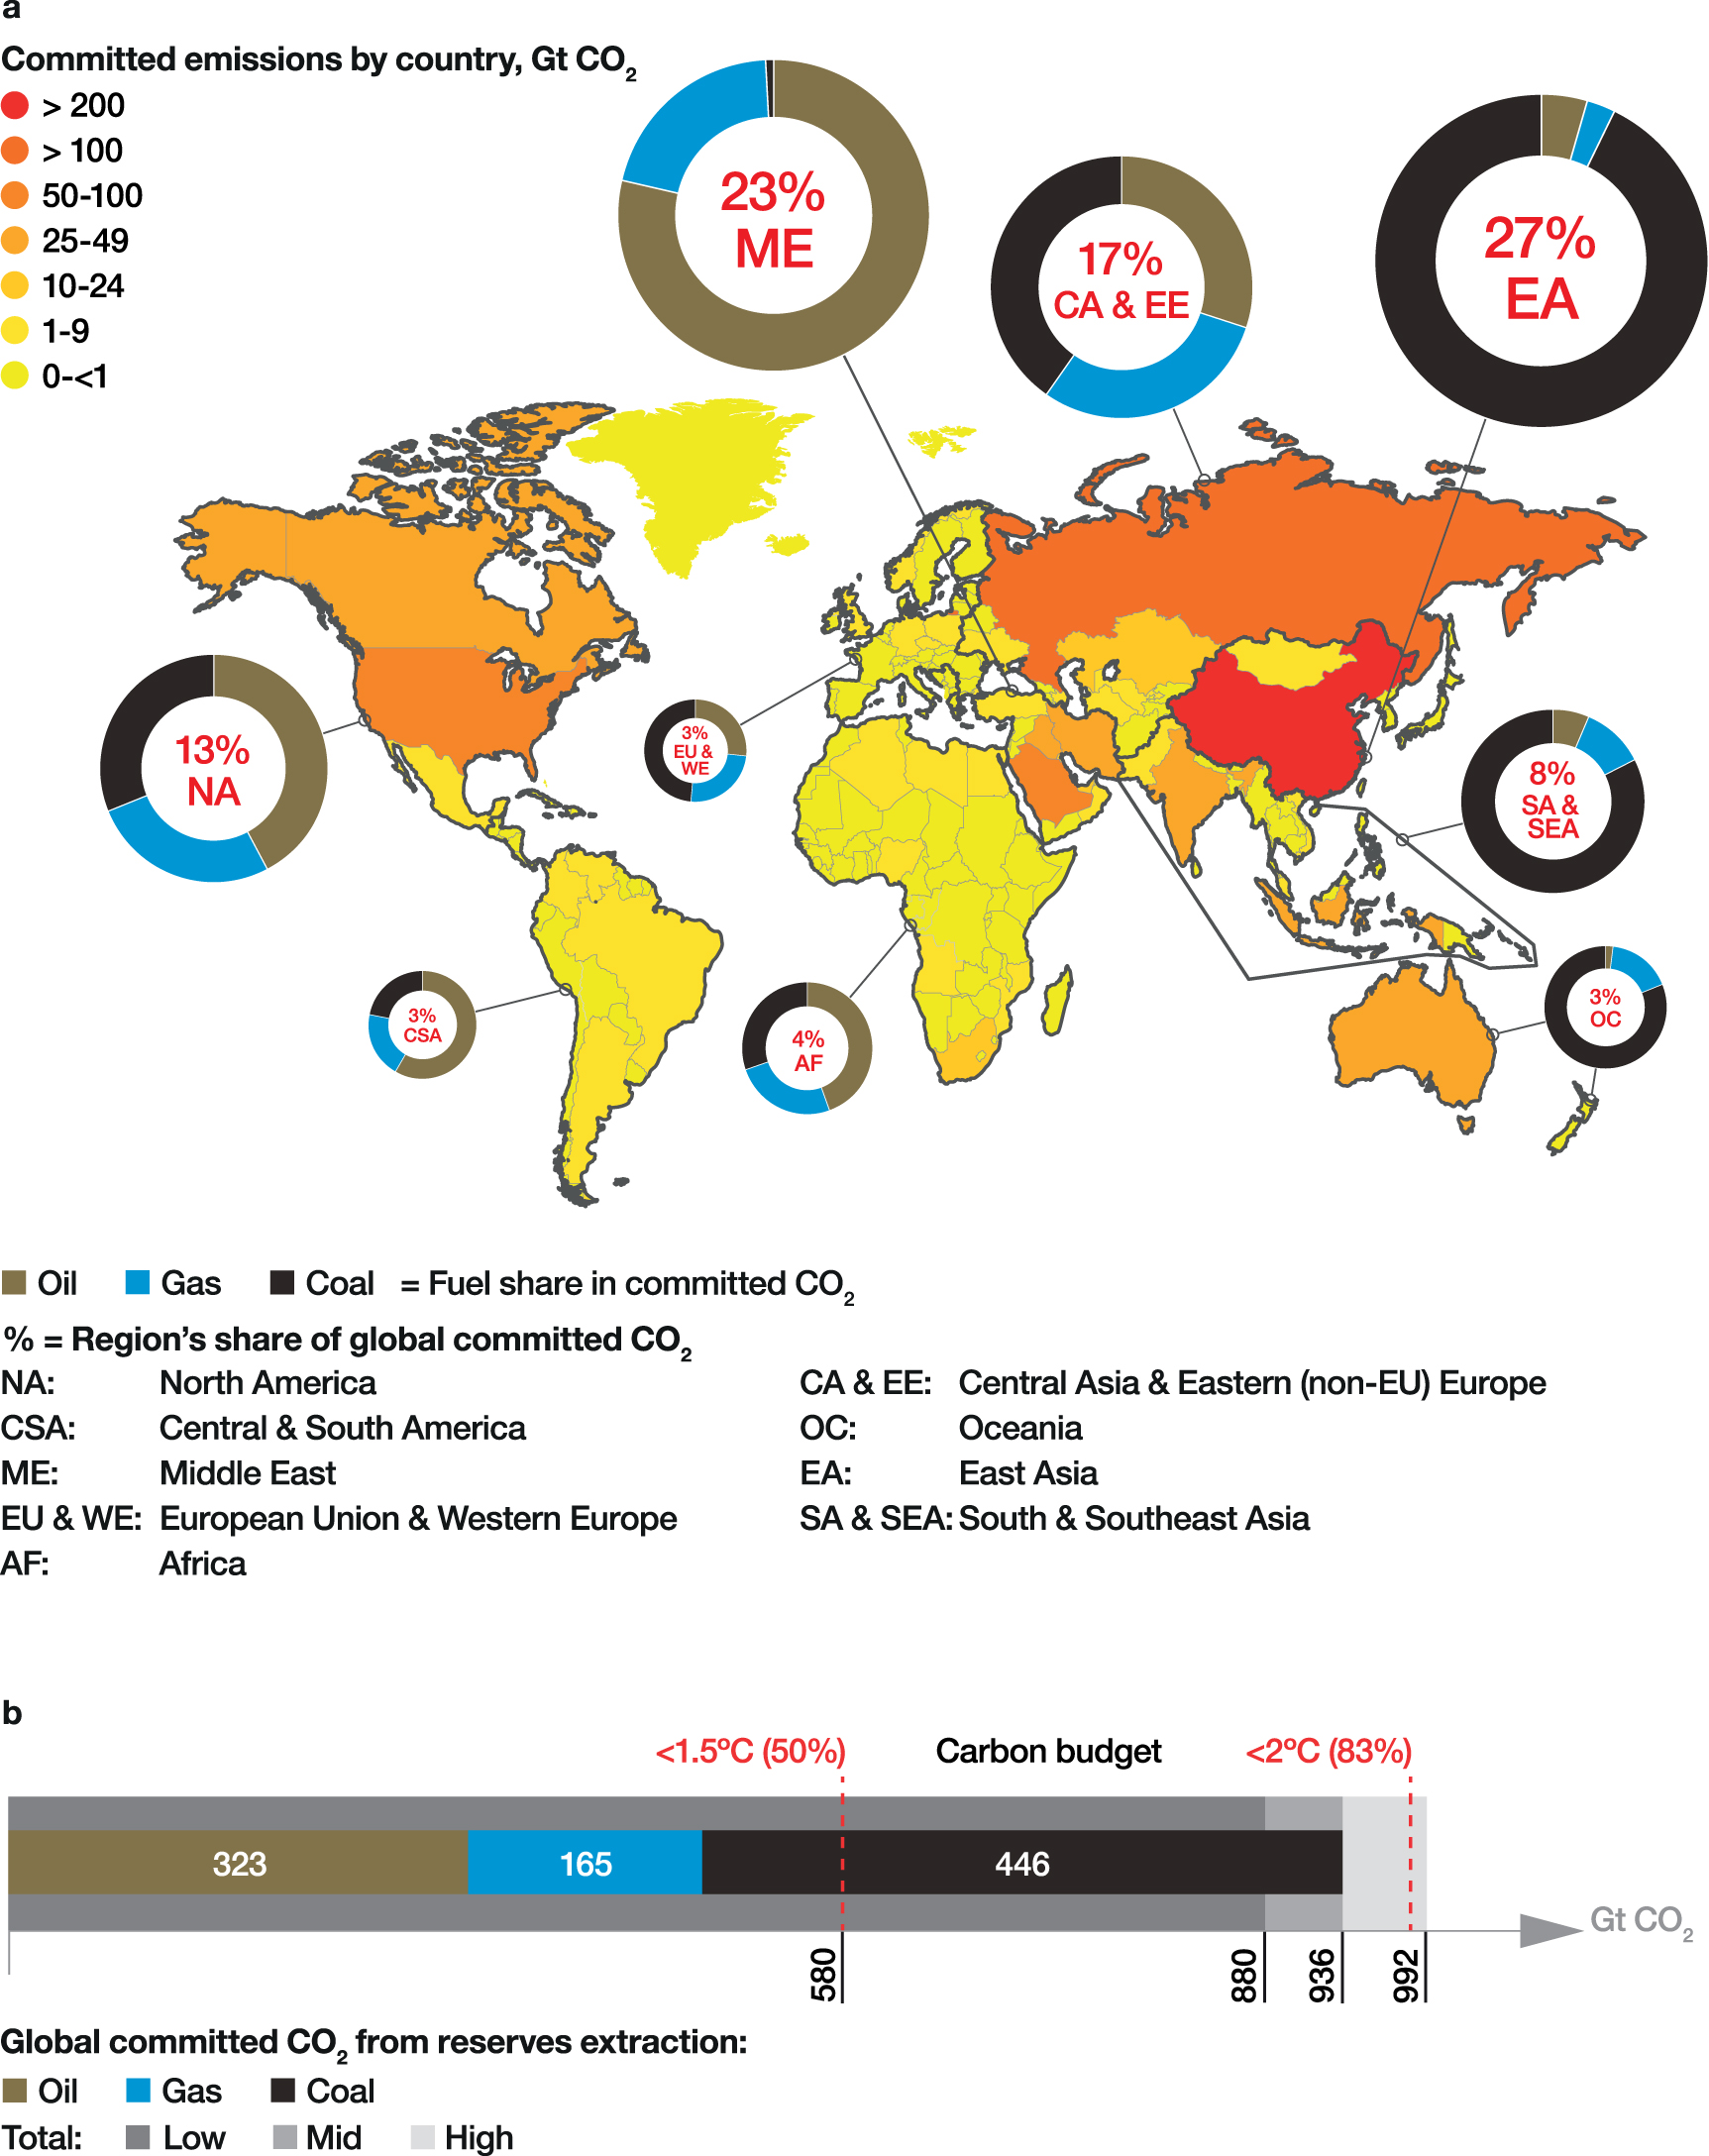
We find that developed reserves are concentrated in China (coal), Russia (oil, gas and coal), Saudi Arabia (oil) and the United States (oil, gas and coal) (figure 3(a); table 1).
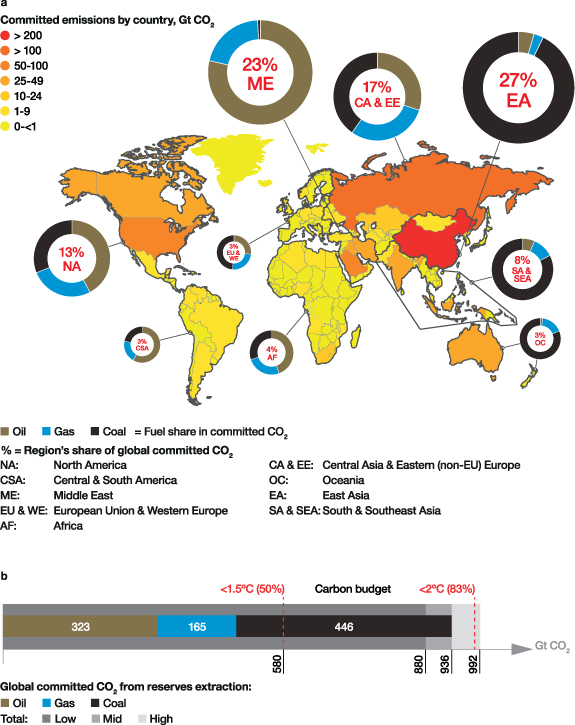
Figure 3. Distribution of committed CO2 emissions from developed fossil fuel reserves. (a) The map indicates shares of global committed CO2 emissions from extraction by region and by country. The % within each circle is the region's share of global committed CO2. Donut charts show the proportion of oil, gas and coal within the region's total committed CO2. The colour of each country corresponds to its concentration of committed CO2, as displayed in the legend. (b) Our estimate of total global committed CO2 by fuel compared to remaining 1.5 °C and 2 °C carbon budgets for given probabilities as of the start of 2018. The low-to-high uncertainty range displayed is the 90% confidence interval. Regions are defined in table S6.
Download figure:
Standard image High-resolution imageTable 1. Developed reserves by country and type, at 1 January 2018, of (a) oil, (b) gas and (c) coal. Reserves estimates of oil in billion barrels (Gbbl) and gas in trillion cubic meters (Tcm) are obtained from the UCube model, as described in supplementary methods 2; coal reserves in billion tonnes (Gt) are from various sources and the authors' own datasets: see supplementary methods 3–5 for detailed methodology by country; these are all entered as inputs to the Monte Carlo simulation. Global results and values shown in exajoules (EJ) and billion tonnes (Gt) of committed CO2 emissions are outputs of the simulation. Oil and gas data are given for the 20 countries with the largest developed reserves. Coal data are given for the nine countries that account for 90% of global coal production.
| (a) Developed oil reserves | ||||||
|---|---|---|---|---|---|---|
| Developed reserves, Gbbl | Developed reserves, EJ | Committed emissions, Gt CO2 (90% confidence interval) | ||||
| Country | Heavy (°API 8–23) | Regular—light (°API 24–45) | Condensate | NGL | ||
| Saudi Arabia | — | 184.6 | 4.0 | 17.1 | 1 151.4 | 76.7 (62.3–92.2) |
| Russia | 3.6 | 82.0 | 7.7 | 6.2 | 555.1 | 37.0 (32.8–41.6) |
| United States | 2.9 | 45.1 | 3.1 | 25.7 | 385.5 | 25.0 (23.3–26.9) |
| Iraq | 0.7 | 61.7 | 0.5 | 0.4 | 368.2 | 24.7 (20.5–28.9) |
| Iran | 1.3 | 36.5 | 11.6 | 5.7 | 324.0 | 21.5 (17.7–25.3) |
| Canada | 41.2 | 5.1 | 0.8 | 4.8 | 319.2 | 21.2 (19.6–22.7) |
| United Arab Emirates | — | 42.2 | 2.6 | 3.5 | 268.2 | 17.8 (15.1–20.7) |
| Kuwait | 1.2 | 40.1 | 0.2 | 1.7 | 247.3 | 16.5 (13.3–19.8) |
| China | 7.9 | 18.6 | 0.3 | 6 | 161.9 | 10.8 (9.7–12.2) |
| Kazakhstan | 0.5 | 16.1 | 1.9 | 0.4 | 103.0 | 6.9 (6.1–7.7) |
| Brazil | 2.1 | 14.7 | 40 | 0.4 | 100.1 | 6.7 (6.0–7.5) |
| Qatar | — | 4.7 | 9.2 | 5.7 | 94.3 | 6.2 (5.7–6.6) |
| Venezuela | 6.6 | 3.4 | 0.1 | 1.1 | 68.2 | 4.5 (4.1–5.1) |
| Libya | — | 10.7 | 0.4 | 0.2 | 62.8 | 4.2 (3.5–5.0) |
| Mexico | 5.8 | 2.5 | 0.1 | 1.5 | 57.7 | 3.8 (3.6–4.1) |
| Norway | 0.4 | 8.2 | 0.2 | 1.3 | 55.6 | 3.7 (3.4–4.1) |
| Nigeria | 0.3 | 8.0 | 1.3 | 0.4 | 56.0 | 3.7 (3.4–4.1) |
| Algeria | — | 6.8 | 1.5 | 2.2 | 53.5 | 3.5 (3.0–4.0) |
| Oman | 2.5 | 3.1 | 1.2 | 0.3 | 41.5 | 2.8 (2.5–3.0) |
| Angola | 0.7 | 4.3 | 0.1 | 0.2 | 30.4 | 2.0 (1.8–2.3) |
| Other | 9.6 | 41.1 | 7.6 | 4.4 | 354.3 | 23.7 |
| World | 869.9 | 4 857.8 | 323.0 (299.7–346.8) | |||
| (b) Developed gas reserves | ||||||
| Country | Developed reserves, Tcm | Developed reserves, EJ | Committed emissions, Gt CO2 (90% confidence interval) | |||
| Russia | 17.7 | 617.4 | 34.3 (28.7–41.0) | |||
| United States | 13.9 | 485.7 | 26.9 (23.6–31.5) | |||
| Iran | 7.9 | 276.1 | 15.4 (11.4–19.5) | |||
| Qatar | 5.7 | 198.6 | 11.0 (9.2–13.1) | |||
| Saudi Arabia | 4.4 | 156.0 | 8.7 (6.9–10.7) | |||
| China | 3.8 | 131.9 | 7.3 (6.8–7.8) | |||
| Turkmenistan | 3.5 | 121.8 | 6.8 (5.4–8.5) | |||
| Australia | 2.7 | 95.5 | 5.3 (4.6–6.1) | |||
| Algeria | 2.2 | 77.8 | 4.3 (3.4–5.3) | |||
| Canada | 2.2 | 75.4 | 4.2 (3.7–4.8) | |||
| Norway | 1.9 | 65.5 | 3.6 (3.2–4.2) | |||
| United Arab Emirates | 1.3 | 43.9 | 2.5 (1.9–3.0) | |||
| Egypt | 1.1 | 37.0 | 2.1 (1.6–2.6) | |||
| Uzbekistan | 1.0 | 36.3 | 2.0 (1.6–2.5) | |||
| Indonesia | 1.0 | 35.7 | 2.0 (1.7–2.4) | |||
| Oman | 1.0 | 33.5 | 1.9 (1.5–2.3) | |||
| Kazakhstan | 0.9 | 32.9 | 1.8 (1.5–2.2) | |||
| Iraq | 0.9 | 32.0 | 1.8 (1.4–2.2) | |||
| Nigeria | 0.9 | 31.1 | 1.7 (1.5–2.0) | |||
| Malaysia | 0.7 | 26.2 | 1.4 (1.2–1.8) | |||
| Other | 10.9 | 383.1 | 21.7 | |||
| World | 85.7 | 2 993.4 | 165.4 (152.4–187.5) | |||
| (c) Developed coal reserves | ||||||
| Developed reserves, Gt | Developed reserves, EJ | Committed emissions, Gt CO2 (90% confidence interval) | ||||
| Country | Coking | Bituminous and anthracite | Sub-bituminous | Lignite | ||
| China | 31.7 | 38.7 | 19.8 | 8.9 | 2 403.8 | 228.0 (188.4–271.9) |
| Russia | 5.6 | 13.8 | — | 4.7 | 578.5 | 54.9 (34.5–66.2) |
| United States | 0.8 | 6.2 | 6.6 | 2.0 | 339.5 | 32.3 (30.1–33.9) |
| India | 1.9 | 3.0 | 13.2 | 1.4 | 329.4 | 31.3 (29.0–33.6) |
| Indonesia | 0.2 | 6.1 | 6.3 | 2.6 | 293.5 | 28.0 (23.1–32.8) |
| Australia | 3.1 | 5.6 | 1.2 | 1.1 | 267.5 | 25.3 (24.0–26.4) |
| South Africa | — | 0.5 | 4.5 | 0.2 | 108.5 | 10.4 (9.4–11.2) |
| Poland | 0.2 | 1.8 | — | 1.0 | 53.4 | 5.1 (4.6–5.4) |
| Germany | — | — | — | 3.7 | 33.0 | 3.3 (2.5–4.1) |
| Other | 19.1 | 292.9 | 27.3 | |||
| World | 220.4 | 4 699.9 | 445.9 (399.3–494.5) | |||
3.2. Committed CO2 from fossil fuel extraction
We find that burning developed reserves of coal, oil and gas would produce 936 Gt CO2, with a 90% confidence interval of 880–992 Gt CO2 (figure 3(b)). This comprises 47% from coal (446 Gt CO2 [399–494]), 35% from oil (323 Gt CO2 [300–347]) and 18% from gas (165 Gt CO2 [152–187]). Ninety percent of these emissions come from just 20 countries (table S1).
We compare these committed CO2 emissions to estimates of the remaining carbon budgets for limiting warming to 1.5 °C (50% probability) and 2 °C (83% probability) above pre-industrial levels, as reported by the Intergovernmental Panel on Climate Change (IPCC) (Canadell et al 2021) and adjusted to their values as at the start of 2018 (using Friedlingstein et al 2019, 2020). We interpret the respective 50% and 83% probabilities as best reflecting the Paris Agreement goals (UNFCCC 2015): to hold global average temperature rise to 'well below' 2 °C while 'pursuing efforts' to limit it to 1.5 °C. Committed emissions from fossil fuel extraction facilities are 60% larger than the remaining 1.5 °C carbon budget (580 Gt CO2) and exhaust 95% of the 2 °C budget (980 Gt CO2).
Developed oil and gas reserves together exhaust more than four fifths of the 1.5 °C budget. The remaining one fifth is equivalent to just 6 years of coal production at present rates. Assuming such rapid closure of coal mines is not feasible, some developed oil and gas reserves, alongside coal, would need to be kept in the ground.
3.3. Uncertainty analysis
There are substantial inherent uncertainties in any reserves estimate in relation to consistency in reporting standards, geological uncertainty and future economic viability (McGlade 2012) (supplementary methods 1). Our estimates of committed emissions are subject to further uncertainty related to reserves' energy and carbon content and net carbon storage in non-energy uses (supplementary methods 2–6).
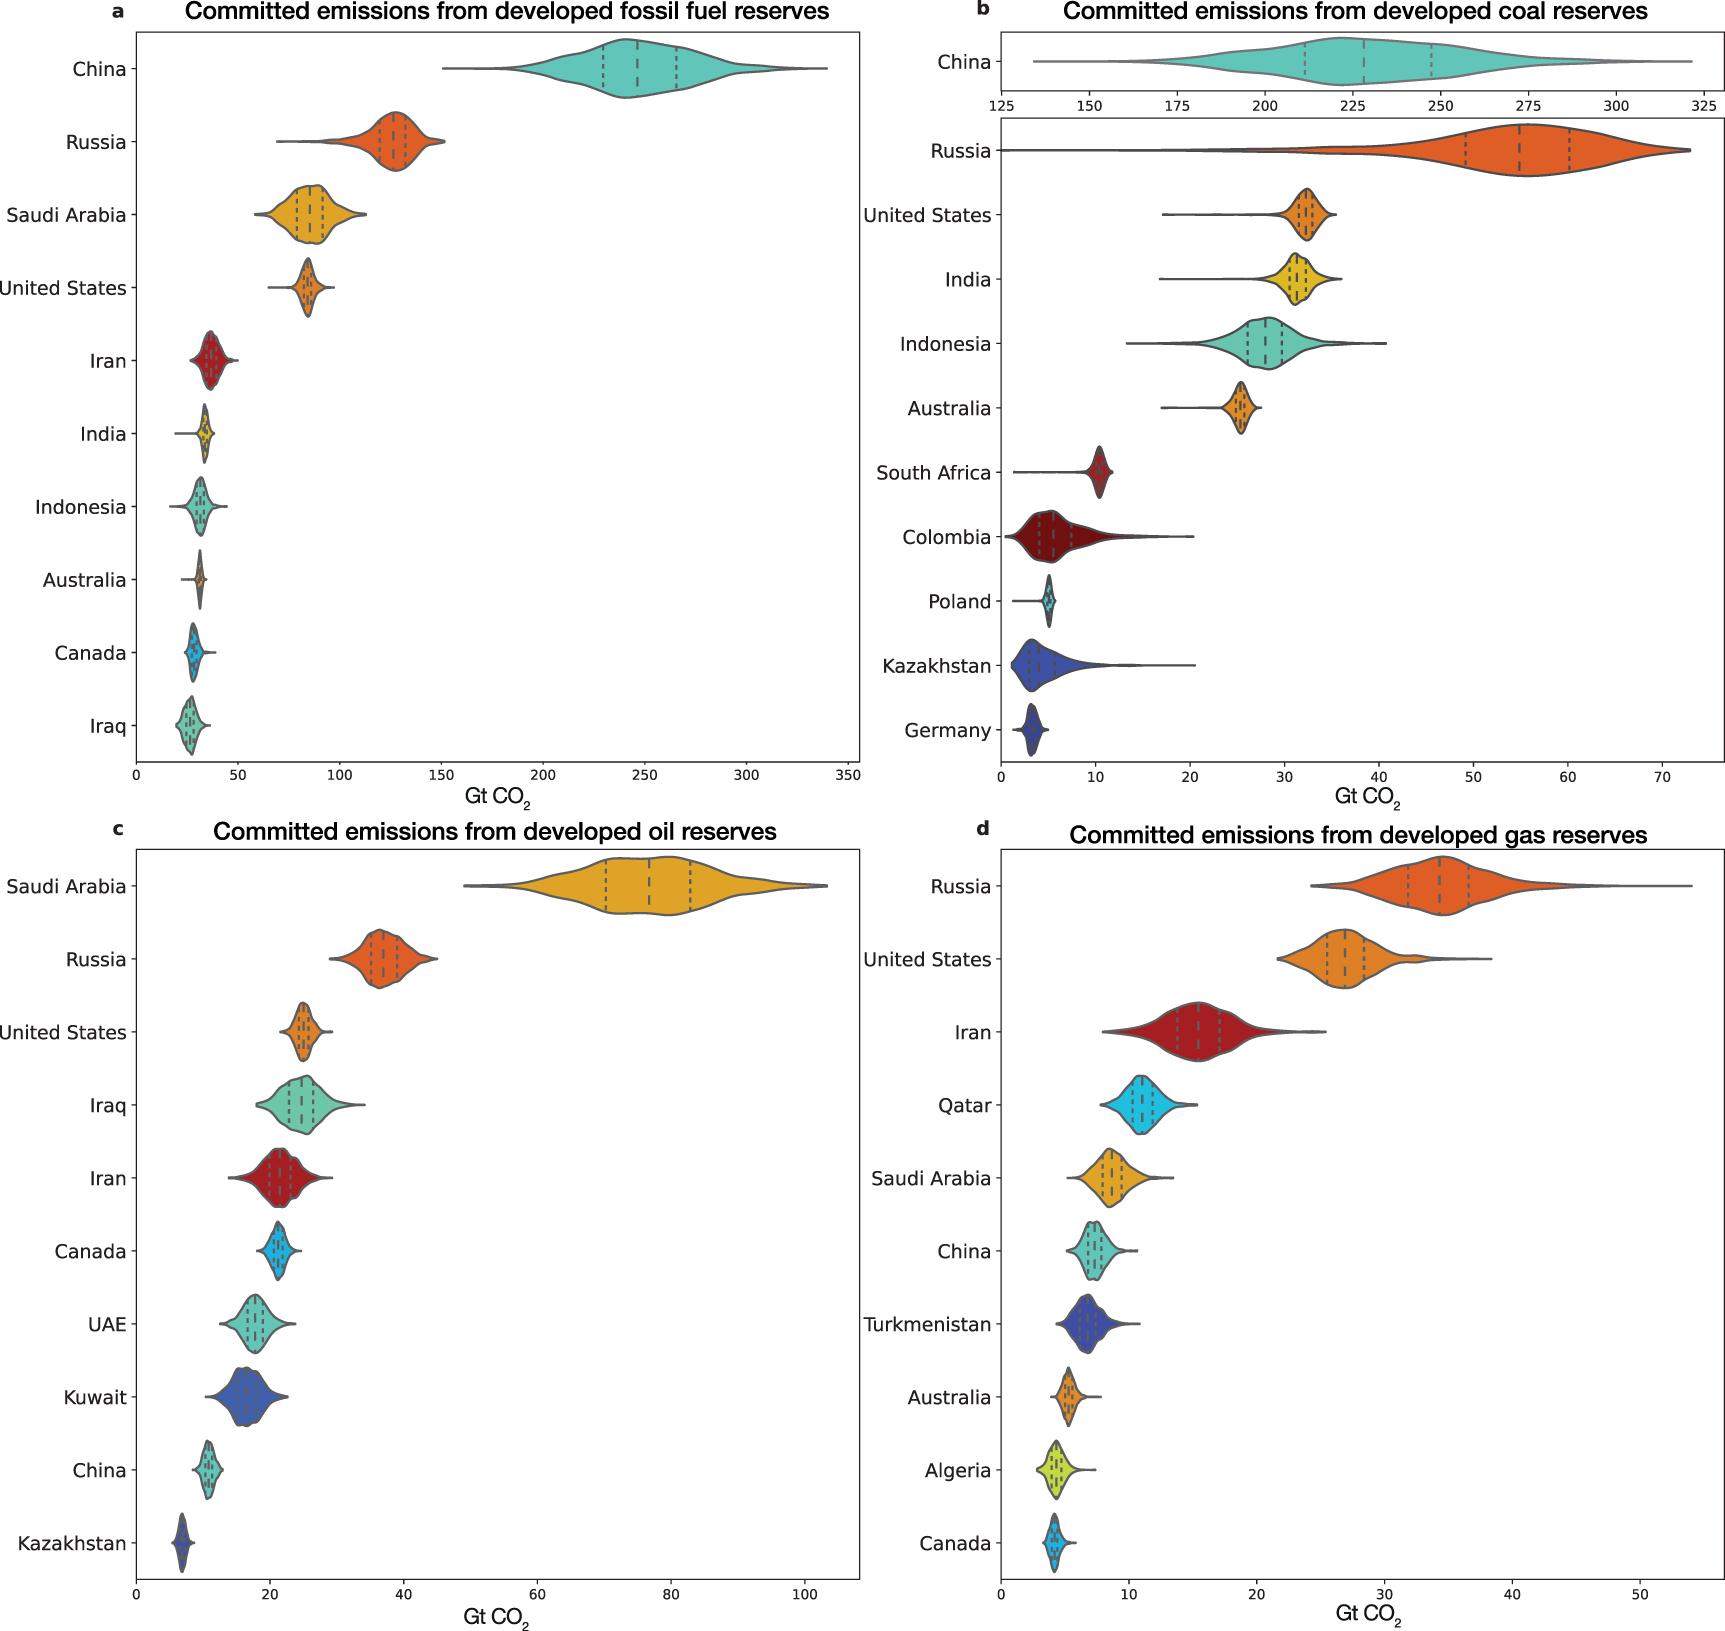
We assess the combined effect of such uncertainties by performing a 1000-run Monte Carlo simulation. Figure 4 displays the probability distribution of committed emissions results by fuel for the most significant countries. Chinese developed coal reserves are the largest single contributor to global committed emissions (228 Gt CO2) and account for the largest uncertainty in our results, with a 90% confidence interval of 188–272 Gt CO2.
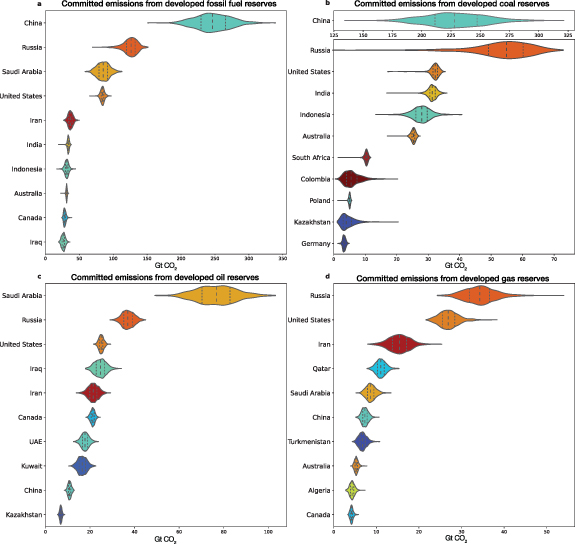
Figure 4. Developed reserves and committed emissions by top countries, using violin plots to show probability distribution. The shape shows the kernel density estimation of the distribution for committed emissions for the given country from the 1000-run Monte Carlo simulation. The width of each shape represents the number of data points in that specific bin reflecting a range on the x-axis. It is widest around the median. The median and the first and third quartiles are shown as dashed vertical lines. The range shown is the total area of the probability density function. The countries shown represent the top ten for each parameter. (a) Committed emissions from developed fossil fuel reserves (coal, oil and gas combined) for countries with largest emissions. Committed emissions from developed reserves by country for: coal (b), oil (c) and gas (d). Figure S3 shows probability distributions for additional parameters.
Download figure:
Standard image High-resolution imageWe do not find significant variation in results beyond 1000 runs, whilst results remain robust when uncertainties in reserves data are doubled: the mean outcome for developed reserves and committed emissions does not change significantly. For countries with more uncertain parameters, reflected in wider probability ranges (e.g. Saudi Arabia, Iran and Iraq), doubling the uncertainty level increases the 90th percentile range for reserves and emissions by more than 25% (supplementary methods 6; figure S4).
Uncertainties may be larger than we capture because we assume they are uncorrelated. Correlations might arise, for example, from systemic biases in project-level reserves estimation by particular companies, or from effects of national regulatory regimes for reporting reserves. Further assessing correlation between errors would enhance this analysis.
There are larger uncertainties in remaining carbon budgets. The IPCC Sixth Assessment Report cites 380–980 Gt CO2 as the 66% confidence interval for staying within 1.5 °C, accounting for uncertainty in the climate response to cumulative CO2 emissions (Canadell et al 2021). Our finding that global committed CO2 from developed reserves exhausts the 1.5 °C budget is robust to that range. The 66% confidence interval for staying within 2 °C is considerably wider, 980–2380 Gt CO2. Given the Paris Agreement commits to staying 'well below' 2 °C, we interpret the budget that provides the highest certainty (83%) of staying below that limit as most consistent with the Agreement's aims.
We do not separately address the impact of methane or other short-lived climate pollutants associated with fossil fuel extraction, processing and transport. However, remaining carbon budgets are sized to account for the projected contribution of methane and other non-CO2 gases to future warming. If methane emissions are not reduced at the rate assumed, then remaining carbon budgets could be smaller (or vice versa), adding further uncertainty (Canadell et al 2021).
This study also does not consider non-energy CO2 emissions from land use and cement manufacturing, which leave less room in remaining carbon budgets for fossil fuels, nor does it factor in carbon dioxide removal (CDR), which could create more room (Rogelj et al 2018). Keeping cumulative fossil fuel-related CO2 emissions well within maximum carbon budgets would be the most precautionary approach to avoid overshoot of either 1.5 °C or 2 °C. Cement process emissions are particularly hard to abate, while cement is a vital construction material (IEA 2020a). Most integrated assessment models assume land-use emissions will be negative by mid-century (Rogelj et al 2018), yet they are still positive and climate change impacts threaten the long-term ability of trees to sequester carbon (Anderegg et al 2020). Technologies to capture and store carbon could reduce the current CO2 emission rate of fossil fuel combustion, but not eliminate it, while CDR technologies carry inherent risks, being unproven at scale (Larkin et al 2018). One reason our study reaches a stronger conclusion than the IEA (2021) finding that no additional fields and mines are needed is that the IEA scenario includes some CDR and significant carbon capture and storage (CCS) of fossil fuel emissions. The IEA acknowledges that CCS availability is one of the greatest uncertainties in its scenario; three decades of efforts to deploy CCS have largely failed (Wang et al 2021).
The UCube model enables us to separately test the sensitivity of developed oil and gas reserves to future price assumptions. Whereas around 80% of global coal production is consumed in the country where it is extracted (BP 2019), and thus sensitive primarily to national market and political conditions, oil and (to some extent) gas are traded on a global market and price can be introduced as a global variable. Our central estimate is based on a long-term Brent oil price of USD 60/bbl ($2020). A high long-term oil price of USD 80/bbl ($2020) increases estimates of commercially viable developed oil and gas reserves by 2%, while a low case of USD 30/bbl $2020) decreases estimates by 22% for oil and 16% for gas (table S5). In the low-oil-price scenario, committed CO2 from oil and gas falls to 390 Gt. But, including coal, committed emissions from developed fields and mines would still exceed the 1.5 °C budget (50%).
4. Discussion
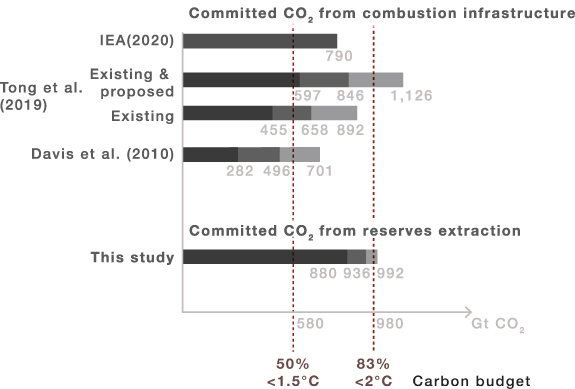
Tong et al (2019) have previously shown that the world has passed a point beyond which any new fossil fuel-burning infrastructure can be built without either exceeding 1.5 °C or forcing early retirement or underutilization of some existing infrastructure. Our study offers insight on the global scale of emissions 'commitment' at the opposite side of the energy system—the fields and mines that supply fossil fuels. Our findings indicate that emissions committed by developed extraction facilities exceed those committed by existing combustion infrastructure (figure 5). In either case, committed emissions are not inevitable (Davis and Sokolow 2014). But avoiding them will require overcoming financial, political and legal inertia created by sunk investments and previous policy decisions.
Figure 5. Estimates of committed CO2 from fossil fuel combustion vs extraction. This study's estimate for cumulative committed CO2 emissions from reserves within existing fossil fuel extraction projects (bottom) in comparison to estimates of committed emissions from combustion infrastructure (top) (Davis et al 2010, Tong et al 2019, IEA 2020a). Carbon budgets, as of the start of 2018, to stay below 1.5 °C or 2 °C are indicated. Uncertainty ranges for studies are shown with shading if available, including the minimum-maximum range for combustion studies and the 90% confidence interval for this study. The total included from IEA (2020a) is estimated based on assuming linear declines between published data points.
Download figure:
Standard image High-resolution image
Based on our median estimate, almost 40% of developed reserves cannot be burned (or must be abated) to stay within the 1.5 °C budget (50%). This goes beyond the IEA (2021) finding that new oil and gas fields are not needed in a 1.5 °C scenario. Our findings suggest that, absent large-scale CDR, a significant portion of existing fields and mines must be decommissioned before their reserves are depleted, stranding not only some of their carbon but also invested capital. The question of which developed coal, oil and gas reserves should be decommissioned and which 'fit' within the 1.5 °C carbon budget is one that goes beyond this study's scope. It requires considerations of equity and of the best mechanisms to manage a just transition away from fossil fuel jobs and revenues within and between countries (Muttitt and Kartha 2020, Pye et al 2020).
By extending the implication of our results to 2 °C scenarios, we also find that the world is very close to a 'point of no return' past which no new fields and mines can be developed without jeopardising the well below 2 °C limit, unless an equivalent or greater amount of carbon already under production is stranded or sequestered (Allen et al 2009).
Our study takes a different approach from that of Welsby et al (2021) and McGlade and Ekins (2015), who consider a broader scope of reserves. They use cost-optimising models to assess what portion of coal, oil and gas reserves—developed and undeveloped—may be unextractable under 1.5 °C or 2 °C carbon budgets. They assume some lower-cost undeveloped reserves displace (or shut in) some higher-cost developed reserves. The novel contribution of our study is to apply the concept of committed emissions to reserves, recognizing that carbon lock-in reduces the price sensitivity of developed reserves (Seto et al 2016).
Conventionally, climate policy addresses demand for fossil fuels (Green and Denniss 2018), which is expected to translate to supply via markets and the price mechanism. Fluctuations in price have a significant influence over FIDs to develop new projects. However, once capital is committed through an FID, companies are incentivised to keep producing to recoup that capital, as long as the prevailing market price exceeds marginal operating costs (Erickson 2015). This form of carbon lock-in accounts for the limited price sensitivity of developed reserves observed in section 3.
The policy implications of committed CO2 emissions from developed reserves exceeding the 1.5 °C carbon budget are twofold: (a) all undeveloped reserves may be considered unextractable; and (b) constraining production of already developed coal, oil and gas reserves within 1.5 °C is likely to require policy interventions beyond price signals.
Continued licensing and development of reserves will either push the world further beyond climate limits (if fully extracted) or increase the scale of stranded assets (i.e. unrecouped capital investment) from early closure of extraction projects (IEA 2021). New development also deepens political entanglement with the fossil fuel industry, increasing the scale of extraction-related jobs and investments governments face pressure to protect, for example, through subsidies to sustain otherwise uneconomic projects (Newell and Johnstone 2018).
The most direct way for governments to prevent additional development of reserves would be to stop issuing new licences or permits for their exploration or extraction. Governments could thereby not only minimise stranded assets but also avoid further entrenching legal and political barriers to mitigation policies. For example, once reserves are licensed to companies, those companies may sue to protect their investments from policy changes under international treaties such as the Energy Charter Treaty (Tienhaara and Downie 2018). It is important to note that the resources contained within already issued licences exceed the reserves that have been discovered, which in turn exceed the developed reserves we examine. Thus, beyond ending new licensing, governments would need to explore legally viable means to terminate existing licences.
While most governments continue to plan on the expansion of fossil fuel production (SEI et al 2021), a small group of governments, including Denmark, Costa Rica, France, Spain, Ireland, and California, have ended licensing and/or set phase-out dates for extraction (Erickson et al 2018, Gaulin and Le Billon 2020), committing to keep some reserves in the ground. Several governments' launch of the Beyond Oil and Gas Alliance (2021) at the COP26 climate summit in Glasgow could encourage more to follow suit. By doing so, governments could mitigate the risks of carbon lock-in, stranded assets and runaway climate change, and better plan for a just transition.
5. Conclusion
This study contributes to growing scholarship on the relevance of fossil fuel supply to climate mitigation (Green and Denniss 2018, Asheim et al 2019, Piggott et al 2020). We find that developed reserves of oil, gas and coal significantly exceed what can be extracted and burned within the 1.5 °C budget, a conclusion that is robust to uncertainties in reserves and carbon budgets. Developing new fields and mines would jeopardise the well below 2 °C limit; nearly 40% of committed emissions from existing reserves must be avoided to stay below 1.5 °C. This implies a policy need not only to end new upstream fossil fuel licensing and development, thereby limiting further carbon lock-in, but also to revoke some existing licences and prematurely close some already producing fields and mines. Given a rapidly closing window to keep warming below 1.5 °C, these findings call for urgent policy attention on managing an orderly and equitable phase-out of fossil fuel extraction.
Acknowledgments
We acknowledge Zebedee Nicholls for his support on coding in python. We thank Nicolai Meinshausen for the approach that we used to estimate skewed distributions. We acknowledge Hermine van Coppenolle's work to assemble our database of Indian coal mines. We thank Global Energy Monitor and various CRIRSCO committee members for technical advice. More scholars and other researchers than we have space to list advised us on country-level reserves, but we would especially like to acknowledge Jianliang Wang, Ivetta Gerasimchuk, Ashish Fernandes, and Steve Bi. We are grateful to Peter Erickson, Sandro Schmidt, and Laurie van der Burg for their reviews of the draft manuscript. David Tong and Bronwen Tucker assisted in copy-editing. Paul Wright designed figures 1–3. Finally, we thank the KR Foundation and BMBF (grant 01LA1811C) for providing funding to support this research.
Data availability statement
Most data that support the findings of this study are openly available. The coal mine reserves data collected for this study, as well as source and output data for the 1000-run Monte Carlo simulation are available at https://doi.org/10.5281/zenodo.5787136 (Datasets 1–4). Restrictions apply to the public availability of the raw oil and gas data generated from the Rystad Energy UCube due to Rystad's contractual terms. See below for code availability to reproduce the Monte Carlo simulation.
The data that support the findings of this study are available upon reasonable request from the authors.
Author contributions
K T and G M conceived of the study and led on initial design as well as data collection. D L designed and conducted the uncertainty analysis, with support from M M. R M advised on and contributed to coal data, methods, analysis, and review. M M advised on carbon budgets and overall study design. T V d G, K T, and G M led writing of the manuscript with contributions from M M, and D L, and with editing from all authors. G M led on supplementary materials. L M collected data on Chinese mines and supported interpretation and analysis of Chinese data.
Code availability
The Jupyter Notebook that runs the Monte Carlo simulation is available in <Committed_Reserves_Monte_Carlo_analysis_DL_v1.2.ipynb>. This calculates fossil fuel reserves and associated emissions using input data and Monte Carlo experiments, and plots intermediate and final manuscript plots. These files are also available at https://doi.org/10.5281/zenodo.5787136.
Conflict of interest
The authors declare no competing interests.