

Abstract
China is the largest producer of synthetic ammonia, accounting for one-third of the world's total production. Ammonia is mainly used to produce fertilizer and is also considered as a potential fuel and new energy carrier for the future. Concomitantly, the ammonia industry is the largest energy consumer and CO2 emitter in China's chemical industry. In this study, we developed the MESSAGEix-ammonia model with detailed process descriptions to evaluate the energy-saving and emission reduction potential that can be generated by energy efficiency (EE) improvement, as well as the transition path and emission characteristics in the context of deep emission reduction. Results show that the cost-effective EE measures implemented under the EE scenario could reduce fresh water, fuel coal, and electricity consumptions by 7%, 25%, and 16%, as well as reduce CO2, PM2.5, SO2, and NOx emissions by 33%, 24%, 24%, and 24%, respectively, by 2060. Regarding the exploration of the deep de-carbonization path, carbon capture and storage technology (CCS) increases the CO2 reduction potential to 62%, but it requires additional electricity. Meanwhile, electrolysis technology not only saves additional fresh water and fuel coal, but also reduces CO2, PM2.5, SO2, and NOx by 80%, 84%, 86%, and 84%, respectively. Furthermore, the integration of electrolysis technology and CCS can bring 98% carbon emission reduction, which is close to net-zero emission status. With the development of renewable electricity, sufficient, clean, and affordable electricity can be provided for electrolysis devices. Our recommendation to policy makers is that electrolysis of water to produce ammonia using renewable electricity is a feasible deep de-carbonization pathway.
Export citation and abstract BibTeX RIS

Original content from this work may be used under the terms of the Creative Commons Attribution 4.0 license. Any further distribution of this work must maintain attribution to the author(s) and the title of the work, journal citation and DOI.
1. Introduction
Ammonia, one of the fundamental products in China's chemical industry, is widely used to produce fertilizers such as urea and ammonium carbonate. To meet the demand for food, the large-scale utilization of fertilizer has promoted the rapid development of China's ammonia industry since the 1950s. China is the largest synthetic ammonia producer, with a total annual production of 57.58 Mt in 2019, accounting for approximately one-third of the world's total production [1]. In addition, ammonia is a potential fuel and prominent energy carrier. The Ammonia Energy Association proposed a new concept of green ammonia in 2017, arguing that a green ammonia energy system could address the limitations of single hydrogen energy in terms of preparation, storage, transportation and release of energy.
Meanwhile, it has become a global consensus that climate change issues should be addressed. In 2020, China's CO2 emissions reached 9.89 billion tons, accounting for 31% of world total, while China's ammonia industry generates 45% of the world's CO2 emissions from the ammonia industry [2]. In addition, ammonia production yields a large amount of air pollutants, including NOx, SO2, and particulate matter.
In 2020, Chinese government stated that China will adopt more vigorous measures to achieve a carbon peak by 2030 and strive to achieve carbon neutrality by 2060. Tsinghua University [3] and Global Energy Interconnection Development and Cooperation Organization in China [4, 5], have also given a general carbon neutral pathway for China. Early Peak Stage (before 2030): 70% reduction in carbon intensity in 2030 compared to that of 2005. Rapid Emission Reduction Stage (2030–2050): 90% reduction in greenhouse gases emissions for the whole society and basic net zero CO2 emissions. Full Neutral Stage (2050–2060): carbon neutral for the whole society with the help of carbon capture and storage (CCS) technology and carbon sink. For ammonia industry, before 2030, lighter feedstock and advanced coal gasification technology will be used to reach carbon peak as early as possible; from 2030 to 2060, electrolysis for ammonia and CCS technology will be used to make carbon emission drop significantly, and the excess carbon emission will be neutralized by carbon sink, CCS and other negative emission technologies. China's ammonia industry plays a vital role in national energy conservation and emission reduction. Notably, the Chinese government has adopted multiple measures to improve the energy efficiency (EE) of ammonia production processes. Between 2008 and 2013, the National Development and Reform Commission in China released a series of National Extension Directory of Key Energy Conservation Technology [6–11], as well as updated Extension Directory from 2014 to 2017 [12–15]. In addition, the Ministry of Industry and Information Technology (MIIT) of China issued a more precisely targeted document in 2012 [16]. The implementation of energy-saving and emission reduction technologies has achieved significant results. The comprehensive energy consumption level of synthetic ammonia decreased from 1587 kgce t−1 (kilograms of standard coal per ton of ammonia) in 2010 to 1453 kgce t−1 in 2018 [17], a reduction of 8.4%. However, there is still a considerable gap between China's energy consumption level and that of the United States (990 kgce t−1). In addition, China's ammonia industry suffers from an uneven production scale and overcapacity. All of these are obstacles that need to be addressed in order to achieve deep emission reduction.
The current research on the ammonia industry is mainly focused on energy consumption, emissions, and costs. Zhu et al calculated the CO2 emissions of six sub-sectors in the chemical industry and came up with the emission reduction potential based on scenario analysis [18]. On this premise, Zhou et al focused on the ammonia industry and used accounting and analysis to estimate the emission reduction potential [19]. In terms of cost, Ma et al constructed an energy conservation supply curve for 26 EE measures to assess their costs and benefits [20]. However, with the goal of deep de-carbonization, it is more important to explore a transition path, in addition to assessing energy savings and emission reduction. It is worth emphasizing that these objectives necessitate higher requirements for both model selection and data accuracy.
Overall, many obstacles, such as plant size, feedstock type, and technical data availability, prevent us from fully exploring the deep de-carbonization path of China's ammonia industry. To address these gaps, we developed a MESSAGEix-ammonia model with detailed process descriptions based on the International Institute for Applied Systems Analysis (IIASA)'s MESSAGEix framework. The model considers feedstock type, plant size, production process, EE technologies, and alternative technologies. On this basis, we can quantify the energy savings and emission reduction yielded by the latest EE measures. More importantly, in the context of carbon neutrality, we attempt to come up with a de-carbonization pathway for the ammonia industry in China.
In this research, we develop the MESSAGEix-ammonia model to evaluate the energy consumption and the CO2 and air pollutant emissions, of China's ammonia industry from 2010 to 2060, as well as explore the de-carbonization development path. The research aims to quantify the potential energy savings and emission reduction effects and provide a de-carbonization transition path to achieve the deep emission reduction targets. We first define the process flow of a typical ammonia plant, and then use a process-oriented approach to identify the characteristics: inputs, outputs, costs, and relevant linkages between the processes. Next, five scenarios are developed to explore potential for energy savings and emission reductions, as well as the associated environmental impact. Finally, policy recommendations for a de-carbonization transition are presented.
2. Overview of China's ammonia industry
China's ammonia plants can be divided into three categories according to the type of feedstock: coal-based ammonia, natural gas-based ammonia, and oil-based ammonia. Given that China's resource endowment is characterized by being rich in coal and being poor in oil and gas, the ammonia production are heavily dependent on coal. Share of ammonia production from different feedstocks in China in recent years are presented (see table 1 of appendix A available online at stacks.iop.org/ERL/17/045029/mmedia). As can be seen, coal-based ammonia production capacity accounts for approximately 75%, while natural gas-based capacity accounts for about 20%. The rest is based on residual oil and coke oven gas. In addition, the scale of China's ammonia plants is unevenly distributed, with a high proportion of small and medium-sized plants and a small proportion of large-sized plants. Together, the feedstock type and plant size lead to high energy consumption and high emissions in the ammonia industry.
The ammonia industry is a major energy consumer, with approximately 3% of the world's energy used to produce ammonia [21]. The key processes of synthetic ammonia can be divided into the following: gas generation, carbon monoxide conversion, gas purification, compression, and synthesis. Among them, the gas-generation process consumes the most energy. As for coal-based ammonia, gas generation consumes 70% of the total energy in production. Therefore, it is necessary to adopt EE measures for specific processes, especially for the high energy-consuming ones.
In recent years, the government has implemented a series of policies that have a significant reduction in energy consumption (see table 2 of appendix A). In 2018, the comprehensive energy consumption was 1453 kgce t−1-ammonia, a decrease of 8.4% compared with that in 2010. There is still a gap compared with the consumption of the US (990 kgce t−1). Note that feedstock has a significant impact on energy consumption, and the unit energy consumption of coal-based ammonia is 30% higher than that of natural gas (40 GJ t−1-ammonia for coal and 29 GJ t−1-ammonia for gas). In 2018, coal and natural gas accounted for 75% and 22% of feedstock in China, respectively, with a comprehensive energy consumption of 42.58 GJ t−1, while in the United States, natural gas accounted for 98% of ammonia production, with a comprehensive energy consumption of 29 GJ t−1 [22]. In addition, based on the categories of feedstocks, the MIIT has announced the energy consumption levels of benchmarking enterprises (see table 3 of appendix A), which have gradually narrowed the gap with the international advanced level.
3. Methods
3.1. MESSAGEix model
The Model for Energy Supply Systems and their General Environmental impact (MESSAGE) developed by the IIASA is a linear/mixed integer optimization model that aims to satisfy a given demand level at least cost. It is a process-based integrated assessment model that allows for a detailed representation of the technical-engineering, socioeconomic, and biophysical processes in energy systems [23]. The model are widely used for medium- and long-term energy planning and policy assessment [24, 25].
Integrated assessment models have been substantially developed, but there are still some barriers to model energy systems, such as interdisciplinary aspects, transparency, scientific standards, and uncertainty [26]. Under IIASA's ix modeling platform (ixmp), a powerful and versatile data warehouse for modeling input, output, and processed results, the MESSAGEix is developed to close these gaps. The MESSAGEix model offers modelers great convenience in terms of data processing, inter-disciplines, and even multi-model coupling. These features are particularly suitable for industrial applications with complex processes. For example, the MESSAGEix-iron and steel [27, 28] and the MESSAGEix-petroleum refining [29], which were built for the steel and petroleum refining industries in China, have a significant effect on assessing the potential for energy savings and emission reductions in these two industries. More information regarding MESSAGEix could be found in the work of Huppmann et al [23] and the MESSAGEix tutorial [30].
3.2. MESSAGEix-ammonia
In the context of deep emission reduction, we developed the MESSAGEix-ammonia model to assess the emission characteristics and deep de-carbonization pathway of China's ammonia industry. MESSAGEix-ammonia can characterize the technical processes in detail, including the cost, energy and feedstock inputs, outputs, and interrelationship across technologies. In addition, the simulation results can clearly explain the mechanism of resource conversion, energy consumption, and greenhouse gas and pollutant emissions. Specifically, the model evaluates the energy-saving and emission reduction potential at the process level and the activity of alternative technologies, after which it gives more accurate policy recommendations. Note that ammonia industry is moving toward electrification and green hydrogen utilization, so the model allows including the potential to accommodate new alternative technologies in the future.
MESSAGEix-ammonia describes the ammonia industry through typical production equipment, associated EE measures, and clean alternative technologies. The main technical parameters include input and output of commodities, cost, and emission factors. In the ammonia industry, the feedstocks (coal and natural gas) undergo a series of physical and chemical changes, including gas generation, shift conversion, gas purification, and ammonia synthesis, until synthetic ammonia is finally produced. The model contains five representative ammonia production processes, a conventional anthracite-based technology (fixed bed intermittent gasification of coal), two new technologies based on bituminous coal (pressurized continuous gasification of coal slurry and pressurized continuous gasification of dry pulverized coal), and the remaining two natural gas-based technologies (pressurized steam reforming of natural gas for large scale and medium/small scale). Figure 1 illustrates a conceptual flow diagram of the model. In addition, tables 1 and 2 of the appendix B show the technical parameters of the five production processes and EE measures.

Figure 1. Conceptual flow diagram of China's ammonia industry.
Download figure:
Standard image High-resolution imageEE is the most available, secure, and affordable energy resource [31]. In order to evaluate the effect of EE improvement in the ammonia industry, the addon function was introduced to link the process technologies with their associated EE measures, and more details are in appendix Model: Relationship between process technologies and EE measures.
3.3. Scenario definition
3.3.1. Projection for ammonia up to 2060
In China, where agricultural development occupies a fundamental position, 90% of synthetic ammonia is used to produce fertilizers, while the industrial sector consumes only about 10%. Figure 2 shows the historical production and future demand for ammonia in China from 2010 to 2060. Based on the forecasts of relevant international organizations [1, 32], ammonia will grow at an average annual rate of 1.2% from 2020 to 2025 due to strong urea demand. After 2025, the growth rate will gradually decrease and remain at around 0.7% from 2030 to 2040. Thereafter, ammonia production will remain at around 70 Mt from 2045 to 2060.
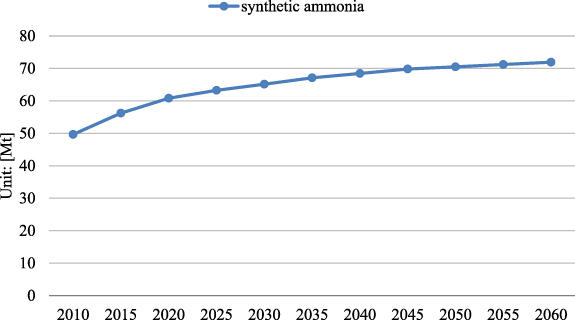
Figure 2. Synthetic ammonia production and demand from 2010 to 2060.
Download figure:
Standard image High-resolution image3.3.2. Scenario definitions
In this research, the simulation period is from 2010 to 2060 in five-year steps, and five scenarios are built and discussed: baseline (BL), energy efficiency (EE), energy efficiency and carbon capture and storage (EE_CCS), energy efficiency and ammonia by electrolysis (EE_ELE), as well as net zero emission (NZE) scenario The BL scenario represents the future development without additional policies in the ammonia industry. The EE scenario assumes that stricter environmental policies promote the rapid implementation of EE measures. In addition, considering the decreasing costs of wind power and photovoltaic in the future [33], renewable electricity will be introduced into the model as purchased energy source (see table 4 in appendix A). Deep emission reduction has become a goal for Chinese industries. Thus, two targeted scenarios (EE_CCS and EE_ELE) were constructed based on recent studies [3–5]. Furthermore, the NZE scenario is designed to explore NZEs.
In the EE_CCS scenario, CCS technology is introduced to achieve deep de-carbonization, in addition to adopting cost-effective EE measures. In the context of deep emission reduction, electrification and clean-up are the future trends of the chemical industry. Therefore, we introduce electrolysis for ammonia production in the EE_ELE scenario to explore the emission reduction effect of electrification. To achieve NZEs, both electrolysis and CCS technologies are used in the NZE scenario. The detailed assumptions and parameter settings are shown in table 4 of appendix A.
In this study, the data for historical production and future demand of synthetic ammonia, technical parameters, emission factors, and cost are considered in the scenario analysis, and the source of all used data can be found in appendix Model: data source.
4. Results and discussion
4.1. CO2 and air pollutant emissions
4.1.1. Total CO2 emissions
CO2 emissions in the ammonia industry can be divided into three categories: direct emissions (fuel coal combustion), indirect emissions (purchased electricity), and process emissions. The errors of the simulation emissions are less than 5% for both 2010 and 2015 compared with the actual data [34, 35].
Figure 3 presents the total CO2 emissions and their sources under five scenarios. Under the BL scenario, CO2 will increase from 212 Mt in 2010 to 325 Mt in 2060, with an average annual growth rate of 1.1%. Adopting EE measures in the EE scenario could reduce CO2 emissions by up to 33% in 2060. Then, based on the EE scenario, CCS technology is applied to the three coal-based ammonia processes, which can achieve a maximum emission reduction potential of 62% by 2060. In addition, to meet the deep emission reduction target, we will introduce a cleaner electrolysis-based ammonia process to gradually replace the coal-based ammonia process on the basis of EE scenario, which could reduce CO2 emissions by 80% in 2060. Further, the simultaneous adoption of CCS and electrolysis-based ammonia technologies can reduce carbon emissions by 98%, reaching a state of NZEs.

Figure 3. Total CO2 emissions under different scenarios.
Download figure:
Standard image High-resolution imageFigure 4 shows the sources of CO2 emissions under the BL scenario. We can deduce that the proportion of different CO2 emission sources will not change substantially from 2010 to 2060 without the enactment of additional measures and policies. Emissions from production processes, purchased electricity, and fuel coal account for 52%, 28%, and 20%, respectively.
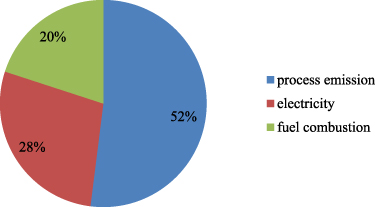
Figure 4. Emission sources in the BL scenario.
Download figure:
Standard image High-resolution image4.1.2. Sources of CO2 emission reduction
Figure 5 shows the sources and contributions of CO2 emission reduction under four scenarios. In the EE scenario (see figure 5(a)), EE measures reduce the consumption of fuel coal and electricity, which, in turn, reduces CO2 emissions from these two energy sources. Electricity accounts for an increasing proportion of CO2 emission reduction contributions. This indicates that the application of EE measures has a significant effect on reducing CO2 emission from electricity. The maximum abatement potential in 2060 is 106 Mt. Under the EE_CCS scenario (see figure 5(b)), the adoption of CCS can bring about a maximum emission reduction of 202 Mt. By 2060, the share of emission reductions contributed by production processes will rise to 33%, with 45% and 22% from electricity and fuel coal, respectively. As for the EE_ELE scenario (see figure 5(c)), the maximum emission reduction in 2060 is 261 Mt, of which 39%, 38%, and 23% are from processes, electricity, and fuel coal emission reductions, respectively. The electrolysis ammonia technology will replace part of the coal-based ammonia technology, thereby reducing the process emissions, as well as a portion of fuel coal and electricity emissions. Under the NZE scenario (see figure 5(d)), the maximum emission reduction in 2060 is 320 Mt, which is close to NZEs.

Download figure:
Standard image High-resolution image
Figure 5. Sources and contributions of CO2 emission reduction.
Download figure:
Standard image High-resolution image4.1.3. Air pollutant emissions
Figure 6 shows the air pollutant emissions under the five scenarios. In the EE, EE_CCS, EE_ELE, and NZE scenarios, the maximum emission reductions of air pollutants are 147 kt, 135 kt, 518 kt, and 320 kt, respectively, which are reduced by 24%, 22%, 85%, and 53%, respectively, compared with the BL scenario. The emission of air pollutants (PM2.5, SO2, NOx ) comes from fuel coal combustion and purchased electricity. Both EE measures and electrolytic ammonia technologies reduce pollutant emissions by reducing the consumption of fuel coal and electricity.

Figure 6. Air pollutant emissions in different scenarios.
Download figure:
Standard image High-resolution imageFor PM2.5, the maximum emission reduction potentials under four scenarios are 6 kt, 5 kt, 20 kt, and 13 kt. In the BL scenario, fuel coal accounts for 78%–85% and electricity accounts for 15%–22% from 2010 to 2060. SO2 emissions are relatively large, with the largest reduction potential being 106 kt, 99 kt, 370 kt, and 226 kt under the EE, EE_CCS, EE_ELE and NZE scenario. Similar to PM2.5, fuel coal contributes the majority of SO2 emissions in the BL scenario, accounting for 88%–92%, and electricity accounts for 8%–12%. In addition, the maximum emission reductions of NOx are 36 kt, 31 kt, 128 kt, and 82 kt, with fuel coal accounting for 74%–82%, electricity accounting for 18%–26%.
4.2. Material consumption
4.2.1. Feedstock consumption
Figure 7 shows the feedstock consumption of China's ammonia industry under the BL, EE, and EE_CCS scenarios. In this study, based on the actual situation, coal and natural gas are defined as the feedstock part and the fuel part, which are independent and have different conversion efficiencies. When used as feedstock, their consumption depends on the capacity shares of different process technologies in ammonia production, and in table 3 of appendix B, the shares are assumed to be the same for the three scenarios and therefore the results are consistent. The errors in the model results are less than 5% for both 2010 and 2015 compared with the actual data [36]. During the simulation period, the share of feedstock consumed ranged from 76% to 85% for coal and 24% to 15% for natural gas. These proportions are consistent with reality. The detailed information is presented in table 3 of appendix B. Evidently, the model results are validated by real circumstances.
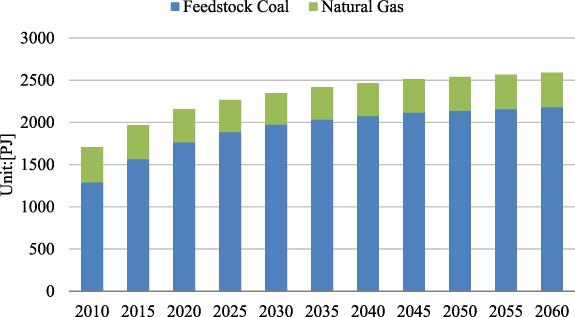
Figure 7. Consumption of feedstock coal and natural gas from 2010 to 2060.
Download figure:
Standard image High-resolution imageUnder the three scenarios coal consumption grows rapidly until 2030 from 44 Mtce (equal to 1290 PJ) in 2010 to 64 Mtce (equal to 1885 PJ) in 2025, with an average annual growth rate of 3%. The growth rate slows down from 2030, with coal consumption reaching 74 Mtce (equal to 2180 PJ) by 2060. During the simulation period, the consumption of natural gas varied minimally, remaining at 11 265 million Nm3 (equal to 400 PJ). Please note that the EE_ELE and NZE scenario is not included in this analysis as it introduces a new process (electrolysis of water for ammonia production) that results in the partial replacement of coal by fresh water as feedstock.
4.2.2. Water consumption
Figure 8 shows the consumption of water resources from 2010 to 2060. In the BL, EE, and EE_CCS scenarios, water is mainly used in the gas generation process to produce hydrogen with carbon (from coal) and methane (from natural gas), which is a chemical reaction. In the EE_ELE and NZE scenario, in addition to the chemical reaction mentioned, part of the water is also used as feedstock to produce hydrogen directly through electrolysis.

Figure 8. Fresh water consumption under different scenarios.
Download figure:
Standard image High-resolution imageUnder the EE scenario, fresh water consumption continues to decrease from 2010 to 2060 due to the adoption of EE measures. In 2060, fresh water will reduce by 7% compared with the BL scenario, which is approximately 87.77 million m3. The consumption remains the same under the EE and EE_CCS scenarios, as the adoption of CCS technology does not affect the water savings brought about by EE measures. In the EE_ELE scenario, fresh water consumption shows a significant decrease from 2035 to 2060, with a maximum savings of 53% in 2060. According to the scenario assumptions in table 3 of appendix B, electrolysis technology is introduced to produce ammonia in 2035, replacing part of the coal-based ammonia technology. The water consumption per unit of ammonia produced by electrolysis technology is lower than that of coal-based ammonia technology (see table 1 of appendix B), so the water savings increase with the adoption of electrolysis technology. In 2060, the capacity shares of coal-based ammonia, electrolysis-based ammonia, and natural gas-based ammonia are 0.34, 0.51, and 0.15, respectively. For the same reason, under the NZE scenario, 56% of water is saved in 2060, with the share of electrolysis-based ammonia further expanding.
4.3. Energy consumption
4.3.1. Total final energy consumption
Figure 9 shows the trend of total energy consumption (coal fuel and electricity) in the ammonia industry. Driven by demand for ammonia products, energy consumption under the BL scenario will continue to increase during the study period. In the EE scenario, applying EE measures brings about a significant effect, and energy savings increase to 23% by 2060. In 2035, energy consumption in the EE_CCS EE_ELE, and NZE scenarios starts to be higher than that in EE. The reason is that based on the EE scenario, the CCS and electrolysis technologies implemented in the three scenarios cause an increase in electricity consumption. The difference is that CCS technology causes an increase in electricity consumption without affecting fuel coal consumption, while electrolysis technology causes a decrease in fuel coal consumption and an increase in electricity consumption. As can be seen in figure 9, the energy consumption in the EE_CCS scenario is reduced by 19% in 2060 compared with the BL scenario. By contrast, the amount of energy consumed in the EE_ELE and NZE scenarios is much higher than that in the BL scenario.
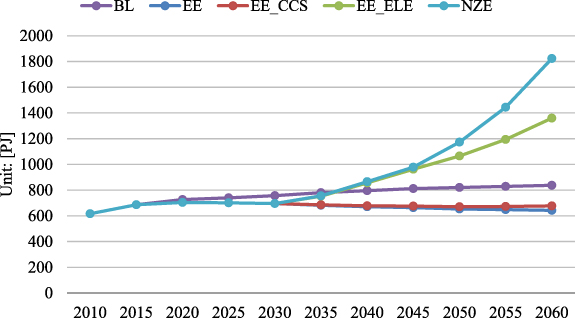
Figure 9. Total final energy consumption in the different scenarios.
Download figure:
Standard image High-resolution imageFigure 10 shows the proportion of various types of energy in the total energy consumption. In 2010, the fuel coal consumption under the five scenarios accounted for 69% of the total energy consumption. By 2060, this proportion will increase to 78% in BL, 76% in EE, and 72% in EE_CCS, while the proportions in EE_ELE and NZE are reduced to 6% and 18%. This indicates that the share of fuel coal remains high in the BL scenario without any measures imposed. After adopting measures, the proportion of fuel coal in EE and EE_CCS decreases. In the EE_ELE and NZE scenarios, electrolysis technology replaces part of the coal-based ammonia technology, leading to a decrease in fuel coal consumption and a significant increase in electricity consumption.

Figure 10. Proportion of energy consumption by types in the different scenarios.
Download figure:
Standard image High-resolution image4.3.2. Potential for energy savings up to 2060
Figure 11 shows the total energy-saving potential of the two energy materials and their contribution under two scenarios. In the EE scenario, the savings increase from 22.26 PJ in 2020–194.83 PJ in 2060, with a maximum energy-saving potential of 23% compared with BL. Meanwhile, the maximum energy-saving potential under the EE_CCS scenario is 19%, or about 160.4 PJ (see figure 11(a)).

Figure 11. Energy-saving potential for two energy materials in the EE and EE_CCS scenarios.
Download figure:
Standard image High-resolution imageRegarding the energy-saving contribution (see figure 11(b)), in the EE scenario, the ratio of fuel coal to electricity remains constant. Specifically, fuel coal and electricity contribute 84% and 16% of the energy savings from 2020 to 2060, respectively. Under the EE_CCS scenario, the contribution of electricity to energy savings continues to decrease due to additional electricity consumption brought about by the application of CCS technology. Furthermore, the electricity savings is −5 PJ in 2060, which means that electricity consumption exceeds that in the BL scenario.
4.4. Cost analysis
Figure 12 shows the total annual cost from 2010 to 2060 for the five scenarios. In the EE_CCS, EE_ELE, and NZE scenarios, the total cost increases significantly from 2035 due to the adoption of CCS technology and electrolysis technology, respectively. By 2060, the total cost under the EE_CCS scenario increases by 0.2 billion compared to that under the BL scenario (47.3 billion), resulting in 62% CO2 emission reductions. In contrast, the total cost under the EE_ELE scenario is 63.5 billion, about 34% higher than that of the BL scenario, bringing an 80% CO2 emission reduction potential. As for the NZE scenario, the total cost is around 40% higher than that in the BL, resulting in a 98% emission reduction. Deep de-carbonization requires higher costs, especially with more advanced and cleaner technologies.

Figure 12. Total cost under the five scenarios.
Download figure:
Standard image High-resolution image
4.5. Summary
In this research, we evaluate the energy-saving and emission reduction potential of the ammonia industry. As shown in table 1, in 2060, total energy consumption will decrease by 23% and 19% under the EE and EE_CCS scenarios, respectively. However, the total energy consumption in the EE_ELE and NZE scenarios exceeds that of the BL scenario. Specifically, using only EE measures, the maximum savings potential for fresh water, fuel coal, and electricity are 7%, 25%, and 16%, respectively. Then, application of CCS technology has no additional impact on fresh water and fuel coal, but increases electricity consumption. This results in negative electricity savings. Further, we introduce the electrolytic ammonia process to replace some of the coal-based ammonia technologies. This can save 53% of fresh water and 87% of fuel coal. However, this process requires a large amount of electricity and does not have a positive effect on electricity savings. Finally, the integration of CCS and electrolysis-based ammonia technology can save 56% of fresh water and 48% of fuel coal.
Table 1. Maximum savings potential for material and energy.
| Maximum savings (%) | Fresh water | Fuel coal | Electricity | Total energy |
|---|---|---|---|---|
| EE (compared with BL) | 7% | 25% | 16% | 23% |
| EE_CCS (compared with BL) | 7% | 25% | — | 19% |
| EE_ELE (compared with BL) | 53% | 87% | — | — |
| NZE (compared with BL) | 56% | 48% | — | — |
Emission sources have a significant impact on their reduction potential. Table 2 presents the top three sources of various emissions under the BL scenario and table 3 shows the maximum reduction potential in 2060. Under the EE_ELE scenario, cleaner electrolysis-based ammonia technology could generate up to 84% of PM2.5, 86% of SO2, and 84% of NOx emission reduction potential. Most of the emissions of these three air pollutants come from fuel coal, thus, the high share of coal-based ammonia capacity under the NZE scenario naturally brings more air pollutant emissions than that in the EE_ELE scenario. CO2 emissions will reduce by 33% in the EE scenario, by 62% in the EE_CCS scenario, by 80% in the EE_ELE and by 98% in the NZE scenario. EE measures reduce CO2 emissions by saving energy consumption (fuel coal and electricity), while CCS technology and electrolysis-based ammonia technology can reduce emissions from all sources.
Table 2. Sources of various emissions from 2010 to 2060 in the BL scenario.
| Ranking | CO2 | PM2.5 | SO2 | NOx |
|---|---|---|---|---|
| 1 | Process emission (52%) | Fuel coal (78%–85%) | Fuel coal (88%–92%) | Fuel coal (74%–82%) |
| 2 | Electricity (28%) | Electricity (15%–22%) | Electricity (8%–12%) | Electricity (18%–26%) |
| 3 | Fuel coal (20%) |
Table 3. Maximum reduction potential of various emissions.
| Maximum reduction (%) | CO2 | PM2.5 | SO2 | NOx |
|---|---|---|---|---|
| EE (compared with BL) | 33% | 24% | 24% | 24% |
| EE_CCS (compared with BL) | 62% | 21% | 23% | 20% |
| EE_ELE (compared with BL) | 80% | 84% | 86% | 84% |
| NZE (compared with BL) | 98% | 52% | 52% | 54% |
5. Conclusions
The entire energy system of the ammonia industry has been evaluated to quantify material use, energy consumption, and CO2 and air pollutant emissions.
In terms of material and energy consumption, the maximum cost-effective energy-saving potential is 7% for fresh water, 25% for fuel coal, and 16% for electricity under the EE scenario. The CCS technology adopted to achieve low-carbon development increases electricity consumption. In exploring the path to achieve deep de-carbonization, the introduction of electrolysis technology greatly increases the energy-saving potential of fresh water and fuel coal. However, it requires more electricity.
Regarding the different types of emissions, EE measures can reduce 33% of CO2, 24% of PM2.5, 24% of SO2, and 24% of NOx. In addition, CCS technology contributes significantly to CO2 reduction, increasing the reduction potential to 62%. However, it has no positive effect on the other three air pollutants. Nonetheless, the electrolysis technology adopted to meet the deep de-carbonization target has a significant effect on both CO2 and air pollutants. Further, Integration of CCS and electrolysis technologies could increase emission reduction potential up to 98% (table 3).
In achieving deep emission reduction or even NZEs, the CO2 reductions provided by CCS technology alone are limited. With the cost of renewable electricity falling, integration of electrolysis-based ammonia technology and CCS is a suitable choice for policy makers.
Acknowledgments
The study was supported by the National Natural Science Foundation of China (71904007, 71690245), the GEIGC Science and Technology Project on 'Modelling Air Pollution Control and Environmental Health Perspectives under the Green and Low Carbon Transition of Global Energy System' (2900/2020-75001B), and the Fine Particle Research Initiative in East Asia Considering National Differences (FRIEND) Project through the National Research Foundation of Korea (NRF) funded by the Ministry of Science and ICT (Project No. 2020M3G1A1114622). We extend our gratitude to the valuable comments of the anonymous reviewers. All remaining errors remain the sole responsibility of the authors.
Data availability statement
The data that support the findings of this study are available upon reasonable request from the authors.