

Abstract
Paleo-climate proxy records documenting sea-ice extent are important sources of information to assess the time of emergence and magnitude of on-going changes in the Arctic Ocean and better predict future climate and environmental evolution in that region. In this study, a suite of geochemical tracers including total organic carbon (TOC), total nitrogen (TN), carbon/nitrogen ratio (C/N), stable isotope composition of organic carbon and nitrogen (δ13C, δ15N), and phytoplankton biomarkers (highly branched isoprenoids (HBIs) and sterols) were measured in a marine sediment core to document the sea-ice variability in the Chukchi Sea since the beginning of the Industrial Era. The downcore profile of the sea-ice proxy HBIs suggests a transition from extensive sea ice in the late 19th century to Marginal Ice Zone (MIZ) in AD 1930–1990s and then moderate sea-ice cover since 1990s. Rising of all HBI abundances between AD 1865–1875 indicate a transient retreat of summer ice edge off the shelf followed by a return to near-perennial sea ice till 1920–1930 as revealed by the absence of HBIs and brassicasterol. Sea ice retreat occurred again in AD 1920–1930 and followed by colder decades in 1940s–1960s before a sustained decline since the 1990s. The downcore profile of C/N, δ13C of organic matter and sterols indicates a gradual increase of terrigenous inputs accelerating during the most recent decades likely due to enhanced fluvial run-off and sediment transport by sediment-laden sea ice. Concomitantly, increasing δ15N values suggest limited nutrient utilization due to enhanced stratification of the surface ocean caused by increased freshening. The role of the Arctic oscillation (AO), the Pacific decadal oscillation (PDO) and Atlantic Multidecadal Oscillation (AMO) are discussed to explore potential drivers of the observed sea-ice changes.
Export citation and abstract BibTeX RIS

Original content from this work may be used under the terms of the Creative Commons Attribution 4.0 license. Any further distribution of this work must maintain attribution to the author(s) and the title of the work, journal citation and DOI.
1. Introduction
Over the past decades, the Arctic Ocean has experienced dramatic climate and environmental changes including warming and rapid sea-ice retreat (Steele et al 2008, Onarheim et al 2018, Screen et al 2018, Stroeve and Notz 2018), increased inflow of Pacific Water (PW) (Woodgate 2018, Woodgate and Peralta-Ferriz 2021), enhanced freshening of surface waters (Yamamoto et al 2009, Giles et al 2012) and increased ocean acidification (Qi et al 2017). These changes are having a strong impact on primary production (Arrigo et al 2008, Arrigo and van Dijken 2015, Renaut et al 2018) and marine ecosystems (Wassmann et al 2011, Grebmeier 2012), especially in the western Arctic Ocean where warming is more pronounced (Li et al 2009, Coupel et al 2012, 2015, Lee et al 2019, Zhuang et al 2020).
Sea ice is an essential component of Arctic climate and a key player in Arctic amplification (Thomas 2017). The loss of sea ice affects heat and moisture exchanges between the ocean and the atmosphere and modifies deep-water formation through brine formation and ice melting (Petrich and Eicken 2017) thereby altering the Arctic Ocean circulation (Aagaard and Carmack 1989). Since the mid-20th century, thinning of sea ice combined with the lengthening of the melt season (Markus et al 2009, Stroeve et al 2014) and the loss of perennial multiyear ice have resulted in larger ice-free areas in summer (Holland et al 2006), and in some regions, earlier melting (Wang and Overland 2009, 2012). The western Arctic Ocean has undergone some of the most rapid and persistent decay of sea ice (Cavalieri and Parkinson 2012, Serreze et al 2016, Simmonds and Li 2021). Climate projections predict a reduction of sea-ice cover duration of 20–36 d before 2050 in the southern Chukchi Sea, and up to 60 d in the East Siberian, Chukchi, and Beaufort Seas (Wang et al 2018).
Sea-ice reconstructions provide a retrospective time frame to help decipher processes driving the long-term decline as well as decadal to centennial-scale variability of sea ice. Several biogenic and sedimentary proxies have been developed to obtain information on past sea ice conditions (Polyak et al 2010, Kolling et al 2020, Zhang and Xiao 2021). Among them the molecular proxy, IP25 (Ice Proxy with 25 carbon atoms), a mono-unsaturated highly-branched isoprenoid (HBI) produced by few sea-ice diatoms has proven to be a valuable tool to assess seasonal sea ice cover from marine sediments (Belt et al 2007, Sicre et al 2013, Brown et al 2014). Since the first reconstruction of Massé et al (2008) in the North Atlantic, numerous studies have used this biomarker in (sub)-polar oceanic regions (mostly of the northern hemisphere), often in combination with phytoplankton biomarkers (e.g. brassicasterol or dinosterol), in the so called 'PIP25 (Phytoplankton-IP25) index' to produce semi-quantitatively seasonal sea-ice estimates (see reviews of Belt and Müller 2013, Belt 2018). More recently, a tri-unsaturated HBI (HBI III) has been proposed as an alternative to represent pelagic phytoplankton in order to improve the PIP25 index (Belt et al 2015, Smik et al 2016, Bai et al 2019, Koch et al 2020, Su et al 2022) while Belt (2018) hypothesized that HBI II, also associated with sympagic algae, might provide an even better seasonal sea ice proxy than IP25.
Historical data and high-resolution reconstructions of Arctic seasonal sea ice are still scarce (Kinnard et al 2011, Walsh et al 2016) and only a few paleo-records exist in the western Arctic Ocean (Pieńkowski et al 2017, Stein et al 2017, Astakhov et al 2019, 2020, Kim et al 2019, Koch et al 2020). In the present study, we report on the downcore profiles of HBIs including IP25, HBI II and HBI III as well of phytosterols, namely brassicasterol (24-methyl-5α-cholest-5,22E-dien-3β-ol) and dinosterol (4α, 23, 24-trimethyl-5α-cholest-22E-en-3β-ol) from a core retrieved in the northern Chukchi Sea. These biomarkers were analyzed to derive quantitative information on seasonal sea-ice evolution since AD 1850 and to explore causes of observed changes. Terrestrial biomarkers were also investigated as a complementary environmental information source of a changing Arctic Ocean.
2. Regional setting and material
The Chukchi Sea is one of the largest marginal seas in the world (Jakobsson 2002). This region is strongly influenced by the northward PW inflow driven by salinity gradients between the Pacific and the Arctic Ocean (Coachman et al 1975) (figure 1). In the Bering Strait, the PW splits into three main water masses i.e. the warmer, fresher and nutrient-depleted seasonal Alaska Coastal Water to the East (ACW; Hunt et al 2013), the saline and nutrient-rich Anadyr Water (AW) to the West, and the Bering Shelf Water (BSW) in the central channel with moderate nutrient and salinity values (Weingartner et al 2005). The surface hydrology of the region is also influenced by the Beaufort Gyre (BG) clockwise circulation driven by the Beaufort High winds (Proshutinsky and Johnson 1997). In the past two decades, strong and more effective spin-up of the BG circulation has resulted in enhanced freshening in the western Arctic Ocean (Giles et al 2012) with consequences on phytoplankton productivity and Arctic ecosystem (Coupel et al 2015, Ren et al 2020). With the steepened decline of Arctic sea ice over the last four decades, the extent and thickness of sea ice in the Chukchi Sea has decreased more than any other marginal seas of the Arctic Ocean (Serreze and Stroeve 2015, Onarheim et al 2018). According to satellite observations, sea ice today is present from November to July and retreats during summer to reach a minimum over the northern Chukchi Sea in September (figure 1, https://nsidc.org, from Cavalieri et al 1996).

Figure 1. Map of the western Arctic Ocean and oceanographic setting (after Danielson et al 2011). The red star indicates the locations of core ARC4-C07. The black dots show other sediment cores discussed in the text (Astakhov et al 2019, Kim et al 2019; more information can be found in table S1). The red dot indicates the mooring site (station DM) (Bai et al 2019). The purple line features the mean September sea-ice extent for the 1988–2007 period (15% of sea ice concentration) (from Cavalieri et al 1996, https://nsidc.org/). Current systems: PW—Pacific Water; SCC—Siberia Coastal Current; AW—Anadyr Water; BSW—Bering Shelf Water; ACW—Alaska Coastal Water; BG—Beaufort Gyre. Reprinted from Bai et al, Copyright 2019, with permission from Elsevier.
Download figure:
Standard image High-resolution imageThe sediment core ARC4-C07 (72.54 °N, 165.33 °W, 51 m water depth) used in this study was retrieved from the shelf of the Chukchi Sea using a multi-corer during the 4th Chinese National Arctic Research Expedition (CHINARE) on board the R/V Xue Long in summer 2010 (figure 1 and table S1 available online at stacks.iop.org/ERL/17/044058/mmedia). The ARC4-C07 core (hereafter named C07) is located in an area where sea-ice cover is high in spring but close to the sea-ice edge in summer (figure 2). The 20 cm long sediment core was subsampled on board at 1 cm sampling interval from 0 to 10 cm and every 2 cm below 10 cm depth, and stored at 4 °C until further treatment (see supplementary material for methods on the core chronology and biomarker analysis).

Figure 2. Averaged sea-ice concentrations from 1988 to 2007 for (a) spring (April, May and June) and (b) summer (July, August and September) (data source, http://nsidc.org). Averaged (c) annual Sea Surface Temperature (SST) and (d) summer SST (data source: Word Ocean Atlas 2013). The red star indicates location of core ARC4-C07.
Download figure:
Standard image High-resolution image3. Results
3.1. Bulk parameter downcore profile
Figure 3 shows the downcore profile of TOC (%), biogenic silica (%), TN (%), C/N molar ratio, δ13C (‰) and δ15N (‰) in the C07 core since AD 1850. TOC values range from 1.46% to 2.93% at the core top, with a mean value of 1.98%, and show a gradual increase towards present except for lower values from the late 1970s and early 1980s (figure 3(a) and table S2). Biogenic silica shows broadly similar trends as TOC except for a sharp decay in the uppermost layer after a maximum of 17.3% at AD 1990 (figure 3(b)). TN content increases in a narrow range (0.15%–0.34%) with lower values in the 1970s and at the end of the 19th century, similar to TOC. The C/N ratio show more variability between 7.8 and 11.5 with a mean value of 9.6. The δ13C values of organic matter span from −22.3‰ to −23.6‰ at the core-top with a mean value of −22.7‰. The δ15N values vary between 7.7‰ and 8.1‰ at the core-top with little changes downcore (figures 3(c)–(f)).
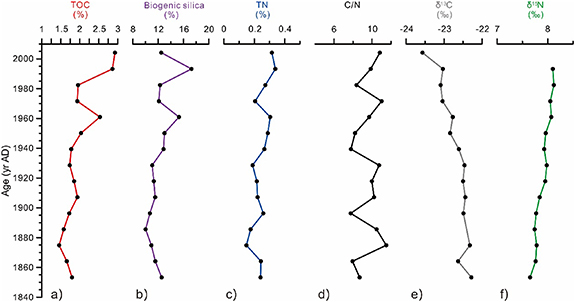
Figure 3. Downcore profiles of (a) Total Organic Carbon, TOC in %; (b) Biogenic silica in %; (c) Total Nitrogen, TN in %; (d) C/N ratio; (e) carbon isotopic composition (δ13C) of the TOC in ‰ and (f) nitrogen isotopic composition (δ15N) in ‰ from core ARC4-C07.
Download figure:
Standard image High-resolution image3.2. Biomarkers downcore profile
Generally, all biomarker concentrations show a broad increase towards present (figure 4 and table S2). IP25 is generally low until AD 1930, except for a brief increase around AD 1870 (1.4 μg g−1 TOC) coincident with decreasing TOC and biogenic silica values, followed by a gradual increase accelerating in the 1960s to reach highest values in the 1990s (4.2 μg g−1 TOC) (figure 4(a)). The downcore profile and range of concentrations of HBI II and IP25 are very similar, while HBI III is an order of magnitude lower, ranging from 0.01 to 0.47 μg g−1 TOC (figures 4(b) and (c)). Brassicasterol abundances are low until the abrupt increase in the 1990s to a maximum of 27.9 μg g−1 TOC (figure 4(d)). The dinosterol profile is quite different and shows strong decadal-scale variability that share resemblance with terrigenous biomarkers (campesterol and β-sitosterol) (figures 4(e) and (f)).
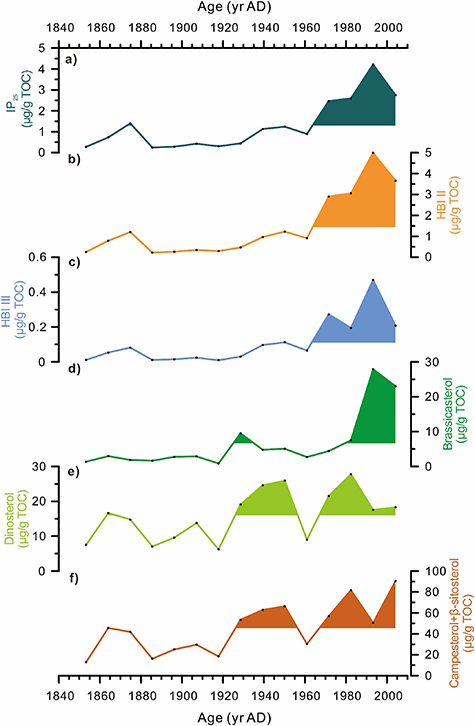
Figure 4. Biomarker concentrations in core ARC4-C07. (a) Abundances relative to internal standard and normalized to TOC of IP25 in μg g−1 TOC; (b) HBI II in μg g−1 TOC; (c) and HBI III in μg g−1 TOC; Concentrations normalized to TOC of (d) Brassicasterol in μg g−1 TOC; (e) Dinosterol in μg g−1 TOC; (f) terrigenous sterols campesterol + β-sitosterol in μg g−1 TOC. Colored shading highlights values above the downcore mean.
Download figure:
Standard image High-resolution image4. Discussion
4.1. Organic matter sources and trends
The high TOC content of the core top (2.93%) falls in the upper range of TOC values reported in surface sediments across the Chukchi Sea shelf (1.25%–2.56%) by Goñi et al (2013) (table S2). TN values range from 0.15 to 0.34% (table S2) and show significant positive correlation with TOC (r 2 = 0.68, p< 0.01, figure 5) suggesting similar sources and fate of C and N. The C/N ratio has commonly been used to distinguish between algal and terrigenous organic matter (OM) (Hedges et al 1986). Fresh marine algae typically exhibit C/N ratios around 4–6 whereas in vascular plants these values are above 20 (Meyers 1994). C/N ratios >10 typically indicate significant terrestrial influence (Grebmeier et al 1989). Downcore C/N values at C07 vary between 7.8 and 11.5 (mean value of 9.5, table S2) indicating notable and increasing contribution of land-derived inputs since the late 1970s likely due to enhanced river run-off resulting thawing permafrost and ground ice melting induced by Arctic warming. The SCC flowing eastward towards the Chukchi shelf where it is diverted offshore by PW could occasionally contribute to the transport of terrestrial material to the core site (green arrows in figure 1). In addition, the central current BSW (blue arrow in figure 1) is likely to carry fine sediment particles from the Bering Strait and shallow southern Chukchi shelf to C07 site (Weingartner et al 2005, Darby et al 2009, Yamamoto et al 2017). A substantial amount of terrestrial organic matter to marine sediments may have be delivered via the melting of sea ice (Eicken et al 2005). Lalande et al (2007) also underlined commonly found high concentrations of lithogenic material in the lower layers of sea ice implying substantial contribution to vertical fluxes.
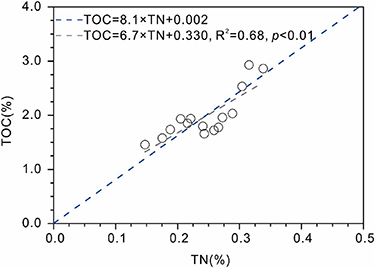
Figure 5. Cross-plot of downcore values of TOC (in %) and TN (in %) for core ARC4-C07 (in grey). The blue dashed line shows the linear from Goñi et al (2013) derived from surface sediments across the North American Arctic margin and showing the slope of 8.1.
Download figure:
Standard image High-resolution imageThe δ13C provides complementary information on organic carbon sources. Previous evaluation of isotopic end-members in the northern Bering and Chukchi Seas indicates distinctly δ13C values for marine phytoplankton (−21.2‰) and terrigenous C3 plant material (−27.0‰) (Naidu et al 2000). However, it is important to note that the δ13C values of OM from sea ice algae can vary between −15‰ to −18‰ (Schubert and Calvert 2001). Belt et al (2008) further reported that the mean δ13C value for IP25 (−19.3‰) lies at the heavily 13C-enriched marine end-member for Arctic OM. Therefore, δ13C downcore values of −22.3‰ to −23.6‰ are likely indicative of marine sources with some contribution of isotopically lighter terrestrial organic material. More depleted δ13C values towards present are also indicative of enhanced inputs from the land over the last decades as also inferred from C/N ratios (figure 3(d)) and higher amounts of campesterol and β-sitosterol, in particular since the 1960s (figure 4(f)).
The downcore profile of δ15N values, spanning from 7.7‰ to 8.1‰, indicate a long-term increase. The δ15N values of OM produced by plankton range between 7‰ and 10‰, whereas in C3 higher plants they are comprised between 0‰ and 2‰ (Meyers 1997). The δ15N trend may feature enhanced nutrient utilization by phytoplankton due limited nutrient availability under stratified conditions triggered by sea ice melting as postulated by Lee et al (2012) based on N and C uptake rates. Increasing riverine freshwater inputs also contribute to ocean stratification and freshening of the Arctic Ocean (Li et al 2009). A recent modeling study has shown that riverine water discharge would also impact significantly on the heat budget of the Arctic Ocean and consequently contribute to the sea-ice decline (Park et al 2020).
4.2. Downcore profiles of biomarkers
As can be seen from figure 4, sympagic HBIs (IP25 and HBI II) and pelagic biomarkers (HBI III, brassicasterol and dinosterol) display similar trends but at different concentration levels. The presence of IP25 and pelagic biomarkers throughout the core indicates seasonal sea-ice conditions at C07 since AD 1850 (Bai et al 2019, Hu et al 2020). All HBIs occur at extremely low levels in the older part of the record pointing out extensive sea-ice cover, except for a short interval of higher values between AD 1865 and AD 1875 (figures 4(a)–(c)). These results are consistent with historical sea ice data from whaling ship logbooks throughout the northern Bering Sea reporting more severe sea-ice conditions in the 1850s to 1860s, comparable to the 1970s taken as a reference for recent cold conditions (Mahoney et al 2011). Indeed, while winter sea-ice extent was similar during both periods, summer sea-ice extended further South in the Bering Strait in the 1850s to 1860s due to thicker sea ice and slower melting (Mahoney et al 2011). The logbooks also describe a period of sea-ice retreat to the northern Bering Strait, which corresponds to sympagic HBIs and HBI III peaks found at AD 1865–1875 in our core (Mahoney et al 2011; figure 4). Subsequent decades of the early 1900s are characterized by lower sympagic HBIs caused by a temporary return to colder conditions until a first stepwise increase at AD 1930 and second one in the 1990s (figures 4(a) and (b)). Stable HBI values in the 1940–1960s are consistent with temporarily cold conditions reported by Mahoney et al (2011).
The IP25 profile of the neighboring core ARA01B-03MUC (73.52 °N, 168.94 °W, 72.5 m water depth; figure 1) located northwest of C07 shows similar features (Kim et al 2019) (figure 6(a)). However, HBI III and brassicasterol decrease earlier in the upper ARA01B-03MUC, while IP25 declines synchronously in both cores. High brassicasterol together with high IP25 in ARA01B-03MUC since AD 1950 are indicative of sea-ice edge conditions. This is further supported by the co-eval lower and decreasing abundance of HBI III attesting the retreat of sea ice (0.15–0.07 µg g−1 TOC for ARA01B-03MUC versus 0.2–0.5 µg g−1 TOC for C07) (figure 6(b)).
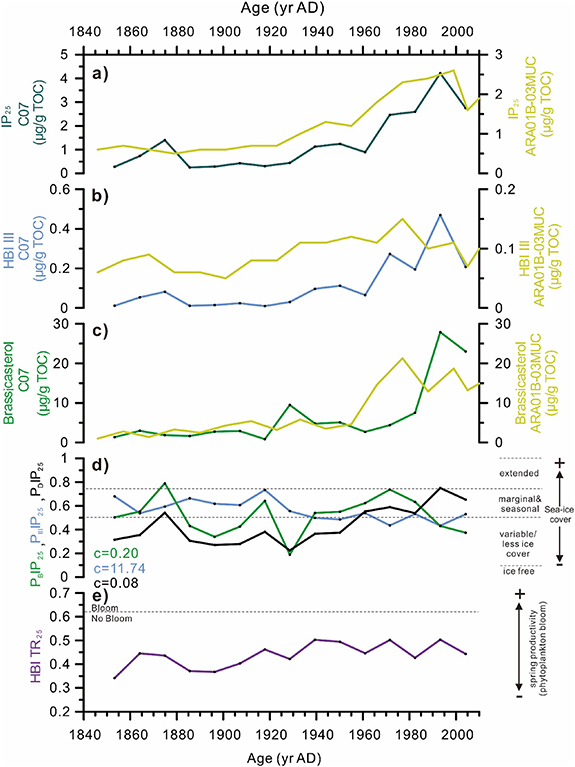
Figure 6. Downcore biomarker profiles of (a) IP25; (b) HBI III; (c) brassicasterol from core ARC4-C07; (d) PIP25 index using brassicasterol (PBIP25, c= 0.20 as calculated from the current core dataset), dinosterol (PDIP25, c= 0.08 as calculated from the current core dataset), and HBI III (PIIIIP25, c= 11.74 as calculated from the current core dataset); (e) HBI TR25 calculated according to Belt et al (2019). The dotted horizontal line ∼0.62 indicates the threshold for the spring phytoplankton as established by Belt et al (2019). The yellow lines show the IP25, HBI III and brassicasterol measured in core ARA01B-03MUC (Kim et al 2019). Values can be found in supplementary table 2.
Download figure:
Standard image High-resolution imageThe downcore profile of dinosterol is different from that of sympagic HBIs and brassicasterol (figures 4(d) and (e)). Low brassicasterol and HBI III from the late 19th century until AD 1920–1930 are coherent with extensive sea ice in the Chukchi Sea (figure 4). However, high amounts of dinosterol (i.e. >10 μg g−1 TOC) are surprising and could reflect other source organisms such as sea-ice microalgae as reported by Nichols et al (1990) in sea ice samples from Antarctica. Note that the downcore profile of brassicasterol and dinosterol in ARA01B-03MUC show similar differences (Kim et al 2019). Another common feature in C07 and ARA01B-03MUC is the recent decline of IP25 and brassicasterol, supporting accelerating summer sea ice retreat in the Chukchi Sea driven by climate change in recent decades (figures 6(a) and (c)).
Increased terrigenous sterols (campesterol and β-sitosterol) are consistent with C/N and δ13C data and further evidence high and increasing river run-off (figure 4(f)). With the decline of sea ice, airborne continentally-derived material from adjacent continents could also contribute more to Arctic sediments. Indeed, in addition to fluvial deposits, terrestrial constituents transported over long distances from their emission sources as aerosols accumulate in sea ice and get released during the melting season. This is evidenced by terrigenous n-alkanes at station DM (figure 1) showing high export fluxes as sea ice breaks-up in summer (Bai et al 2019). Ren et al (2020) also reported similar results with high terrigenous campesterol and β-sitosterol fluxes in summer contrasting with no detectable export in winter.
4.3. HBIs and phytosterols as proxies of seasonal sea ice
Semi-quantitative estimates of sea ice can be calculated from the PIP25 index by combining sympagic IP25 with pelagic phytoplankton biomarkers using the following expression:
where c is a balance factor accounting for the different magnitude concentrations between IP25 and phytoplankton biomarkers, such as brassicasterol and dinosterol that were used as the phytoplankton end-member to derive PBIP25, PDIP25. More recently, HBI III has also been proposed as an alternative pelagic phytoplankton end-member to calculate PIIIIP25 index.
Indeed, surface sediments from the Barents and Chukchi seas have shown elevated abundances of HBI III in the vicinity of the sea-ice edge or in the MIZ (Belt et al 2015, Smik et al 2016, Ribeiro et al 2017, Belt 2018, Bai et al 2019). Yet, different relationships of this compound to sea ice have been postulated. For example, maximum HBI III in surface sediments from the western Barents Sea has been associated with winter sea-ice extent and/or the MIZ (Belt et al 2015) while Ribeiro et al (2017) correlated HBI III in East Greenland fjord sediments to mid-July MIZ conditions. Uncertainties still remain as to the HBI III producers and habitat mainly because of the lack of modern ocean observations. Knowledge on HBI III has been essentially inferred from correlations between concentrations in surface sediments and SIC at different seasons. The only sediment trap data on HBI III in the Arctic Ocean are from Bai et al (2019) at station DM (figure 1) that shows high fluxes at moderate sea-ice cover (<50%) and their decrease towards ice-free conditions that are consistent with production by sea-ice edge thriving diatoms. Furthermore, cross-plots of HBI III against IP25 downcore concentrations exhibit a stronger positive relationship than brassicasterol against IP25 (figure S2) in agreement with HBI III production being closely associated with the sea-ice edge. This interpretation is also supported by co-eval higher fluxes of the IP25 and HBI III from end of July to early August at the station DM (Bai et al 2019). Synchronous changes of IP25 and HBI III have been further interpreted by Belt (2018) as reflecting rapidly changing sea ice (advancing and retreating) such as for example the two-step concomitant rise of HBI III and IP25 in the1970s and early 1990s in our core (figures 6(a), (b) and 7; Smik et al 2016, Belt 2018, Bai et al 2019).

Figure 7. Comparison of PIIIIP25-derived summer sea ice (SuSIC) and June sea ice (June-SIC) of core ARC4-C07 with climatic and paleoceanographic records. (a) September sea-ice extent record for the Chukchi Sea (Walsh et al 2016); (b) composite time series of the annual Arctic surface air temperature (SAT) anomalies (°C) relative to 1961–1990 Arctic temperature anomalies (Polyakov et al 2002); (c) Pacific decadal oscillation (PDO) Index (from Halfar et al 2011); (d) AMO (Atlantic Multidecadal Oscillation) Index (www.psl.noaa.gov/data/timeseries/AMO/) and AMOC (Atlantic Meridional Overturning Circulation) (from Caesar et al 2018); (e) reconstruction of ice-free period at core 14R07 (in days). The black dotted line shows the observed duration of the ice-free period based on the elemental composition of sediments (from Astakhov et al 2019); (f) Arctic oscillation (AO) mean index for summer (JAS, Li and Wang 2003); (g) PIIIIP25-derived summer sea ice calculated using the relationship in figure S3(a) and for June-SIC using the relationship in figure S4(a) (see discussion). The bold lines in c and f represent the five-point running means. The vertical dashed lines indicate division of PDO phases as defined by Rodionov et al (2007).
Download figure:
Standard image High-resolution image
HBI III, as well as brassicasterol and dinosterol were thus used to calculate PIP25 indexes and derive semi-quantitively sea ice changes since AD 1850. On average, concentrations of brassicasterol were about five times higher, dinosterol about twelvefold higher and HBI III about 12 times lower than IP25, resulting in balance factor c of 0.20, 0.08 and 11.74, respectively. Downcore PBIP25 values vary between 0.19 and 0.79, which according to Müller et al (2011), correspond to low sea ice to MIZ conditions, with only one value above the permanent sea-ice cover threshold (i.e. PBIP25 >0.75) (figure 6(d)). The sharp drop in the 1920s −1930s suggests a transient period of sea-ice retreat (figure 7(a)). Since AD 1930, PBIP25 values increase from 0.54 to 0.74, indicating proximal MIZ conditions except for the last decade of accelerated decline (figure 6(d) and table S2). Indeed, PBIP25 shows a decreasing trend towards less/variable sea-ice cover since the late 1990s as expected from the recent unprecedented decline of sea ice in the northern Chukchi Sea (Walsh et al 2016). PIIIIP25 values show different trends and variability that share more resemblance with the sea ice extent in the Chukchi Sea of Walsh et al (2016) with relatively high and stable values from the 1880s to the 1920s followed by a continuing decrease reflecting the progressive and long-term retreat of seasonal sea ice extent (figure 6(d) and table S2). Yet, the drastic reduction of the last decades is not reproduced by the PIIIIP25 index. This result can be explained by HBI III production tending to zero as surface waters become ice-free during summer as opposed to brassicasterol (Bai et al 2019). The PDIP25 values show similar features as PBIP25, despite discrepancies between dinosterol and brassicasterol profiles, except since the 1980s when PDIP25 indicates increased sea ice contrary to observations (Walsh et al 2016) (figures 4(d), (e) and 6(d)). Diverging spatial distribution of these two sterols has also been underlined by Su et al (2022) in the Eastern Siberian Sea. It has been speculated that dinosterol in the Arctic Ocean might be produced by other organisms than dinoflagellates (Nichols et al 1990). Due to remaining source uncertainties of this sterol in the Arctic Ocean and inconsistent trends at moderate to low sea ice, PDIP25, was not further considered for sea-ice reconstruction.
Finally, the tri-unsaturated HBI ratio (HBI TR25) was also calculated using the following equation of Belt et al (2019) (HBI TR25= [Z-triene]/([Z-triene] + [E-triene])) to explore this new biomarker as a potential proxy of spring phytoplankton bloom in the Arctic and sub-Arctic. The downcore values of HBI TR25 are all below the spring phytoplankton bloom threshold of 0.62 from which we can conclude that primary production did not reach high levels as suggested by the δ15N values pointing out limited nutrient availability of surface waters (figure 6(e)).
4.4. Centennial-scale variability of sea-ice and potential key physical drivers
4.4.1. SIC reconstruction
In order to translate the downcore profiles of PIIIIP25 and PBIP25 into SIC, we performed sensitivity tests using the surface sediment dataset from the Chukchi Sea of Bai et al (2019) and the monthly SIC values from satellite data for June, July, August and September as well as for the summer months (July-September, JAS); SuSIC) (figures S4 and S5). PIIIIP25 in surface sediments shows a stronger correlation with SuSIC (r2 = 0.47, p< 0.01) than PBIP25 r2 = 0.09, p< 0.01) (figure S3; Bai et al 2019). Furthermore, downcore PBIP25 derived SuSIC yield negative values at low sea ice and values exceeding 100% at high sea ice (figure S6). The SuSIC obtained from PIIIIP25 leads to generally lower estimates and negative values over the most recent decades. Reconstructions obtained from PIIIIP25 and PBIP25 for June, July, August and September (figures S4 and S5) show similar trends as for SuSIC but differ in absolute values (figure S6). As found for SuSIC, correlations between monthly SIC and PIIIIP25 were stronger than with PBIP25. June seems to provide the best downcore SIC estimates and range of variation, and PIIIIP25 to perform better than PBIP25 (figure S6). Yet the steep decline of the last decades (figure 7(g)) is not reproduced by our reconstruction possibly because of smoothing effect due to the temporal resolution (on average of 10 years) or low HBI III production as highlighted earlier. In contrast, PBIP25 still overestimate SIC at high sea ice and underestimate SIC at low SIC (figure S6).
4.4.2. Key physical drivers
Important parameters affecting Arctic sea ice include winds and ice motion, cloud cover, ice albedo feedback and ocean heat advection (Perovich 2011). Modes of climate variability such as the Arctic oscillation (AO, Thompson and Wallace 1998), the Pacific decadal oscillation (PDO, Mantua et al 1997), and the Atlantic Multidecadal Oscillation (AMO, Enfield 2001) can have an impact on sea ice variability on decadal time scales (Mahajan et al 2011, Frey et al 2015). In order to evaluate the role of these factors in the northern Chukchi Sea, our data were compared to AO, PDO, and AMO indices as well as to the Arctic surface air temperature (figure 7).
4.4.3. Links with the AO
The AO is a major atmospheric circulation feature of the mid- to high latitudes of the Northern Hemisphere. Several studies have recognized the complex relationship between Arctic sea ice and AO or its expression in the North Atlantic, the North Atlantic Oscillation (NAO) (Rigor et al 2002, Danielson et al 2011, Stroeve et al 2011, Yang et al 2016, Luo et al 2017). In the Arctic, the AO is known to affect sea ice motion through surface winds thereby altering sea ice thickness and concentration. A positive and significant correlation was demonstrated between summer AO and sea ice in the Chukchi Sea (see figure 13(d) from Frey et al 2015). Indeed, during summer season, negative AO promotes southeasterly winds bringing warm air over the Chukchi Sea decreasing the sea ice cover, a mechanism that could account for the long-term AO weakening and associated sea-ice decline from AD 1920–1930s to the 1970s (figures 7(f) and (g)). On the other hand, during positive AO the transport and piling up of old sea ice pushed by northeasterly winds result in extensive summer sea ice in the Chukchi and Beaufort seas such as found in the late 1800s–early 1900s (Frey et al 2015). However, in the recent decade of positive AO, warmer surface ocean would have favored sea ice melting preventing its accumulation (Wang et al 2009, Stroeve et al 2011), leading instead to sea ice decline at unprecedented rate as illustrated by the ice-free period reconstruction from the nearby 14R07 of Astakhov et al (2019) (figure 7(e)).
4.4.4. Links with the PDO
The PDO is another factor of sea-ice variability at decadal timescales. The PDO is defined as the leading empirical orthogonal function of monthly sea surface temperature in the North Pacific, North of 20 °N (Mantua et al 1997). Instrumental data show that the PDO was predominantly positive for the 1922–1944 period, negative between 1945 and 1976, and positive again between 1977 and 1990 (Rodionov et al 2007, Wendler et al 2014; figure 7(c)). Negative PDO in the early 20th century (AD 1910–1920) corresponds to high sea-ice cover while the subsequent positive PDO years (AD 1922–1944) are associated with decreasing sea ice in our record. These results are in accordance with the negative correlation between summer PDO and sea ice in the Chukchi Sea although not statistically significant (see figure 13(c) in Frey et al 2015). However, negative PDO years since 1940 seem to roughly coincide with decreasing sea ice suggesting that this relationship would not hold since the mid-20th century. Furthermore, negative PDO phases coincide with colder years in the Arctic air temperature record except for the last warmer decades possibly reflecting overprinting of the global warming trend as suggested for AO (figure 7(b), Connolly et al 2017).
4.4.5. Links with the AMO and AMOC
The AMO, which is thought to be mainly driven by the Atlantic Meridional Overturning Circulation (AMOC), has been investigated as an additional possible source of natural variability of sea ice. In fact, the AMO also has been found to have an impact on Eurasian surface air temperature (Luo et al 2017). Control simulations using the GFDL CM2.1 model have shown a strong negative correlation between both AMO and AMOC and Arctic sea ice at all seasons (Mahajan et al 2011). Comparison of AMO with our data broadly shows opposite sign evolution with extensive sea ice until 1910s–1920s at negative AMO, followed by decreasing sea ice until the 1960s as AMO increases (figures 7(d) and (e)). Thereafter, this relationship seems to attenuate. According to Mahajan et al (2011), the influence of AMO on the recent summer sea ice decline would have been weak compared to the response of sea ice to AO. This finding is further supported by CMIP3 coupled general circulation model simulations using pre-industrial forcing of Day et al (2012) showing that the AMO shift from negative to positive phase between 1979 and 2010 accounted for only 0.5%–3.1%/decade of the 10.1%/decade of September sea ice decline. If confirmed, this result would suggest that the North Atlantic heat transported to the Arctic would not be as determinant in sea ice changes in the Chukchi Sea. Very recently Luo et al (2022) further highlighted the joint effect of AMO and PDO on the decadal variability of Arctic air temperatures. The loss of summer Arctic sea ice and flushing of multi-layer sea ice out of basin in the past decade has already changed the atmospheric circulation. The overprinting effect of global warming in the Arctic may have caused different environmental mechanisms and feedbacks that could explain changes in the relationship between sea ice, air temperature and climatic drivers.
5. Conclusions
The downcore record of sea ice proxies since AD 1850 allowed to improve semi-quantitative assessment of sea ice and gain insights into past sea ice and environmental changes in the Chukchi Sea. Bulk parameters and sterol data along the core indicate increase terrestrial material to the sediments due to enhanced continental run-off, sediment transport by sediment-laden sea ice and airborne inputs. The δ15N data indicate gradual nutrient limitation of phytoplankton growth due to enhance stratification induced by surface freshening.
Among PIP25 indexes, PIIIIP25 appears to best reproduce trends and variability of sea ice in the Chukchi Sea. Our data also question the use of dinosterol as an end-member for pelagic phytoplankton in the Arctic Ocean due to potential bias of sea ice microalgae producing dinosterol that would deserve further investigation on sea ice samples. The sea ice reconstruction based on PIIIIP25 shows variations that are coherent with the positive and statistically significant relationship with the summer AO evidenced by Frey et al (2015). Notably, the sea-ice retreat in the 1865s–1875s and from the 1920s to the 1970–1980s are co-eval with negative AO phases, while extensive sea-ice cover in the 1910–1920s occurs during positive AO. However, this negative relationship between AO and seasonal sea ice seems to have been altered by global warming overprinting effect over the last decades. Our results also suggest a minor role of PDO and AMO on seasonal sea ice as compared to AO since the 20th century in agreement with model experiments.
Acknowledgments
We are grateful to the captain, crew members and scientific party of the R/V Xuelong for their help with the retrieve of the sediment core. We are grateful to Fanny Kaczmar who helped produce HBI data at the LOCEAN, Sorbonne Université, Campus Pierre et Marie Curie (Paris), and to Dr Guillaume Massé for supplying the chemical standards. This study was funded by the Scientific Research Funds of the Second Institute of Oceanography, State Oceanic Administration, China (No. JG1911), the National Natural Science Foundation of China (Nos. 41976229, 41306200, 41606052, 41941013), the National Key Research and Development Program of China (Nos. 2019YFC1509101, 2019YEE0120900), the Chinese Polar Environmental Comprehensive Investigation and Assessment Programs (No. CHINARE 0304), and the project ICAR (Sea Ice melt, Carbon, Acidification and Phytoplankton in the present and past Arctic Ocean) funded by Cai Yuan Pei Program. We also thank the Centre National de la Recherche Scientifique (CNRS) for M -A S salary. We are grateful to the two anonymous reviewers who provided constructive suggestions for the manuscript improvement.
Data availability statement
All data that support the findings of this study are included within the article (and any supplementary files).
Conflict of interest
None
Author contributions
Y B designed the study and wrote the manuscript with contribution of M –A, S J R, B J, J C, H L and H J. V K and Z J contributed the biomarker analyses. L L retrieved the environmental data from different database. Q Z contributed the biogenic silica and L S performed the determination of TOC. All authors contributed to the final version of the manuscript.