

Abstract
This study aims to review the existing literature on the past and future effects of climate, land use, and land cover changes on hydropower generation in West Africa (WA), based on listings in the Scopus and Google Scholar databases. This review shows that several African hydropower plants have experienced repeated power disruptions over the last three decades due to climate change and variability but it is less documented how increasing land use and land cover changes around the major dams have impacted the hydrological system and the hydropower generation. In the future, the risks of hydropower in WA may not be equally distributed within a country or region. Despite uncertainties in precipitation and on impacts on streamflow and water level in major basins, climate change is likely to reduce the available water over the range of 10%–20% (15%–40%) for the RCP4.5 (RCP8.5) scenario by 2050, which may considerably affect the water demand across all sectors, including hydropower. However, in the Kainji dam (Niger River basin), models project an increase in rainfall favorable to hydropower production for both RCP4.5 and RCP8.5. In contrast, within the Black Volta sub-basin, the intensification of land use is predicted to favor runoff and, consequently, an increase in the generation of Bui hydropower in the near future, even though models predict a rainfall decrease. This increase in land use for agriculture to feed a growing population has other adverse effects that need to be assessed, namely sedimentation and siltation, which are harmful to hydropower plants. Finally, the combined impact of climate and land use changes on the efficiency of hydroelectric infrastructure in WA is not well documented, while sustainable planning and investments in the hydropower sector require consideration of the nexus between climate, land use changes, and water.
Export citation and abstract BibTeX RIS

Original content from this work may be used under the terms of the Creative Commons Attribution 4.0 license. Any further distribution of this work must maintain attribution to the author(s) and the title of the work, journal citation and DOI.
1. Introduction
The production of energy from fossil fuels is harmful to the environment in the long term and is considered to be the main source of anthropogenic greenhouse gas (GHG) emissions that contribute to climate change (IPCC 2011). According to the International Energy Agency (IEA), fossil fuels remain the largest source of energy in Africa, with an 80% share of total electricity generation, while 15.52% comes from hydropower, and the remainder from other sources (nuclear, waste, wind, and solar) (IEA 2019). In West Africa (WA), hydropower is the main source of renewable energy. In 2017, the total electrical energy production was respectively 32 249 GWh in Nigeria (17.14% from hydropower), 14 068 GWh in Ghana (39.92% from hydropower), 8575 GWh in Ivory Coast (17.83% from hydropower), 232 GWh in Togo (88.4%), and 4777 GWh (7.05%) in Senegal (IEA 2019). The hydropower plants already built in Ghana, Nigeria, and Ivory Coast represent more than 80% of the total installed capacity of WA.
To fulfill the Paris Agreement, measures have been taken to promote clean, renewable energy, such as hydropower, to mitigate climate change Indeed, WA has several transboundary rivers suitable for hydropower. This is confirmed by the figure 1 we plotted in overlaying data from Dams Atlas and from Global Runoff Data Centre. Figure 1 shows that 22 dams are already operational with total installed capacity of 5401.6 MW, while a larger number are in the planning stages (82 dams with total installed capacity of 18 679.60 MW), confirming the commitment of West African countries to increase the share of renewable energy to comply with the Paris Agreement in addressing the future energy demand. Paradoxically, climate change itself may alter the availability of this natural resource (water for hydropower), adversely affecting the financial viability of both existing and planned infrastructures (Shu et al 2018). A similar conclusion was found by Almeida et al (2021), who demonstrated that climate change may undermine power generation as well as the economic viability of future Amazon hydropower.
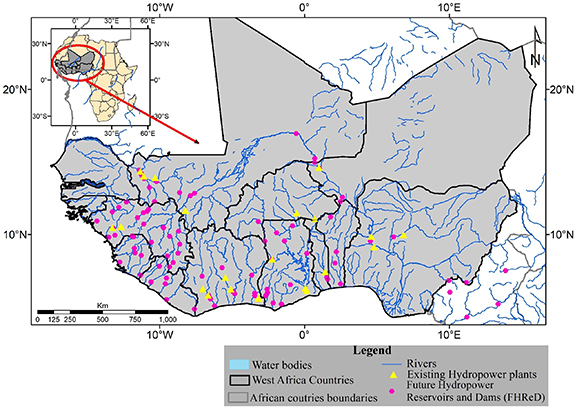
Figure 1. West African hydrological network with locations of existing and planned hydropower plants. The planned hydropower plants were extracted from the http://globaldamwatch.org/data/ website (Zarfl et al 2015).
Download figure:
Standard image High-resolution imageClimate change is predicted to create high rainfall variability and increase in temperature, making water availability uncertain (IPCC 2011). It may exacerbate the water stress currently faced by some countries, lengthening the list of countries at risk of water stress. In all West African basins, the relationships between precipitation, runoff, and discharge are complex due to land use/cover change (LULCC). The Senegal, Niger, and Volta basins, where the major hydropower plants are built, are projected to be severely affected by climate change and variability (Oyebande and Odunuga 2010, Oguntunde and Abiodun 2013). However, studies on the specific influences of climate change and the magnitude of these possible effects on hydropower in the region are nascent. Owing to the high risk on water availability and variability, future hydropower projects may be significantly affected by changes in climatic conditions (IPCC 2011).
Because of the importance of hydropower in the development of African countries and for the fulfillment of the Paris Agreement, scientific interest in hydropower in Africa is growing, but existing studies have focused mainly on the southern part of the continent (Hamududu and Killingtveit 2016). According to the West African Regional Center on Renewable Energy and Energy Efficiency (ECREEE) (ECREEE 2017), the impact of climate change on West African water resources is well known, but the effects on hydropower generation are not well documented, probably because of the lack of historical data.
In addition to climate change, there are other factors such as population growth, LULCC, water abstraction, and socio-economic development, which can affect hydropower generation. Freshwater ecosystems in Africa are threatened by anthropogenic land use changes, overexploitation of water, diversion of rivers and lakes, increased pollution, and sediment loading in water bodies (IPCC 2011). Indeed, the West African population is increasing rapidly, inducing faster land use/cover changes and impacting the dynamic behavior of hydrological systems (Descroix et al 2009). While most West African basins are transboundary with different land use practices and water abstraction, few studies have investigated the impacts of LULCC on hydropower generation in the region. Additionally, the combined effects of land use/cover and climate change are not well understood. This is a challenge for the sustainability of hydropower in the WA region.
According to ECREEE (2017), most hydropower management systems in the region and local actors have not integrated climate change and/or LULCC into their operations and planning. The main barrier to integrating climate change and LULCC into decision-making for sustainable development is that, on the one hand, the impact of climate on hydropower is uncertain and not evenly distributed across the region, and on the other hand, the few studies on LULCC change in sub-Saharan Africa are not designed to address the issue of the nexus between climate, land, water and energy. More research leading to climate service development is needed to enable dam managers and local political authorities to make decisions under these uncertainties and to mainstream climate change and LULCC in their management plans.
This review aims to synthesize what is known on past and future impacts of climate change and LULCC on hydropower generation in WA. The review methodology based on publications available in the Scopus and Google Scholar databases is presented in section 2. Hydroclimatic data and satellite products used to make the figures supporting the main results are also presented in section 2. Results of the literature review are presented in section 3: the impacts of climate change on water resources and hydropower are presented in section 3.1. Then, the impacts of land use and land cover dynamics on water resources and hydropower generation are presented in section 3.2. Finally, what is known about the combined effects of climate and land use/cover changes on hydropower generation in the main dams of the WA region is presented in section 3.3, with an overall synthesis on the climate—land use/cover—hydropower nexus. The conclusions are presented in section 4, with research perspectives.
2. Method and data
2.1. Methodology
The review protocol was adapted from the Preferred Reporting Items for Systematic Reviews and Meta-Analyses reporting guidelines for scoping reviews (PRISMA-ScR; (Chang 2018, Munn et al 2018, Tricco et al 2018)). After the identification of the research questions and keywords, a selection of relevant peer-review papers in Scopus and Google Scholar is done. Then, selected articles are classified into five thematic clusters: 'climate change and water resources' (CC_WR), 'climate change and hydropower' (CC_HP), 'land use/cover and water resources' (LULCC_WR), 'climate change, land use/cover and water resources' (CC_LULCC_WR), and 'climate change, land use/cover and hydropower' (CC_LULCC_HP).
After the analysis of papers in each cluster, a synthesis of the state of knowledge was performed according to the following three steps, representing the subsequent sections of this manuscript: (a) impacts of climate change on water resources and hydropower, (b) impacts of land use/cover changes on water resources and hydropower, and (c) the nexus between climate, land use/cover, and hydropower with a summary table of existing studies on major hydropower plants of WA.
The following question guided this review: what is known in the existing published research about the past and future impacts of climate change and LULCC on water resources and hydropower in WA? Within this broad question, this review aimed to answer the following questions: how do climate change and LULCC affect hydropower generation in WA? What are the main factors of the nexus between climate and land use/cover that drive hydropower generation in WA?
We first searched the Scopus database for publications with the set of keywords 'West Africa', 'climate', 'land use and land cover', 'hydropower' in the abstract, title, and keywords. We found a few peer-reviewed papers discussing the nexus in WA, and we noted 46 available and up-to-date papers. We then reoriented our investigation, filtering by 'West Africa', 'climate', and 'hydropower' keywords, and around 198 papers were found. Next, the keywords 'West Africa', 'land use', and 'hydropower' were used, and only 119 peer-reviewed papers were found to be available. Papers published before the year 2000 and cited by recent studies on the same West African basins were removed from the list of selected articles, as well as several articles dealing with southern or eastern Africa and citing results from West African rivers or basins (Whipple and Viers 2019). Finally, 66 papers published after 2000 were found to be relevant, 78.78% (52) of them were issued after 2010.
Google Scholar was used to perform the bibliometrics because its algorithm searches for keywords in the main text (not only in the abstract) and because it can suggest gray literature (Haddaway et al 2015, Moed et al 2016). The first list of 400 papers was found, among which 300 papers were also listed in Scopus. By filtering the 100 remaining papers manually and removing academic reports such as PhDs and Master's theses and conference abstracts, we selected 30 papers. Among these papers, 26 were published after 2010, 18 were research articles, and the others were relevant reports published by national or transboundary water basin agencies, national or regional agencies of electricity, or by international agencies of the United Nations system with quantitative values on water resources and hydropower in WA.
Figure 2 shows the percentage of papers per thematic cluster. Conclusively, 48.96% and 16.67% of the 96 selected papers were focused on CC_WR and CC_HP, respectively. Only 11.46%, 17.71%, and 5.21% dealt thematically with LULCC_WR, CC_LULCC_WR, and CC_LULCC_HP, respectively. It is worth noting that we did not find any studies specifically focused on the impact of LULCC on hydropower generation in WA, even though the areas around the existing hydropower plants or multipurpose dams are under pressure from multiple socio-economic activities such as human settlement, fisheries, vegetable farming, and agribusiness (Mahe et al 2013).

Figure 2. Percentages of assessed papers according to the following themes—CC_WR: 'climate change and water resources', CC_HP: 'climate change and hydropower', LULCC_WR: 'land use/cover and water resources', CC_LULCC_WR: 'climate change, land use/cover and water resources', and CC_LULCC_HP: 'climate change, land use/cover, and hydropower'.
Download figure:
Standard image High-resolution imageFinally, using the approach taken by Whipple and Viers (2019), the main results from the clusters above are merged and presented in the subsequent subsections. We created flowcharts at the end of each section to synthetize the impacts of climate change on water resources and hydropower (section 3.1), the impacts of land use/cover changes on water resources and hydropower (section 3.2), and the nexus between climate, land, and hydropower (section 4), with a summary table on what is known about the main drivers of past and future changes in hydropower generation in the major WA plants (table 1).
Table 1. Impacts of projected climate change and land use/cover dynamics on West African hydropower schemes. Near future refers to the period 2030–2060 while far future stands for the period 2070–2100.
| HP plant and installed capacity country | Basin | Operation year | Thematic | Impacts on hydropower generation | Authors | |
|---|---|---|---|---|---|---|
| Near future | Far future | |||||
| Nangbeto (65.6 MW) Togo | Mono | 1987 | CC&WR | Projected trends for cumulated precipitation are null or very moderate and diverge among models by 2050 (A1B and RCP8.5). | (Amoussou et al 2020) | |
| CC&WR | Change in precipitation in the range of −32.4% and +12% with late rainy seasons (RCP8.5). | (Lamboni et al 2019) | ||||
| CC&LULCC&HP | Change in Nangbeto HPP by −5.73% (RCP4.5) and −8.73% (RCP8.5) due to CC by 2050 | Change in Nangbeto HPP by −12.71% (RCP4.5) and −24.45% (RCP8.5) due to CC by 2090 | (Obahoundje et al 2021b) | |||
| Change in Nangbeto HPP by +4.51% (RCP4.5) and −1.31% (RCP8.5) due to CC&LULCC by 2050 | Change in Nangbeto HPP by +14.66% (RCP4.5) and −1.01% (RCP8.5) due to CC&LULCC by 2090 | |||||
| Akosombo (1038 MW) Ghana | Main Volta | 1965 | CC&HP | Only 77% of hydroelectricity is generated under current development conditions. Only, 53% and 48% of the potential average annual hydroelectricity will be generated by the end of 2050 under intermediate and full development scenarios, respectively. | Only, 30% and 24% of the potential average annual hydroelectricity will be generated by the end of 2100 under intermediate and full development scenarios, respectively. | (McCartney et al 2012) |
| CC&HP | Hydropower demand coverage varies from 80% to 85% depending on the scenario (2011–2050). | (Amisigo et al 2014) | ||||
| Bui (400 MW) Ghana | Black Volta | 2014 | CC&LULCC&HP | Change in energy generation in the range of—54% to 40% depending on the scenarios. | (Obahoundje et al 2017) | |
| CC&HP | Hydropower demand coverage varies from 85% to 98% depending on the scenario (2014–2050). | (Amisigo et al 2014) | ||||
| Kompianga (14 MW) Burkina Faso | White Volta | CC&HP | Hydropower demand coverage varies from 75% to 100% depending on the scenario (2011–2050). | (Amisigo et al 2014) | ||
| Bagre (16 MW) Burkina Faso | Oti | CC&HP | Hydropower demand coverage varies from 78% to 95% depending on the scenario (2011–2050). | (Amisigo et al 2014) | ||
| Kossou (174 MW) Côte d'Ivoire | Bandama | 1972 | CC&WR | Change in annual flows: −3.33% by 2030s (RCP4.5). −13.33% by 2030s (RCP8.5). | (Soro et al 2019) | |
| Buyo (165 MW) Côte d'Ivoire | Sassandra | 1980 | CC&WR | Decrease in annual runoff by 27.7% and in ground water recharge 34.2% for the 2050s (A1B). | Decrease in annual runoff by 40.0% and in ground water recharge 45.8% for 2080s (A1B). | (Koua et al 2014) |
| Manantali (200 MW) Mali | Sénégal | 1988 | CC&WR | Change in average annual flows: [−8.1%; −33.4%] by 2050s (RCP4.5). [−1.3%; −56.8%] by 2050s (RCP8.5). | (Bodian et al 2015) | |
| Change in Senegal River flow: −8% by 2050s (RCP4.5) −16% by 2050s (RCP8.5) | (Bodian et al 2018) | |||||
| Kainji (800 MW) Nigeria | Niger | 1968 | CC&HP | Change in annual energy generation: +8.72% by 2035 (RCP4.5). +12.81% by 2035 (RCP8.5). | Change in annual energy generation: +8.63% by 2085 (RCP4.5). +24% by 2085 (RCP8.5). | (Oyerinde et al 2016) |
2.2. Hydropower information, hydroclimatic data, and satellite products
Information on hydropower plants (existing and planned) was extracted from Dams Atlas (http://globaldamwatch.org/data/) (Zarfl et al 2015) and was completed with measured data retrieved directly from hydropower plant managers (national companies of electricity and river basin authorities) in the region. This was a big gap: there was no place where those data were centralized or made public, and such efforts to gather multidisciplinary data around the dams and information from the different dam managers on how they operate revealed the challenges in the assessment of the impacts, in the sustainability of those infrastructures, and the barriers to performing interdisciplinary studies on the nexus between climate, land, hydropower, and water.
We plotted maps of the spatial distribution of hydropower plants with areas of significant change in precipitation, runoff, and normalized difference vegetation index (NDVI) to determine how each plant is exposed to past and future changes in climate and land cover in WA (figures 3 and 5, respectively). Specifically, we created a map of areas of change in precipitation (figure 3(a)) using the Climate Hazard Group Infrared Precipitation with Stations (CHIRPS) product (1981–2018). CHIRPS is a 30 year quasi-global rainfall dataset, stretching over 50° S–50° N (and all longitudes), covering the period 1981 to near-present and incorporating 0.05° resolution satellite imagery with in situ station data to create gridded rainfall time series for trend analysis and seasonal drought monitoring (Funk et al 2015). Figure 3(b) was adapted from Stanzel et al (2018) study to determine which hydropower plant is (or will be) located in an area with a significant projected decrease/increase in runoff. For this purpose, we adapted the map of the projected change in runoff over 2046–2065 relative to 1998–2014 from an ensemble of 15 regional climate models (RCMs) of coordinated regional climate downscaling experiment (CORDEX)-Africa and we added the locations of existing and planned dams.
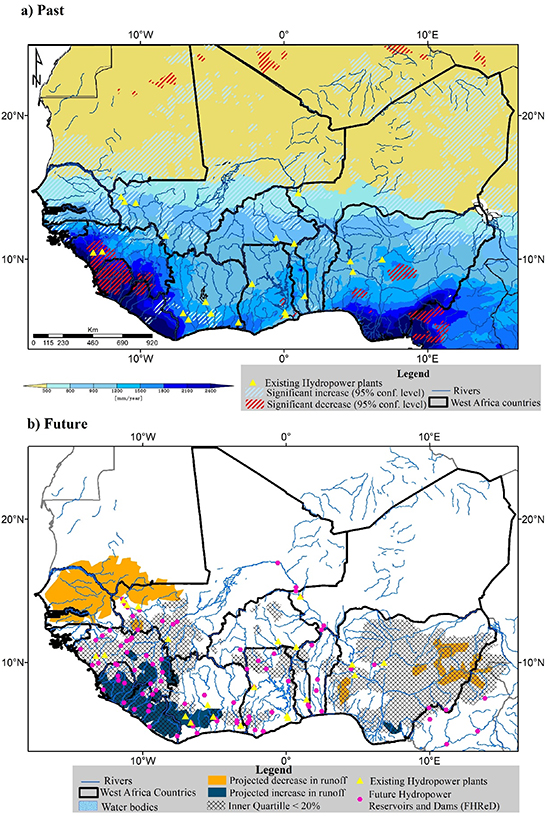
Figure 3. Hydropower plants (existing and planned) and climate changes: (a) past change in the spatial distribution of precipitation over 2000–2018 relative to 1981–1999 computed using CHIRPS dataset; (b) projected change in runoff over 2046–2065 relative to 1998–2014; adapted from Stanzel et al (2018). NB: Stanzel et al (2018) defined the 'inner quartile' as the difference between the upper quartile change and lower quartile change. Areas with high concordance in model projections are those where the inner quartile range for the projected change is smaller than 20%.
Download figure:
Standard image High-resolution imageWe then computed a map of areas of change in vegetation cover (figure 5) using the NDVI-3rd generation from the Global Inventory Monitoring and Modeling System (National Center for Atmospheric Research Staff (eds) 2018). This NDVI product is a monthly dataset covering the second semester of the 1981 year to the end of 2015 with a very high resolution (1/12°). A student test (t-test) was performed to detect areas of significant change between two periods in both precipitation (2000–2018 relative to 1981–1999) and the NDVI (2006–2015 relative to 1982–1991) dataset. Existing and planned dams are added in this figure to illustrate the potential linkages between land cover changes and hydropower.
Finally, in each section, we created flowcharts (figures 4 and 6) based on the literature review to summarize how climate change (precipitation and temperature) or LULCC may affect hydropower production. The last flowchart in figure 7 illustrates the main features of the climate, land, water, and energy nexus based on the literature.

Figure 4. Flowchart of climate change impacts on hydrology and hydropower. NB: dark red color indicates effects that are typically detrimental to hydroelectric production, and dark blue color shows effects that typically improve hydroelectric production potential. The yellow arrow exhibits the feedback effect of increasing evaporation due to a temperature rise.
Download figure:
Standard image High-resolution image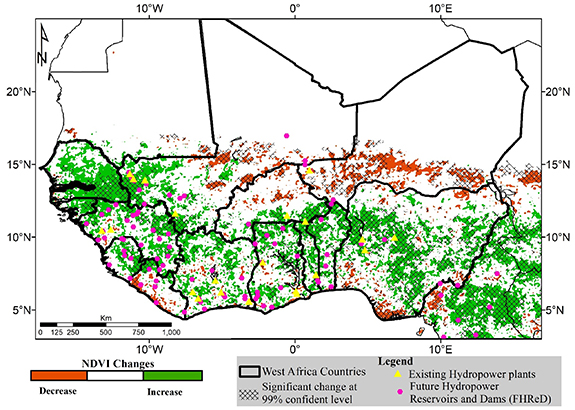
Figure 5. NDVI change over 2006–2015 relative to 1982–1991. NB: a student test (t-test) was performed to detect areas of significant change (99% confidence level) between two periods (2006–2015 relative to 1982–1991).
Download figure:
Standard image High-resolution image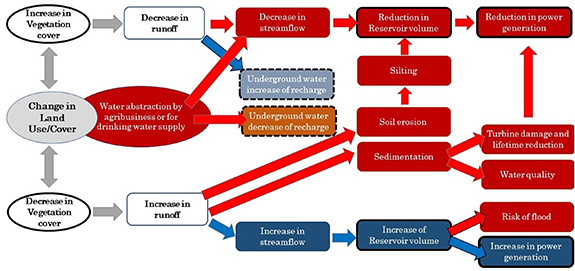
Figure 6. Flowchart of land use and land cover change effects expressed as decrease or increase in vegetation cover on hydropower generation. The red arrows and dark red boxes indicate detrimental effects to hydroelectric production, and the blue arrows and dark blue boxes represents effects that improve hydroelectric production.
Download figure:
Standard image High-resolution image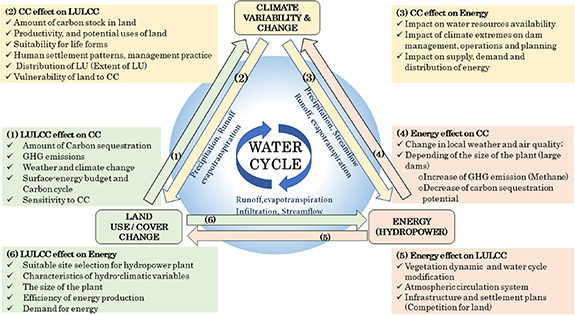
Figure 7. Flowchart of climate, land, water, and energy nexuses. The yellow arrows ((2) and (3)) indicate the impacts of climate change on LULCC and hydropower; the green arrows ((1) and (6)) show the effects of LULCC on climate change and hydroelectric powerplants; while the light pink arrows ((4) and (5)) indicate the influence of hydropower schemes on climate change and LULCC respectively. The boxes exhibit the nature of the nexus between the different components.
Download figure:
Standard image High-resolution image
3. Results
3.1. Impact of climate change on water resources and hydropower
The climate of the WA depends on the West African monsoon variability, the meridional movement of the inter-tropical convergence zone (ITCZ), as well as the position and intensity of the African easterly jet and the tropical easterly jet (Biasutti 2019). The ITCZ is the region where the hot and dry harmattan air mass from the Sahara in the north (northeasterly trade wind) meets the cool, moist monsoon air (southwesterly wind) from the South Atlantic. Between December and February, the ITCZ moves toward the Gulf of Guinea, and from March to November, it moves from the Gulf to the higher latitudes, even crossing some areas twice. Therefore, in the southern part of WA (i.e. the Guinea Coast), there are two rainy seasons (March–June and August–November) and two dry seasons (July and December–February). The northern part of the WA (i.e. the Sahel band) has one rainy season from July to September and a long dry season from October to June.
In the 1970s and 1980s, WA experienced the most severe drought recorded in the 20th century, with a 15%–40% drop in rainfall associated with a decrease in the number of rainy events (Le Barbé et al 2002, Nicholson 2013). Later, the inter-decadal variability in West African rainfall was attributed to large-scale changes in the Atlantic sea surface temperature, El Niño Southern Oscillation, and La Nina (Nicholson 2013), as well as regional and local-scale changes in land use and vegetation cover (Biasutti 2019).
The last 30 years have been characterized by greater interannual variability than the previous 40 years over the WA region in general, and in the Sahel subregion in particular (Taylor et al 2017). Since the 1990s, the rainfall intensity has increased over the entire WA domain, causing the north-eastern part (central Sahel) of the WA region to become wetter (Panthou et al 2013, Taylor et al 2017). Although the Sahel has seen a 'recovery' in rainfall since the 1980s, cumulative precipitation has not returned to pre-1960s levels and certain characteristics have changed (Biasutti 2019): rainfall events appear to be less frequent and have a shorter duration but greater intensity (Nicholson 2013). Indeed, the West African Sahel became wetter during the period 1981–2014 due to an increase in the number of rainy days, longer wet spells, and shorter dry spells (Bichet and Diedhiou 2018b, Didi et al 2020). Along the coast of the Gulf of Guinea, the change in rainfall between 1981 and 2014 was associated with less frequent but more intense rainfall events over both rainy seasons (Bichet and Diedhiou 2018a, Didi et al 2020). However, between 1970 and 1990, decreased rainfall in the southern region of WA affected the entire regional hydrological system (Mahe et al 2005a), as well as water-related sectors within the basins, namely, irrigation, domestic, livestock, and hydropower generation (Tossou et al 2017). Using the CHIRPS precipitation product, and after computing a Student's t-test at a 95% confidence level to highlight regions with significant changes, we confirm in figure 3(a) that the region above 11° N became significantly wetter during the last two decades (2000–2018), relative to the 1981–1999 period, whereas some parts of Sierra Leonne, Guinea, Liberia, and Nigeria exhibited a significant decrease. Among existing dams, only two are located in the Guinea-Conakry Republic (Garafiri and Kaléta) and two major dams in Ghana (Akosombo and Kpong) are located in areas that have experienced a significant decrease in precipitation. It has been reported that the Garafiri dam experienced issues during this period (World Bank 2017) and that the 1998 drought resulted in low water levels in the Akosombo reservoir, leading to an energy crisis in Ghana (Kabo-Bah et al 2016, 2018).
Projections of WA precipitation by the Coupled Model Inter-comparison project CMIP3 and CMIP5 archives showed an inter-model variation in both the amplitude and sign of change (Rowell 2012, Rowell et al 2016) which is partially attributed to the inability of global climate models (GCMs) to resolve convective rainfall. Projections indicate a decrease and increase in precipitation in the Western Sahel (Senegal) and the Central Sahel respectively in 2100, more or less intense depending on the scenario (Biasutti 2019). The Western Sahel is projected by 80% of the models to experience the strongest drying at 1.5 °C global warming, with a significant increase in the length of dry spells and a decrease in the standardized precipitation evapotranspiration index (Diedhiou et al 2018). In the regions of the Guinea Coast and Central Africa, most CMIP5 GCMs project a weak change in total precipitation associated with a decrease in the length of wet spells and an increase in heavy rainfall under a global warming of 1.5 °C (Diedhiou et al 2018).
RCMs involved in the CORDEX have shown acceptable performance in simulating the spatial and temporal distribution of the main precipitation and temperature features (Gbobaniyi et al 2014, Nikulin et al 2018). Despite the spread in the magnitude from one model to another (Nikulin et al 2018), the ensemble mean considerably improves the performance of most of the individual RCMs (Gbobaniyi et al 2014). Combining 19 RCMs of CORDEX, Kumi and Abiodun (2018) showed that the RCMs projected a delay of rainfall onset dates and shorter rainy seasons in the western and eastern Sahel under 1.5 °C and 2 °C global warming for the RCP4.5 and RCP8.5, respectively. Using 25 RCMs of CORDEX Africa, more than 80% of ensemble members agreed that the number of consecutive dry days will increase over the Guinea Coast, with a projected decrease in consecutive wet days at both 1.5 °C and 2 °C global warming levels (Klutse et al 2018).
The surface temperature over West Africa has increased over the last 50 years, in the range of 0.5 °C–0.8 °C between 1970 and 2010 (Riede et al 2016), with the increase in the temperature being greater in magnitude within the last 20 years than in the preceding decades. It was also found that the number of cold days and nights decreased, while the number of warm days and nights increased over the 1961–2000 period (Riede et al 2016). Since the 1950s, diurnal and nocturnal heatwaves over the Gulf of Guinea coastal regions intensified, becoming more pronounced after the 1980s (Ringard et al 2016). The rise in temperature has impacted all sectors, including water resources, energy demand, and production (Riede et al 2016). Temperature increases within the West African domain are projected to be higher than the global mean temperature increase, and heat waves are expected to be more frequent and lasting longer (Diedhiou et al 2018). This will lead to both an increase in the energy demand and evaporation of water in the reservoir needed for hydropower production, and will affect the performance of the plants if no appropriate investments are made to integrate hydroclimate services in the management system.
Regarding the discharge, a study with an ensemble means of 30 regional climate simulations of CORDEX models based on two scenarios (RCP4.5 and RCP8.5) showed that stronger decreases are projected for regions in the northwestern (−40%) and south-eastern (−10%) of WA, and pronounced increases are expected mainly for the southwest (+10%) over 2046–2065, relative to 1998–2014 (Stanzel et al 2018). Apart from the southwestern regions (Liberia, Sierra Leone, Guinea) where more than 75% of the 30 examined models project increases in runoff, the remaining regions where decreases or unknown trends in runoff are projected could make the future of existing and planned hydropower plants uncertain (see figure 3(b)). These decreases in runoff could affect all water consumption sectors, including existing and planned hydropower plants, and may lead to conflicts between users if no informed integrated water management system is used.
River flows are expected to decline by 15%–20% by 2020 and by 20%–40% by 2050 (Sylla et al 2018a). In transboundary basins such as Niger, Senegal, and Volta, river flows are expected to decrease in proportions varying between 5% and 34%, depending on the time horizon and location (Oyebande and Odunuga 2010, Sylla et al 2018a). Specifically, a multi-model GCM ensemble predicted a decrease of 8% (RCP4.5) or 16% (RCP8.5) in annual streamflow as soon as 2050 in the Senegal River Basin, and of 22% (RCP4.5) or 26% (RCP8.5) in the Gambia River Basin (Bodian et al 2018), with the Gambia River Basin being more affected in the near future. In the Guiers Lake in Senegal, it was found that climate change and population growth rate will pressurize water resource availability, leading to greater competition between agriculture and municipal demands (Djiby et al 2018). In the Volta Basin, all water demands (municipal, hydropower, and agriculture) may not be simultaneously met under any of the projected scenarios, including wet scenarios (Amisigo et al 2014). All listed countries rely on hydropower for electricity production.
Extreme climate events in past decades have severely affected hydropower systems in African countries such as Ghana, Kenya, Zimbabwe, and Tanzania, sometimes reducing plants to half of their output capacity (Cole et al 2014). In Ghana, energy production failures were frequently observed during the rainfall deficit period from 1990 to 2011, caused by low Akosombo dam levels, especially during the 1998 drought year (Kabo-Bah et al 2016). A decrease in mean rainfall with an increase in minimum and maximum annual temperatures was recorded at all weather stations, leading to increases in evaporation. In Togo, it was noted that the hydropower generation is more modulated by four main variables namely inflow to reservoir, water level, rainfall of the actual and the previous year (Obahoundje et al 2021a) which are function of climate system. The Kainji Dam in Nigeria has also faced the same challenges as consequences of changes in climate variables (Olofintoye and Adeyemo 2011, Salami et al 2015). The decline in hydropower generation at the Kainji Dam was associated with decreases in runoff (Salami et al 2015) and a drop in reservoir storage volume (Olofintoye and Adeyemo 2011).
Frequent flooding events in recent decades have affected the hydropower system in WA. The high occurrence of heavy rainfall events in 1999 over the Niger basin has led to exceedances of the Kainji, Jebba, and Shiroro dams' floodgates in Nigeria, causing deaths, socio-economic infrastructure losses, and several displacements (Oyebande and Odunuga 2010). The same issues were experienced in the Senegal Basin in the same year and the Ghanaian part of the Volta Basin in 2002. It has also occurred in the Yobe Valley in Nigeria in 1998 and 2001 (Oyebande and Odunuga 2010).
Existing peer review papers have shown that globally, hydropower generation (for plants operating today in Africa) is predicted to change very little by the year 2050 (Hamududu and Killingtveit 2012) but it may vary from one country to another. For instance, Ghana, Guinea, and Ivory Coast are projected in 2050 to observed a decrease by −1.6%, −2.9%, and −6.2% in hydropower generation, respectively, while Nigeria and Sierra Leonne may experience an increase of +0.4% and +6.1% respectively over the same period (Hamududu and Killingtveit 2012). Conversely, Turner et al (2017) predicted a reduction in most of the hydropower generation in WA countries (A2 and B1 SRES scenarios and different models) over 2040–2069 relative to the 1965–2000 period. They (Turner et al 2017) found that the following countries will experience the strongest negative change in hydropower generation: Guinea (−12.9%), Mali (−13.17%), Togo (−14.4%), Ghana (−14.5%), Burkina Faso (−15.3%), Côte d'Ivoire (−15.7%), and Nigeria (−15.8%).
Figure 4 summarizes the processes associated with climate impacts on surface hydrology and hydropower generation. An increase in precipitation may lead to a decrease in evaporation due to the loading of relative humidity in the atmosphere and an increase in river discharges and water levels, which then results in improved hydropower generation. Conversely, a decrease in precipitation will lead to a decrease in river discharge and an increase in evaporation due to a drier atmosphere, and therefore, will reduce the water available in the reservoir for hydropower generation. The temperature rise will increase evaporation, which may contribute to a decrease in the water level in the reservoir and negatively affect hydropower production. The change in precipitation should be considered from two perspectives: firstly, by looking at the basin scale (increase in precipitation will increase reservoir inflows); then by looking at the reservoir area (e.g. increase in temperature will lead to higher reservoir evaporation). However, this increase in evaporation may also contribute to an increase in atmospheric moisture (feedback), and therefore, to an increase in precipitation which can counteracts the negative effect. The relationship between precipitation and evaporation has been documented in WA but this requires further investigation. Projected increases in the variability of temperature and precipitation extremes could enhance the risk of flood and drought events, which may be detrimental to hydropower plant management and planning (Blacksher et al 2011). Additionally, the change in extreme compound events may also affect hydropower generation, but the key driver in these compound cases is precipitation, which will tend to raise the water level, and therefore favor hydropower generation, while the cold/dry or warm/dry events will negatively affect hydropower generation. In arid and semi-arid areas, evaporation losses due to an increase in temperature could represent a significant fraction of drops in water levels (Saggaï and Bachi 2018). In these drylands, the temperature may be a key driver. However, in both regions, wind, sunshine duration, and humidity gradient can modulate evaporation from reservoirs (Condie and Webster 1997). The issue is that the tropics, in general, are expected to experience increases in temperature and precipitation, while in WA, several uncertainties remain on future precipitation changes.
In addition to precipitation and temperature, there are additional factors that can directly or indirectly affect hydrological systems and thus hydropower generation. Oyebande and Odunuga (2010) and USAID (2013) concluded that the uncertainties associated with the impacts of future climate change on water resources in WA are compounded by many other factors. These include regional demographic factors, non-existing or inadequate water policies, poor infrastructure, inefficient water management systems, and inadequate joint management of basin resources. The current freshwater demand in WA for energy, agriculture, industry, and domestic use is expected to triple by 2025 (USAID 2013). This means that the above factors should be carefully considered when modeling water resources within a basin. It is also very important to carefully consider the effect of upstream socio-economic development on reservoirs while assessing the impacts of climate change on hydropower systems (de Souza Dias et al 2018).
3.2. Impact of land use and land cover changes on water resources and hydropower
In WA, the regions above 16° N are mainly covered by barren land, with a NDVI between 0 and 0.1 (0 < NDVI ⩽ 0.1). The Sahelian zone between 11° N and 14° N is covered by sparse vegetation (shrubs and grasslands or senescing crops) (0.2 < NDVI ⩽ 0.5). The Sudanian and Guinean zones have NDVI values of approximately 0.6–0.9, corresponding to dense vegetation. We computed and plotted in figure 5, the changes in NDVI over 2006–2015 relative to 1982–1992, and the significance test at a 99% confidence level. The central and eastern Sahel and Guinean (coastline) zones showed a statistically significant decrease in NDVI, while the Sudanian zone presented an increase in NDVI (see figure 5). Overall, this change is validated by existing studies in the region. For instance, between 1975 and 2013, total vegetation cover decreased by 1.6%, associated with massive net gains in croplands (107.8%) and settlements (140%) at the expense of natural vegetation (Barnieh et al 2020). It was discovered that human-managed LULC types have largely replaced natural LULC types. It is important to note that, most existing and planned hydropower plants are located in areas with a significant decrease of NDVI, which is not without impact on the hydrological system. Indeed, it has been reported that runoff extremes are increasing in most regions of the world at rates higher than precipitation extremes, due to LULCC (Yin et al 2018). As shown in the figure 4, this change in the runoff due to LULCC will influence the streamflow and the inflow and consequently, the hydropower generation.
Indeed, runoff extremes have been reported to increase in most regions of the world at rates higher than precipitation extremes due to LULCC (Yin et al 2018). Basins in WA are facing rapid changes in land use and land cover and have lost, or are losing large areas of their natural landscapes, which are being replaced by human-influenced extents dominated by agriculture, bush fires, and timber extraction (Vittek et al 2013, Akpoti et al 2016, Cotillon 2017, Obahoundje et al 2018). Between 1975 and 2013, the forest area decreased by 24.6%, while settlement and agricultural land coverage increased by 140% and 11.7% respectively in WA (Cotillon 2017). The size of vegetated areas continued to decline with decreasing rainfall and increasing temperatures, especially in dry regions.
The hydrological responses to LULCC vary with the region (Descroix et al 2018, Osei et al 2019). In the Black Volta sub-basin, LULCC between 2000 and 2013 contributed to an increase in the surface runoff and lateral flow by 27% and 19%, respectively, while the contribution of groundwater to streamflow has decreased by 6% due to land use change, along with a 4.6% increment in evapotranspiration due to rising temperatures (Akpoti et al 2016, Obahoundje et al 2017). At all scales in the Sahelian areas, runoff coefficients have generally increased along with river discharges, stimulated by a decrease in vegetation cover (Lienou 2013, Descroix et al 2018). Runoff has increased in Sahelian basins despite a 20%–25% decrease in observed rainfall during the period of 1968–1997 (Descroix et al 2018, Galle et al 2018) and an increase in dams constructed in the basins (Mahe et al 2005b). This increase in runoff and discharge despite the decrease in rainfall is called the 'Sahel paradox' and was first observed in small basins of Burkina Faso by Albergel (1987). Contrarily, a 15% reduction in rainfall in Sudan has led to a more intuitive reduction in runoff and annual discharges (Descroix et al 2018). In the latter region, the decrease of discharges has been two to three times greater than that of rainfall (Descroix et al 2018).
Over Sahel, in endorheic areas, the increase in runoff has led to an increase in the volume and duration of ponds (Moussa et al 2009, Gardelle et al 2010) and in some sites, this has led to an increase through the ponds of the underground water table; this was first found by (Leduc et al 2001) and documented by (Cappelaere et al 2009) and (Favreau et al 2009). In exhoreic areas, there is a linear relationship between rainfall, runoff and streamflow but there is not a connection between the rainfall, the runoff or the streamflow with the groundwater recharge (Mahe et al 2005b).
Over the southern region of WA, the decrease of vegetation cover may also contribute to decrease the soil water holding capacity and infiltration rate, leading to a decrease in the water table (Mahe et al 2005b). The reduction of the underground water recharge capacity or water table can cause a drastically dry season streamflow decrease, which in addition to the increase of evaporation due to rising in temperature, may severely affect the reservoir water availability for power generation in the warmer season when more energy is needed for cooling (e.g: increase of demand for air conditioning).
Increases in streamflow may lead to floods, which in turn may threaten hydropower infrastructure and electricity generation, as well as human security. The increase in floods observed in several WA rivers is associated with an increase in runoff, leading to higher rates of soil loss and erosion, contributing to silting in river beds and increasing the size of the rivers and reservoirs (Mahe et al 2005b, Sighomnou et al 2013, Mamadou et al 2015). According to Welde and Gebremariam (2017), the increase in bare land and agricultural areas in the Tekeze dam watershed in Ethiopia have resulted in increased annual and seasonal streamflow and sediment yield volumes. An increase in sediment yield volumes associated with increasing land use has also been observed in China (Du Watershed and Loess Plateau) (Yan et al 2013, Zuo et al 2016). Bissadu et al (2017) demonstrated that changes in rainfall intensity and land cover types are the core drivers of soil erosion, and Alkharabsheh et al (2013) found similar results in Jordan. Over Asia, Yang et al (2003) found that 60% of soil erosion was anthropogenically induced. LULCC for agriculture and urbanization within a basin will expose more land to soil erosion (Steger et al 2019). Silting due to soil erosion may affect water quality through sedimentation (Yan et al 2013, Zuo et al 2016), and may in turn damage turbines by blocking power intakes and through the abrasion of turbine blades, thus shortening turbine life. This increased sedimentation will subject hydropower projects to additional costs because dredging the rivers to ensure a suitable intake flow will become necessary to maintain some form of equilibrium (Blacksher et al 2011).
The potential impacts of land use and land cover changes on the Bui hydropower scheme in the Black Volta Basin under climatic change were investigated using the WEAP model from 2000 to 2040 (Obahoundje et al 2017). Evaluation using the WEAP model under wet and dry climate conditions showed that the combined effects of changes in land use/cover and climate will reduce the water available to all sectors of water demand, including the Bui hydropower facilities. The wet condition is considered as a 14% increase in rainfall and the dry condition as a 15% decrease in rainfall between 2012 and 2040. The results showed that under wet conditions and without LULCC, Bui hydropower energy production will decrease by 0.15% and will increase by 40.74% with LULCC. Under current conditions (from 2000 to 2012), a decrease of 2.49% and 23.2% was noted in simulations with and without LULCC, respectively. Under dry conditions, the LULCC and no LULCC scenarios will decrease Bui hydropower generation by 46.34% and 54%, respectively (Obahoundje et al 2017). The increase in land use within the Black Volta Basin is predicted to favor Bui hydropower generation in the near future. However, despite the positive effect of LULCC on the increase of runoff and streamflow and on hydropower generation, LULCC could also threaten hydropower plants with silting and sedimentation in reservoirs. Moreover, the effect of combined changes on the Bui scheme in the far future, as well as on other existing and future planned hydropower plants, is not well known. The consequences of anthropogenic land-use changes on hydropower have received little attention from policy makers and dam managers in WA, while integrating this land-change information is crucial for planning strategies, for efficient national and regional adaptation policies, and for sustainable development (Lienou 2013). Based on the literature review, the processes associated with the links between LULCC and hydropower are shown in figure 6.
3.3. Nexus between climate, land and hydropower in WA
Based on the literature review, table 1 summarizes the existing studies on the potential impact of climate change and land use/cover dynamics on the main hydropower plants of WA. Apart from the hydropower plants listed in table 1, there are other dams that have not been assessed from the perspective of this study (Félou and Sélingué in Mali, Taabo in Côte d'Ivoire, Kaléta in Guinea, Shiroro, and Jebba in Nigeria); consequently, there are no relevant references identified during this review. Most of the hydropower plants constructed in the WA region are multi-purpose dams used for domestic water supply, irrigation, recreation, and tourism. It is worth noting that there are a few studies on future hydropower changes under climate change and LULCC, while this sector and the related infrastructure are very important for the sustainable development of African countries. Table 1 reveals that a decrease in production is projected for most hydropower plants (only the main dams are shown here). All the hydropower plants located in the Volta Basin (Bagre and Kompienga in Burkina Faso; Bui, Akosombo, and Kpong in Ghana), Sassandra (Buyo), and Bandama (Kossou) may not be able to fully operate to satisfy the rising energy demand. This may negatively affect all associated socioeconomic sectors. In the Mono basin (Togo-Benin), uncertainties in the projected rainfall did not allow for a robust assessment of the future change in hydropower production of the Nangbeto plant. Nevertheless, the hydropower plants located in the Niger River basin (Kandadji in Niger and Kainji in Nigeria) are likely to observe increases in their future power generation. However, plant managers have to prepare themselves to cope with the growing risk of flooding, which may affect the dam and downstream dwellers, as observed over the last 30 years in Niger and Nigeria, where frequent river overflows regularly flooded homes and infrastructure.
Figure 7 illustrates and summarizes the interactions between climate, land, water, and energy. Below, we describe how, in the existing literature, different interactions are documented in WA:
Land use/cover effects on climate change (1): LULCC are major factors contributing to climate change through GHG emission volumes and carbon sequestration (Devaraju et al 2018). LULCC can affect rainfall (Pielke et al 2002) and hydroclimate systems (Oki and Blyth 2012). Bamba et al (2015) showed a linear relationship between precipitation and NDVI in the Sudanian savannah region of WA over the last three decades. Additionally, it has been demonstrated that the presence of forest, tall grass, and short grass savanna at the Sahel–Sahara interface tends to decrease the mean summer surface temperature, while afforestation options tend to increase the precipitation substantially for the whole Sahel region of WA (Diba et al 2018). The predicted decrease in temperature is associated with strengthening and weakening of the latent and sensible heat flux, respectively, whereas the increase in precipitation is accompanied by an increase in atmospheric moisture and strong interannual variability over the whole WA region (Sylla et al 2016, Diba et al 2018). Additionally, LULCC may impact regional and global climate through the surface energy budget (Pielke et al 2002). Decreases in vegetation cover may increase the land surface temperature because of reduced evapotranspiration. Conversely, forests and natural wetlands tend to decrease the temperatures in Africa. Although LULCC can lead to climate change, it is strongly sensitive to climate.
Climate change effects on land use (2): Voortman (1998) demonstrated that the WA ecological patterns (spatio-temporal distribution of land cover) have drastically changed due to climatic conditions with a latitudinal shift of isohyets towards the south associated with a general reduction in average precipitation. Scheiter and Savadogo (2016) confirmed that climate change is expected to displace large areas of savannah in WA by promoting transitions to wood-dominated vegetation, due to the fertilizing effects of carbon dioxide. Additionally, the uncertainties of rainfed agricultural productivity may lead to an increasingly irrigated agriculture around the reservoirs of dams, which will consequently add pressure to the water stored for energy generation.
Climate change effects on hydropower energy (3): The energy demand may be affected by climate change (Wilbanks et al 2008), particularly by changes in extreme precipitation and temperature, and compound extreme climate events. Hydropower is particularly vulnerable to changes in precipitation and temperature patterns (Oyebande and Odunuga 2010, IPCC 2011, Hamududu and Killingtveit 2012). This review study showed in the previous section that, in the past, WA hydropower plants have experienced the effects of climate change on their stored water levels as well as on their power generation (Olofintoye and Adeyemo 2011, Salami et al 2015).
Hydropower energy generation effects on climate (4): Barros et al (2011) showed that depending on the size of the dam, it may be a significant source of GHG emissions due to the long-term decomposition of devastated forests and the geographical location that can be inundated by the water dammed up at hydropower plants. It is worth noting that the emissions from hydropower sources in WA countries are ignored in the GHG emissions inventory from the Intergovernmental Panel on Climate Change (IPCC), while this emission source is very important and significant in tropical regions (Fearnside 2015). We did not find any study assessing the impact of hydropower on WA climate, but we found two papers that contributed to documenting how hydropower plant construction can modify the mesoscale hydroclimatic patterns of a given watershed in WA (Amoussou et al 2012, Faye et al 2015).
Hydropower energy effects on land use/cover (5): Land cover is degraded by the installation of hydropower infrastructure and by infrastructure for energy supply and distribution (Dale et al 2011). Deforestation or vegetation devastation for hydropower plant buildings can first contribute to modifying the land surface albedo, which influences the atmospheric circulation system and rainfall, leading to changes in vegetation dynamics (Charney 1975). We did not find any scientific papers assessing the impact of hydropower on land cover and land use in WA, but we found several reports on environmental and social impact assessment of hydropower projects raising this issue, highlighting the changes in the landscape and the extent of flooded areas caused by dam construction (Burgeap Environmental Consultancy 2006, Government of Ghana 2007).
Land use effects on hydropower energy (6): The characteristics of a landscape determine whether hydropower infrastructure can be established (Dale et al 2011). Any changes in land cover in the basin may result in changes in precipitation and discharge, which may affect the efficiency of the hydropower plant. For instance, Obahoundje et al (2018) showed how LULCC may influence the hydrology of three transboundary basins in WA, and Kouame et al (2019) illustrated how LULCC impacted the Kossou hydropower generation.
4. Conclusion
Hydropower is the main renewable energy source for electricity generation in WA and is essential for the mitigation of climate change. The effects of climate change and land use/cover dynamics on hydropower generation in the WA region were assessed and synthesized. It is worth noting that, among the available literature on this specific topic, several papers led by African institutions are not indexed in Scopus or Web of Science. There are also several reports from national/regional/international institutions that are also of interest to this study, but they are only indexed in Google Scholar. To describe the different interactions between climate, land use/cover, water, and hydropower generation in WA, we considered the main findings from papers in both Scopus and Google Scholar. This approach helped to draw the synthetized flowcharts at the end of each section. To achieve the specific aim of this paper, we selected 300 papers from Scopus and 400 papers from Google Scholar only 96 papers issued after the year 2000, with 66 papers both found in Scopus and Google Scholar and only 30 from Google Scholar.
The analysis of existing peer review papers reveals that the effects of climate change on hydropower systems affect almost all existing plants in WA due to the change and variability of precipitation over large areas of the region, and due to the increase in temperature over the entire region. Precipitation variability and extreme events such as droughts and floods have caused many hydropower plant disruptions over the last 30 years. Future projections agree on the rise in mean temperatures, but precipitation changes are uncertain, and the influence of this change on streamflow in major WA river basins is very uncertain. The change in both variables may affect the runoff and river discharges, depending on the area and land use (ECREEE 2017), and climate change may considerably affect water demand sectors, including hydropower plants within river basins. West African rivers are likely to face severe freshwater shortages, leading to competition among water-use sectors and riparian residents. An increase in temperature will considerably increase crop water and irrigation demand (Sylla et al 2018b). Many hydropower plants will have to adjust their operations in response to the extreme water conditions associated with the projected longer-lasting dry spells and heat waves. This will impact not only energy production but also electricity demand, transmission, and distribution (van Vliet et al 2016).
In this review, we found that most planned dams are located over regions (south–west of WA) where a significant increase in runoff is projected to be favorable for hydropower production. However, it is not clear how LULCC will evolve in the future, and there are uncertainties in future climate variability. This suggests that there is a need to assess and understand the combined effects of climate change and variability and LULCC in different basins to reduce the risks of local floods and for sustainable management and planning of hydropower production.
It was also shown that apart from climate change, there are additional factors such as water abstraction for food and LULCC, which can affect the amount of water available for hydropower generation. Indeed, WA countries are exposed to LULCC with increases in settlement and agricultural areas and reductions in vegetated areas. These changes are projected to intensify in the future owing to population and socioeconomic growth rates. The literature review showed that LULCC in WA may increase streamflow (in reducing the infiltration rate), which may improve water availability and favor hydropower generation. However, this increase in LULCC may lead to soil erosion and siltation, with the potential to reduce reservoir capacity, increase sediment yields, and raise the riverbed. Silting associated with increases in streamflow can block hydropower water intakes and cause turbine abrasion, and may intensify the risk of floods and threaten hydropower infrastructure. Unfortunately, such risks have not yet been well documented in the WA region.
Due to the Paris Agreement, major investments in hydropower and dam construction projects are planned for the WA region. However, it is crucial to highlight that dam construction can also contribute to changes in land use and land cover and modify the surrounding climate and precipitation patterns, as well as the hydrological dynamics of the river (Degu et al 2011). This can have a significant impact on water availability (Amoussou et al 2012, Faye et al 2015). The construction of dams, coupled with rising temperatures, may also favor the development of pest species such as water hyacinth, which is harmful to hydropower generation systems. This has already been observed in the Volta River basin, where the construction of multipurpose dams for hydropower and irrigation has reduced the flow of the river system, triggering an increase in the abundance of water hyacinth (Honlah et al 2019). Indeed, the water hyacinth can disrupt water abstraction facilities, obstruct hydroelectric turbine intakes, irrigation channels, and watercourses, causing siltation and flooding as well as high water loss through evapotranspiration.
Considering the uncertainties on the future climate and LULCC, improving hydropower modeling and understanding and modeling the complex nature of interlinkages between climate land water, and energy are essential for the efficient management of existing dams, for sustainable use of each resource, and for the viability of future hydropower projects (Hermann et al 2012, Howells et al 2013). In response to this, research for the development of climate services integrating the climate-land-water-energy and food nexus is crucial to achieving sustainable development goals. In addition to extensive scientific research on the nexus between climate, land, water, and hydropower at the local level, we also suggest that riparian states in the various catchments encourage anti-erosion farming practices that can impact the inflow to reservoirs to mitigate the negative effects of LULUCC.
Acknowledgments
The authors thank the Institute of Research for Development (IRD, France) and Institute of Geosciences for Environment (IGE, University Grenoble Alpes) for providing the facility (the RCM Platform) to perform this study at the University Felix Houphouët Boigny (Abidjan, Côte d'Ivoire) and the IT support funded by IRD/PRPT contract. This study was implemented at the national high performance computing center of Côte d'Ivoire (Centre National de Calcul de Côte d'Ivoire, CNCCI). The support for the investigation with new multidiscpliplinary data was possible thanks to the Belmont Forum collaborative actions on transdisciplinary research for pathways to sustainability.
Funding
The research leading to this publication is co-funded by the NERC/DFID 'Future Climate for Africa' programme under the AMMA-2050 project, Grant No. NE/M019969/1 and by IRD (Institut de Recherche pour le Développement; France) Grant Number 'UMR IGE Imputation 252RA5'. The support for the investigation with new multidiscpliplinary data was possible thanks to the SUSTAINDAM project co-funded by Agence National de la Recherche (ANR, France; Contract n° 400914/00) implemented in the frame of the Belmont Forum collaborative actions on transdisciplinary research for pathways to sustainability.
Data availability statement
The data that support the findings of this study are openly available at the following URL/DOI: https://data.chc.ucsb.edu/products/CHIRPS-2.0/global_daily/netcdf/p05/.
Conflict of interest
The authors declare no conflict of interest.