

Abstract
Greening of the Earth is observed during the past several decades and both climatic and non-climatic factors drive this process. However, the greening spatio-temporal patterns and the role of human activities such as agricultural intensification in hyper-arid regions remain unclear. This study aimed to (a) reveal the greening pattern in China's southern Xinjiang using satellite estimations of normalized difference vegetation index and leaf area index data during 1982–2019, and (b) examine the impacts of human activities in terms of land use land cover (LULC) data. Our multi-decadal analysis is ideal to reveal long-term trends and support a better understanding of the anthropogenic effects in this hyper-arid and endorheic region. The results showed that vegetation as a whole increased significantly in southern Xinjiang and the greening rate of cropland was much higher than the other LULC types. Significant greening was found over >90% of cropland, while insignificant changes and browning trends were found over nearly half the area of the other LULCs. The proportion of greening areas was more than 80% within 1 km from human-dominated areas while the proportion decreased to 40% with distances >15 km. The spatial heterogeneity of the greening indicated that, despite widely reported beneficial effects of warmer and wetter climate for a general greening trend, human activities could be the dominant factor modulating the greening rates disproportionately over different LULCs in arid and hyper-arid areas.
Export citation and abstract BibTeX RIS

Original content from this work may be used under the terms of the Creative Commons Attribution 4.0 license. Any further distribution of this work must maintain attribution to the author(s) and the title of the work, journal citation and DOI.
1. Introduction
Satellite observations show that the Earth and the northern hemisphere in particular are greening, manifested by a significantly increased vegetation index of the land surface during the past decades (de Jong et al 2012, Mao et al 2016, Zhu et al 2016). Approximately one-third of the global vegetated area was greening during 2000–2017 and only 5% was browning (Chen et al 2019). Normalized difference vegetation index (NDVI) and leaf area index (LAI) are indicators of vegetation change and dynamic monitoring widely used at regional and global scales (Walker et al 2009, Gandhi et al 2015, Buitenwerf et al 2018, Chen et al 2019, Zheng et al 2021). The magnitude of NDVI and LAI shows the greenness coverage over an area, with higher values indicating 'green vegetation' and annual increase showing a greening trend, and vice versa for browning. Despite fundamental differences between NDVI and LAI, the former being descriptive and the later biophysical indicator of plant density and growth, these two indices can both be used complementary with each other to reduce the uncertainty of the data. The simplicity and the global availability make these indices suitable for long-term studies of vegetation dynamics at large scales (Gandhi et al 2015, Mao et al 2016).
Vegetation change can be observed as a proxy of climate variability due to its sensitivity to temperature and precipitation (Schwartz 1998, Bradley et al 1999). However, satellite-observed vegetation change, such as greening or browning, is a complex and integrative result of many climatic and non-climatic processes which also interact with each other (Buitenwerf et al 2018). Identifying the drivers of observed greening is thus a great challenge. On a global scale, earth system models (ESMs; Alessandro et al 2013, Zhu et al 2016) attribute the LAI increase to increased atmospheric CO2 which acts as a 'fertilizer' to the photosynthesis apparatus. However, ESMs perform poorly when predicting the spatial pattern of observed greening, especially on a regional scale (Mao et al 2016, Buitenwerf et al 2018), which indicates processes other than climatic and atmospheric circulation to contribute to the regional greening patterns, for example, human activities. Land use land cover (LULC) types show the integrated results of natural conditions and human land management (Ostberg et al 2015) and can reflect the intensity of human activities. Previous studies pointed to land use management as a notable contributor to the greening process in China (e.g. Chen et al 2019), and trend-attributed regional investigation was recommended by a recent study of global vegetation (Cortés et al 2021). These and other previous studies mainly focused on semi-arid to humid areas in monsoon-influenced regions, including those of China, where vegetation cover is generally high. Few studies have investigated the greening pattern in arid and hyper-arid areas where conserving and expanding vegetation are constrained by the limited water resources and agriculture is the main human activity. For these regions, it can be assumed that human activities modulate the land surface processes such as the greening patterns in different LULC types.
Xinjiang Province, an area of about 1.6 million km2 in Northwest (NW) China under arid climate and water-limited conditions, became greener since the 1980s (Piao et al 2015, Liu et al 2018), making it a particularly interesting region for detailed investigation. More greening areas were found in southwestern (Tarim Basin) than northern Xinjiang (Du et al 2015), implying on the high importance of regional analysis. The greening in NW China appears strongly related to the increase in local temperature and especially precipitation (Zhao et al 2011, Fang et al 2013, Liang et al 2015, Liu et al 2018)—the 'warming-wetting' trend (Wu et al 2019, Qian et al 2020). In the Hexi Corridor, NW China, a strong relationship between NDVI trends and LULC change was found, with human-dominated areas expanding sharply at the cost of excessive consumption of natural resources and reduced ecosystem services, ultimately inducing browning (Guan et al 2018). However, the timescale of the previous investigation was rather short (2000–2015) to evaluate the long-term trends without systematic errors and with limited knowledge about agricultural management in a hyper-arid area. The Tarim Basin is the biggest endorheic basin in China and covers more than 90% of southern Xinjiang where approximately 10 million population lives on agricultural production, including farming and animal husbandry; it is also a typical hyper-arid area and has the largest desert in China (Taklamakan) where water resources are the main limitation of vegetation growth. Therefore, the long-term vegetation dynamics and the drivers in this hyper-arid region are especially important for a clearer understanding of the anthropogenic impacts on the greening process and sustainable development.
Human activities such as agricultural land expansion and irrigation in the hyper-arid southern region of Xinjiang have been pointed as a factor for maintaining vegetation greenness (Liang et al 2015, Liu et al 2018). Consequently, more water consumption for agricultural land covers with high cropping densities over a long time period might make greening prominent in other land covers and human-dominated surrounding areas. However, it remains unclear whether the human activities disproportionately modulate the greening patterns under a long-term and continuous agricultural development. To this end, the current study characterizes the greening patterns across different land covers such as forest, grassland, and cropland and analyzes greening rates as a distance matrix surrounding the human-dominated areas to examine disproportionate greening and possible modulations. The analysis was conducted on long time series with almost 40 years of data, from 1982 to 2019, which increases the robustness for calculating trends and depicting mean patterns. The results may reveal important processes associated with greening besides climatic factors and imply whether agricultural intensification supports the observed land surface greening process in arid and hyper-arid areas, which can provide helpful information for scientists and managers to target sustainable development in water-limited areas.
2. Data and method
2.1. Study area
The study area is southern Xinjiang, Xinjiang Province, China (longitude 73.5° E–93.8° E, latitude 34.3° N–43.6° N; figure 1). Southern Xinjiang is dominated (>60%) by sand and bare land/rock (the Taklamakan Desert) and the mean annual potential evapotranspiration (>1000 mm) is much higher than precipitation (about 100 mm or less). The main natural vegetation is grassland (approximately 26% of the total area), whereas oases (approximately 3% of the total area) are mostly covered by irrigated crops such as cotton.
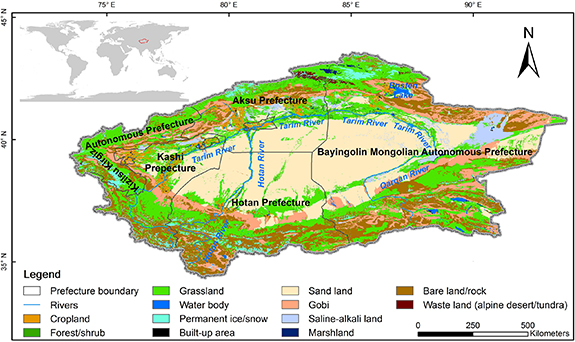
Figure 1. Spatial distribution of land use land cover (LULC) in southern Xinjiang study area, determined by the most frequent LULC type among data in 1990, 1995, 2000, 2005, 2010, 2015, and 2020.
Download figure:
Standard image High-resolution image2.2. Data collection
The global inventory modeling and mapping studies (GIMMS) datasets of third-generation NDVI3g (Pinzon and Tucker 2014) the USA National Oceanic and Atmospheric Administration (NOAA) climate data record (CDR) of advanced very high resolution radiometer (AVHRR) NDVI dataset, version 5 (Vermote et al 2019), and LAI3g (Zhu et al 2013) from 1982 to 2015 were used in this study (table 1). These data provide the longest available vegetation index data on a global scale (the first year 1981 with half-year data availability was excluded). The NDVI3g time series is an improved 8 km NDVI dataset produced by AVHRR instruments (Pinzon and Tucker 2014). The CDR NDVI dataset contains gridded daily NDVI with a longer period to present, derived from the NOAA AVHRR surface reflectance product at a resolution of 0.05° and computed globally over land surfaces (Vermote et al 2019). The LAI3g dataset was generated by combining GIMMS NDVI3g and moderate resolution imaging spectroradiometer (MODIS) LAI products with the feed-forward neural network algorithm (Zhu et al 2013).
Table 1. Information on the satellite products used in the present study.
| Data | NDVI | LAI | LULC | ||
|---|---|---|---|---|---|
| Provider | GIMMS, NASA Pinzon and Tucker (2014) | CDR, NOAA Vermote et al (2019) | Zhu et al (2013) | IGSNRR,CAS Xu et al (2018) | |
| Satellite | AVHRR | AVHRR | AVHRR; MODIS | Landsat TM/ETM | |
| Resolution | Temporal | 15 d | Daily | 15 d | 5 years |
| Spatial | 8 km | 5 km | 8 km | 1 km | |
| Period | 01 1982–12 2015 | 01 1982–12 2019 | 01 1982–12 2015 | 1990–2020 | |
Notes: NDVI, LAI, and LULC are, respectively, normalized difference vegetation index, leaf area index, and land use land cover. GIMMS, NASA, CDR, NOAA and IGSNRR, CAS are, respectively, global inventory modeling and mapping studies, US National Aeronautics and Space Administration, climate data record, US National Oceanic and Atmospheric Administration and Institute of Geographic Sciences and Natural Resources Research of the Chinese Academy of Sciences.
In order to describe greening patterns, i.e. greening rates in different vegetated lands, the China's multi-period LULC remote sensing monitoring data set (Xu et al 2018) was used (table 1). These data are available for the period 1990–2020 at a 5 years interval and a spatial resolution of 1 km and have already been used in comparative regional studies of greening and browning (Zhang et al 2020).
2.3. Data preprocessing
Monthly NDVI and LAI were composed by the maximum value composite method (Du et al 2015) to minimize cloud contamination and were then averaged over the growing season for each year as annual mean NDVI and LAI. As the growing season likely increases due to warmer climate, for example, earlier leaf emergence or shifts in sowing and harvest dates (Zeng et al 2011, Fridley 2012, Park et al 2016), we fixed the growing season from April to November to cover most crop types in southern Xinjiang, a region experiencing a significant temperature increase since 1982. The annual mean NDVI and LAI data were resampled to the 1 km spatial resolution of the LULC data. As a result of paired comparison of two NDVI data and LAI data, pixels with annual NDVI lower than 0.1 for NDVI3g, annual NDVI lower than 0.13 for CDR NDVI, or LAI equal to 0 were regarded as non-vegetated land in respective data processing and thus not considered in the analysis.
The original LULC dataset was reclassified by merging similar classes of cropland, grassland, waterbody, built-up area, and other lowly vegetated lands (called 'others', including sand, Gobi, saline-alkali land, and bare land/rock) and omitting classes with an area less than 1% of the total pixel area. Finally, four major LULC types were used, i.e. cropland, forest/shrubs, grassland, and others. Because of the LULC dynamics, the majority composite method (i.e. the most frequent LULC type of each pixel) was used to assign a representative LULC type of each pixel and compose a representative map for the 1990–2020 period (figure 1). The representative LULC was used for identifying the greening patterns of different LULC types because the differences between each year's LULC and representative LULC were small (data not shown).
2.4. Trend analysis and greening pattern detection
In medium- to long-term analyses of satellite data, linear regression modeling can help to reveal the directions and the rates of land surface greenness change (de Jong et al 2012, Liu et al 2018). Positive and negative slopes indicate greening and browning trends, respectively, and their absolute values depict the rates during the study period:
where  is the changing rate of
  (either NDVI or LAI);
  is the length of time series, i.e. number of years and
  is year.
In order to evaluate how significant the NDVI and the LAI trends are based on the 1982–2015 data, we used F-test (equations (2) and (3)) and deemed a significant increase (greening trend; P < 0.05), no significant change (stabilization; P > 0.05) and a significant decrease (browning trend; P < 0.05):

where p is the possibility of the item change trend according to the F-test statistic, F value; Fv(df1, df2) is the random variable with an F distribution and degree of freedom: df1, df2.
For more specific trend detection in NDVI and LAI time series, the locally weighted scatterplot smoothing (LOWESS) regression method was used, with model parameters determined empirically (Chu et al 2018). It is a regression tool used for analyzing time series by fitting a smooth line through the time scatter plot, assessing the relationship between variables, and foreseeing trends. The procedure involves setting a smoothing parameter, i.e. a fraction of the total number n of data points used in each local fit (set to 0.49), and iterative reweighting (set to 3) to provide robust fitting when there are outliers in the data.
In order to distinguish between greening and browning and their trends in different vegetated lands, two area indexes were compared between vegetated classes, i.e. relative area (RA) and contribution to greening (C; equations (3) and (4)), the former showing the area percentage of greening and browning in each LULC type and the latter depicting the area percentage of each LULC type in increased NDVI or LAI:

where  is the sum of increased NDVI or LAI in the LULC type;
  is the summed slopes of greening area in the
  LULC type;
  is the length of time series;
  is the spatial resolution (
 ).
).
2.5. Distance analysis
The influence of human activities on the greening patterns was of particular interest in this study. The relation between greening rate and distance to human-dominated areas was investigated. The LULC map in 1990, i.e. the first year of available LULC data, was used as the baseline map to estimate the distance to human-dominated areas. A series of buffers ranging from 1 to 40 km with 1 km increment near cropland and built-up area were designed in a Geographic Information System (GIS) environment. The proportion of area (POA) with greening, stabilization, and browning lands was calculated within each 1 km buffer. Consequently, the POA in greening and browning lands was shown as a function of the distance from the human-dominated area.
3. Result
3.1. Spatial characteristics of NDVI and LAI changes
The spatial distribution of the mean and the trend values based on the annual data from 1982 to 2019 for NDVI and to 2015 for LAI are shown in figure 2. Compared to LAI, vegetated area was larger according to the mean NDVI data and corresponded well to the GIMMS NDVI result (figure S1 available online at stacks.iop.org/ERL/17/044012/mmedia) based on the threshold 0.13. Greenness according to NDVI appeared mostly in the farming areas nearby rivers or reservoirs mainly in the north and the west of the study area (figures 2(a)–(c)). The greening processes were mostly concentrated in the oases (figures 2(b)–(d); consisting mostly of farming areas, while browning processes, i.e. NDVI trend values lower than zero, were scattered in the northern and the southern grasslands (figures 2(b)–(d)). The area under greening, stabilization (no change), and browning covered, respectively, 52.8%, 40.2%, and 7.1% of the total vegetated areas according to NDVI, and corresponding values according to LAI were 51.8%, 45.1%, and 3.2%.
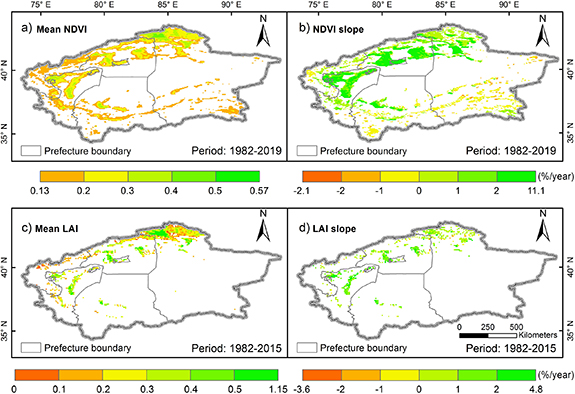
Figure 2. Spatial distribution of annual NDVI and LAI means and their linear slopes (excluding pixels with no significant changes) during the past three decades for southern Xinjiang study area. Slope values are shown as the relative percentages to NDVI of the base year, 1982. See table 1 for data description and abbreviations.
Download figure:
Standard image High-resolution image3.2. Temporal changes of NDVI and LAI
Cropland increased rapidly in the study region at the cost of decreasing mostly grassland, whereas the other LULC types (including land surfaces of sand and desert, saline-alkali land and bare land/rock) were relatively unaffected throughout the past three decades (table 2). The NDVI and the LAI results both showed comparable trends according to both the linear and the LOWESS regression models even during the different periods (figures 3 and S2), with different fluctuations throughout the past 30–40 years. Vegetation coverage increased significantly (P < 0.01) in southern Xinjiang as a whole and a three-section trend could be observed from the LOWESS regression results, i.e. no change from the 1980s to 1990s, significant greening from the mid-1990s to 2010, and a shift to browning after 2010. The greening in cropland appears to have happened much faster compared to the other LULC types, while the greening of the other sparsely vegetated covers was unstable and minor.
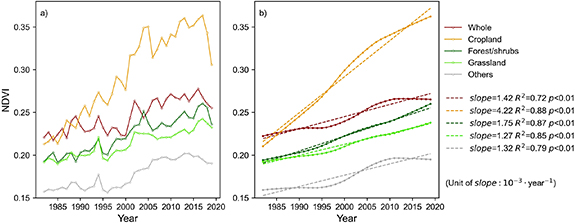
Figure 3. Normalized difference vegetation index (NDVI) time series (a) and their regression (b) from 1982 to 2019 for southern Xinjiang study area for different land use land cover types, where 'others' include other lowly vegetated lands. On plot (b), the dashed line is the general linear regression model (the slopes and correlation coefficients shown on the right), and the full line is derived from the LOWESS regression model (parameters set as fraction = 0.49, iterations = 3).
Download figure:
Standard image High-resolution imageTable 2. Area changes of different Land Use Land Cover (LULC) types from 1990 to 2020 in southern Xinjiang study area.
| Year LULC | 1990 (km2) | 1995 (km2) | 2000 (km2) | 2005 (km2) | 2010 (km2) | 2015 (km2) | 2020 (km2) | Slope (km2 yr−1) | R2 | Significance |
|---|---|---|---|---|---|---|---|---|---|---|
| Cropland | 16 803 | 16 929 | 18 493 | 21 096 | 21 842 | 25 700 | 29 142 | 413.6 | 0.934 | P < 0.01 |
| Forest/shrubs | 9187 | 9546 | 9659 | 9384 | 9208 | 8984 | 8833 | −18.8 | 0.475 | P > 0.1 |
| Grassland | 196 692 | 193 504 | 190 488 | 188 769 | 188 695 | 186 621 | 184 264 | −377.5 | 0.952 | P < 0.01 |
| Other lowly vegetated areas a | 444 824 | 447 023 | 447 637 | 447 074 | 446 709 | 445 593 | 457 212 | 238.4 | 0.381 | P > 0.1 |
| Built-up areas | 1102 | 898 | 1006 | 1078 | 1174 | 1548 | 2141 | 32.8 | 0.672 | P < 0.05 |
a Other lowly vegetated areas include land surfaces of sand, Gobi, saline-alkali land and bare land/rock.
3.3. Spatial clustering of greening
The relation between vegetation coverage and vegetation change rates showed that areas with higher NDVI and LAI had higher greening rates (figures 4(a)–(d)) and the 'green' LULC types (cropland, forest/shrubs, grassland) had faster greening (figures 4(b)–(e)) compared to the others. However, forest/shrubs and grassland had relatively low greening rates compared to cropland, which was even smaller than others according to the LAI data analysis. The regression coefficient between the slope of NDVI and LAI and their mean value was lower (figure 4(c)), and the significance level was also reduced after excluding the cropland pixels (figure 4(f)). Therefore, the greening in southern Xinjiang could be described with spatial clustering as 'greening in green land', and cropland playing an important role in the rapid greening process.

Figure 4. Relation between slopes and mean values of NDVI and LAI with, respectively, included (a)–(d) and excluded cropland pixels (b)–(e), and comparison between mean values and slopes for different LULC types according to NDVI (c) and LAI (f). The analysis was conducted on all pixels with NDVImean
 0.13 (13 294 pixels) and LAImean
 0 (1385 pixels) calculated from 1982 to 2019 for NDVI and 2015 for LAI over southern Xinjiang study area. See table 1 for data description and abbreviations.
Download figure:
Standard image High-resolution image3.4. Patterns of greenness changes in different land use land cover
Greening was the main status of cropland and forest/shrubs according to the NDVI analysis while both greening and stabilization covered nearly half of the grassland area according to the NDVI and the LAI analysis (figure 5). Despite certain discrepancies in the RAs, stabilization and browning trends covered >50% areas of grassland and other LULC. Cropland and grassland contributed the most to the increased vegetation indexes. Specifically, grassland played a more important role in NDVI increase, which was well reflected in the two NDVI data (figures 5(b) and S3), while cropland played an important role in LAI increase (figure 5(d)). Given the small area of cropland (around 3%) compared to grassland (26%) among vegetated areas, the former had a notably larger NDVI and LAI increase per unit area compared to the latter. On the other hand, most browning areas were covered by grassland or others (about 99% in NDVI and 87% in LAI in total).

Figure 5. Change patterns of the relative area (RA) trends for NDVI from 1982 to 2019, (a) and LAI from 1982 to 2015, (c) calculated for different LULC types for southern Xinjiang study area. The subplots (b)–(d) show the contribution to greening (increased NDVI or LAI) for different LULC types. See table 1 for data description and abbreviations.
Download figure:
Standard image High-resolution imageThe frequency distributions of the long-term slopes according to NDVI and LAI confirmed the distinct patterns for different LULC types and it was fitted using kernel density curves (figure 6). Cropland showed a widespread NDVI and LAI increase with larger slopes, compared to the other vegetation types (figures 6(a)–(e)). Forest/shrubs showed higher variance of the change slopes than the other vegetation types with two peaks for NDVI and the median slope was also positive (figures 6(b)–(f)). In contrast, more slopes of NDVI and LAI were near zero for grasslands (figures 6(c)–(g)) and negative for other areas (figures 6(d)–(h)). The GIMMS NDVI results showed more slopes concentrated near zero for grassland and other areas (figures S4(c) and (d)), and cropland showed a relatively dispersed distribution of slopes greater than zero (figure S4(a)).

Figure 6. Histogram of the slope values for NDVI from 1982 to 2019 (a)–(d) and LAI from 1982 to 2015 (e)–(h) for different LULC types for southern Xinjiang study area. Columns show the relative frequency of slope values falling within equal intervals of 50 increments from minimum to maximum and the dashed line to each histogram is the kernel density curve. See table 1 for data description and abbreviations.
Download figure:
Standard image High-resolution image3.5. Relation between greening and distance to human-dominated area
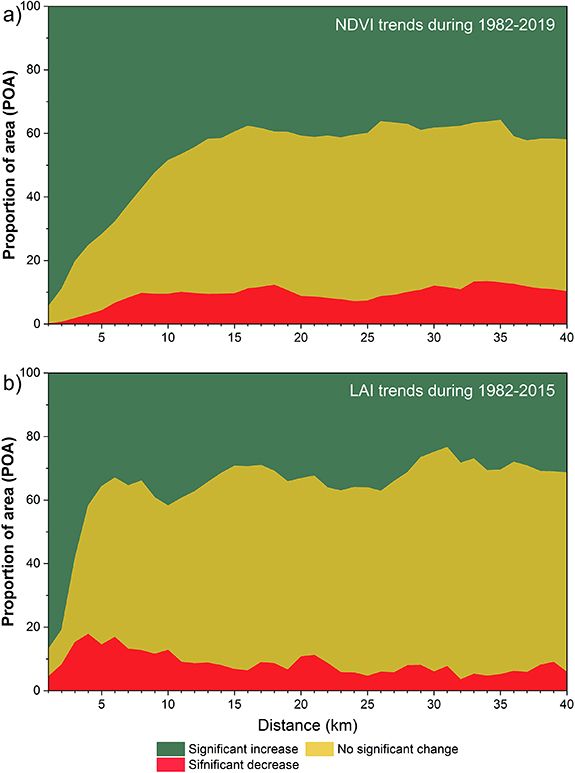
Since 1990, greening was more evident near human-dominated areas and it decreased with distance (figure 7). According to both the NDVI and the LAI data, greening areas had the largest POA (around 90%) within 2 km of human-dominated area. The proportion of greening decreases dramatically as the distance increases until around 15 km, whereas POA with browning increased slowly with distance up to 15 km for NDVI and 5 km for LAI. Therefore, there was significantly more greening and less browning near human-dominated areas. Despite a 'discrepancy' in minimum points between NDVI and LAI results, which resulted in different distances of minimum points (the first minimum point occurred in 14 and 6 km according to NDVI and LAI data, respectively), the minimum proportion of greening trends was similar of approximately 25%. There were fluctuations after the first minimum point in both NDVI and LAI results, but as a whole, the ratio of greening, stabilization, and browning trends was around 4:5:1 for a long distance ( 25 km) from the human-dominated area.
Figure 7. Area trend change for NDVI (a) and LAI, (b) as functions of distance from human-dominant areas (cropland and built-up area) in 1990 in southern Xinjiang study area. See table 1 for data description and abbreviations.
Download figure:
Standard image High-resolution image
4. Discussion
4.1. The impacts of climatic and atmospheric factors on the greening
The greening in southern Xinjiang study area had a strong and significant correlation with human activities, but is also influenced by other indirect factors (Zeng et al 2017, Piao et al 2020), such as climate change and atmospheric influences (CO2 fertilizer effect and atmospheric nitrogen deposition; Piao et al 2020). The general greening trend over different LULC types suggested that greening was affected by these indirect, and most likely large scale, factors to different degrees.
Climatic effects (precipitation, temperature, water balance) were, however, investigated and no significant effect of precipitation was found for the past 40 years in the vast majority of the study area (results not shown; see e.g. Pu et al 2011). In addition, the temperature had also little influence on the vegetation coverage due to the limited water resources available throughout most of the year. Atmospheric factors might drive the greening trends on a much larger scale and play an important role in time-series fluctuations. However, the effect of atmospheric factors can be assumed homogeneous on the studied scale (Piao et al 2015). The greening difference among the LULC types will minimize the effects of the large scale and indirect factors as well because LULC types are spatially mixed. The NDVI and LAI time series fluctuations are to some extent caused by atmospheric factors, but the difference in greening rate between adjacent areas should be largely attributed to human activities. Therefore, the effects of human activities can be separated in our analysis from other factors to examine the modulation of the greening patterns.
4.2. The greening patterns modulated by human activities
The greening patterns in southern Xinjiang during the past decades can be summarized as larger greening trends in the 'green land' and greening accelerated by continuously increasing crop production. Cropland was the main vegetation contributing to the greening (figures 2 and 5) and it was the LULC type with the fastest greening rate (figure 4), which reveals the increasing farming intensity in the study area. Southern Xinjiang has experienced significant cropland expansion at the cost of grassland shrinkage from 1990 to 2020, in particular, since 2000 (table 2; Peng et al 2011, Ning et al 2018), and the agricultural center shifted to southern Xinjiang in recent years (Gao et al 2019, Cai et al 2021). The LULC change in the study area was mainly attributed to the transformation of prevailing institutions and policies in China (Lambin et al 2003, Zhang et al 2015), from a 'command' to a market-oriented economy (Tisdell 2009), which intensified and mobilized the agricultural production, alongside a steadily improving socio-economic condition of the local population. Additionally, the vegetation near human-dominated areas showed more greening areas, which indicates that agricultural production had greatly supported the greening process in southern Xinjiang. Therefore, economic development and population increase had a strong relation with the heterogeneous greening patterns, reflected as the rapid greening cropland and mixed grassland changes. Noteworthy is that crop- and grassland was always the 'surrounding' environment of the built-up area (figure 1), which formed agricultural oases dominated by farming and animal husbandry. More browning areas within 10 km (figure 7) from human-dominated areas may indicate natural vegetation degradation, grassland in particular.
4.3. Potential ecological effects of heterogeneous greening
The heterogeneous greening in southern Xinjiang showed that non-climatic factors- human activities, affected the ecological processes associated with LULC changes, for example, agricultural management and human-dominated area expansion. Beyond the warmer and wetter climate that provided better conditions for vegetation growth in NW China, the social and economic conditions are the dominant factor of vegetation changes in this hyper-arid region. Greening in human-dominated areas could be implemented by two means, as previous studies argue, i.e. reclaiming or transforming other vegetation covers, in particular grassland (Ning et al 2018, Cai et al 2021). The potential ecological effect of fast agricultural development is causing water pressure in southern Xinjiang. Distinct patterns of greening in cropland and grassland indicate the great disequilibrium of water resources between crops and natural vegetation. Water source varies across cropland and natural vegetation cover, i.e. crops rely on irrigation water, while natural vegetation relies on precipitation, ice/snow-melt water, or deep groundwater. The region under human control shows more greening processes may be related to the larger appropriation of water resources near human-dominated areas. In many arid regions in China and globally, water consumption for irrigation is even higher than that in wet regions (Deng et al 2006, Liang et al 2015). Thus, concentrated greening induced by the increasing farming intensity and expansion of cropland will enhance the water pressure in the hyper-arid southern Xinjiang. In addition, the slight area decrease of forest/shrubs and expansion of the others (table 2) may agree with desertification in the oasis of the Tarim Basin (Jiang et al 2019).
4.4. Limitations and uncertainties of the study
This study is subject to uncertainty, mainly derived from scale issues of the remote sensing datasets and oversimplification of the system complexity, which may be the direction of future research. Firstly, the different resolutions between the NDVI and the LAI datasets, and the LULC datasets induce (a) slight grid discrepancies, i.e. few pixels with various LULC types to have assigned one NDVI or LAI value; and (b) the slight discrepancy of linear trends, in particular, the large decrease of NDVI after 2018. This may introduce uncertainty in the estimates of the slopes of NDVI or LAI of each LULC type. Secondly, different results for grassland and the other LULC types are caused by the differences of NDVI and LAI to reflect vegetation coverage and processes. According to the results, NDVI filtered by a specific threshold may have better vegetation identification under the coarse growing seasons present for grassland and other lowly vegetated areas (figures 2(a) and S1), whereas LAI data may underestimate the vegetation cover in these areas (figure 2(c)). Accordingly, other results had some minor discrepancies due to both distinct periods and different data processing of providers (e.g. the significant discrepancy of turning points for the greening proportions in figures 7 and S5). Finally, a recent study of analyzing spatial and temporal data (such as NDVI and LAI) recommended that auto-correlation induced by the commonly used method may overestimate the vegetation increase (Cortés et al 2021). The standard trend method of linear regression and significance-test can depict the directions and relative rates of the changes well in a long-term analysis compared to the LOWESS regression (figure 3), while the absolute increases of NDVI and LAI were not fitted well.
5. Conclusion
This study aimed to reveal the spatio-temporal patterns of vegetation changes for different LULC types in the hyper-arid region of southern Xinjiang, NW China, and to quantify the extent to which the process is modulated by human activities based on long time series (1982–2019) of remote-sensing NDVI and LAI data. Several conclusions can be drawn from the analysis: (a) significant greening trend was found in southern Xinjiang from 1982 to 2019 as a whole; (b) the greening was spatially heterogeneous and more greening trends concentrated in the areas with relatively high vegetation coverage; (c) cropland had the fastest greening rate and contributed the most to the greening, which was mainly caused by agricultural development and cropland expansion; (d) significant greening concentrated in the human-dominated area reveals that human activities modulated the greening pattern. The findings highlighted the modulation of human activities, in particular, land use management for agricultural development on the greening pattern in a water-limited and endorheic region. Faster greening of cropland compared to naturally vegetated areas points to ecological risks, such as increasing water pressure for irrigation under agriculture expansion in arid regions. Future studies should (a) investigate the role of seasonal NDVI and LAI amplitude on the annual greening patterns, (b) consider the relative contribution of change in farming intensity and cropland expansion to cropland greening, (c) extrapolate the study approach over other regions to reveal the past and potential effect of human activities on the global greening process, and (d) different datasets (vegetation indices and LULC) with appropriate spatial-temporal resolutions should be considered on multi-scale spatio-temporal analysis for accuracy.
Acknowledgments
This study was supported by the National Natural Science Foundation of China (41790424 and 41730645). The author thanks the NASA GIMMS group for producing and sharing the NDVI3g dataset (https://ecocast.arc.nasa.gov/data/pub/gimms/3g.v1/) and the NOAA CDR project for producing and sharing the CDR NDVI dataset, which is available and convenient to deal with on the Google Earth Engine (GEE) platform (https://developers.google.com/earth-engine/datasets/catalog/NOAA_CDR_AVHRR_NDVI_V5#description). The authors also thank Nanshan You, a PhD student at the Key Laboratory of Land Surface Pattern and Simulation, Institute of Geographic Sciences and Natural Resources Research, Chinese Academy of Sciences, who made many efforts on the preprocessing of CDR NDVI data.
Data availability statement
The data that support the findings of this study are either acknowledged for free access or available upon reasonable request from the authors.