

Abstract
Sectoral coverage that plays a critical role in operationalizing the emission trading scheme (ETS), has gained substantive attention. Despite the insightful views on sectoral coverage from the emission reduction potential or carbon leakage, previous studies overlook the cost-effectiveness of ETS in the sense that the varying marginal contributions of each sector to reducing emission abatement costs (EACs) (which is defined as marginal cost savings, MCSs) remain underexplored. To fill this gap, this paper proposes a costs-oriented approach for sectoral coverage (COASCO), which ranks the sectors by estimating and comparing their MCSs. Taking China's climate targets by 2030 as an example, we conduct an empirical study that implements the COASCO method to explore the impacts of sectoral coverage on China's EACs. Our analysis demonstrates that, while coverage extension generally reduces China's EACs, a small sectoral coverage can already lead to a substantial decline in the national EACs. The results underpin the Pareto principle that covering six sectors (i.e. Electricity production, Metallurgy, Transport and storage, Petroleum and gas, Nonmetal mining) out of 29 can reduce China's EACs by over 80% compared to covering Electricity production only. Although coverage extension may reduce the differences in EACs between sectors and improve market activation, extending the sectoral coverage probably gives rise to the number of big carbon traders, which thenincreases the risks of market manipulation. As a result, covering those six sectors can reach a balance between ETS market activation and risks. By providing a generalized and systematic framework for determining the sectoral coverage, this study makes it possible to minimize the total EACs associated with any sectoral coverages, thus assisting policymakers in fulfilling China's latest ambitious goals of reaching carbon peaking by 2030 and carbon neutrality by 2060 in a cost-effective manner.
Export citation and abstract BibTeX RIS

Original content from this work may be used under the terms of the Creative Commons Attribution 4.0 license. Any further distribution of this work must maintain attribution to the author(s) and the title of the work, journal citation and DOI.
Abbreviations.
| Terminology | Abbreviation | Definition |
|---|---|---|
| Carbon emission allowance | CEA | Allowed carbon emissions that agents must comply with in a given time period. |
| Carbon emission reduction | CER | Reduced carbon emissions in a given time period compared to the case with no climate actions. |
| Costs-oriented approach for sectoral coverage | COASCO | An approach developed in this article to determining the sectoral coverage by quantifying the marginal cost savings of sectors. |
| Emission abatement costs | EACs | Costs of agents to comply with the emission reduction quotas. |
| Terminology | Abbreviation | Definition |
|---|---|---|
| Emission reduction quotas | ERQs | Excessive carbon emissions of agents that should be reduced in keeping with the carbon emission allowance in a given time period. |
| Emission trading scheme | ETS | A market-based approach that puts a quantity limit and a price on emissions through carbon market. |
| Gross domestic product | GDP | A monetary measure of the market value of all the final goods and services produced in a given time period. |
| Marginal abatement costs | MACs | Increase in costs due to an additional unit of carbon emission reduction. |
| Marginal cost savings | MCSs | Marginal reduction of emission abatement costs due to the inclusion of an additional sector in the emission trading scheme. |
| Nationally determined contributions | NDCs | National plans of climate change mitigation as a contribution to achieving the global targets set by the Paris Agreement. |
1. Introduction
Over 150 nations and regions have pledged their nationally determined contributions (NDCs) to limit the world-average temperature rise below 2 °C and even 1.5 °C relative to the pre-industrial levels (IPCC 2014, Glanemann et al 2020, Weikmans et al 2020). In attempting to avoid unaffordable emission abatement costs (EACs) as a result of increasingly stringent environmental regulations, market-based policies like emission trading scheme (ETS) that allows the emission allowances or reduction quotas trading have come into force in many countries and regions (Spash 2010, Bertram et al 2015, Liu et al 2015a, Fujimori et al 2016). For example, the European Union launched the ETS that serves as a powerful policy instrument in support of the climate targets (Skjærseth and Wettestad 2008, Zhang and Wei 2010). To date, the ETS has been implemented in a growing number of nations such as Switzerland, Australia, New Zealand, South Korea, and plays a central role in meeting theclimate targets and saving the EACs (Perdan and Azapagic 2011).
As the world's largest greenhouse gas emitter, China has committed to reducing the carbon emissions per unit of gross domestic product (GDP) (i.e. carbon intensity) by over 65% in 2030 against the 2005 levels, reaching carbon peaking by 2030 and carbon neutrality by 2060 (Xie et al 2020, Cui et al 2021, Fang et al 2021, Zhang et al 2022, Zhou et al 2021). To achieve these ambitious goals, China has devoted to the ETS pilots in the past decade (Liu et al 2015b, Dong et al 2019, Heggelund et al 2019). In the recent years, China has sped up the pace towards the nation-wide ETS (Stoerk et al 2019, Ying and Sovacool 2021). However, despite these milestones, the limited scope of sectoral coverage remains as one major challenge facing China's ETS (Fan and Wang 2014, Mu et al 2018, Qi and Cheng 2018, Green 2021). In practice, China's ETS pilots vary considerably in their sectoral coverages. Of these, Hubei, Chongqing, etc, focus on traditional carbon-intensive sectors like power, cement and steel production, whereas Beijing, Shanghai and Shenzhen include the finance, public management, and commercial activities in their ETS (Jiang et al 2016, Wang et al 2017). Yet, the ongoing development of national ETS merely takes into account electricity production (Lin and Jia 2019).
In addition to these learning-by-doing experiments, the theoretical underpinning of potential sectoral coverage has been explored (Fan and Wang 2014, Karstensen and Peters 2018, Qi and Cheng 2018). Generally speaking, the wider sectoral coverage that increases the variation of marginal abatement costs (MACs) across sectors can lead to greater potential cost savings of ETS, thereby improving the cost-effectiveness (Weitzman and Spence 1978, Fan and Wang 2014, Wu et al 2022a). However, in practice, the extension of sectoral coverage will inevitably increase the administrative and transaction costs, and undermine the cost-effectiveness of ETS (Wang et al 2017, Lin and Jia 2020). In this sense, a partial sectoral coverage has been widely accepted in implementing the ETS despite the debates on the selection of sectors (Springmann 2012, Fan and Wang 2014, Böhringer et al 2014a). Overall, the state of the art on this issue can be divided into two categories that concentrate on either the emission reduction potential or carbon leakage of sectors (Mu et al 2018, Wang et al 2018a, Lu et al 2020, Zhou et al 2020, Wu et al 2022b). The rationale of the first category is naturally understandable, by which the carbon-intensive sectors will be first included in the ETS given their high carbon emissions or high carbon intensity. This solution is deemed more practically sufficient to reduce the emissions and meet the regional climate targets even with partial sectoral coverage (Wang et al 2017, Qian et al 2018, Lamb et al 2021).
The second category, originated from the spillover effect of unilateral environmental regulations, concerns about the impacts of sectoral coverage on the carbon leakage between sectors and regions (Baylis et al 2013, Böhringer et al 2014b, Jarke and Perino 2017). This is particularly true for a partially-covered ETS, where the engaged sectors might shift their emissions to those who are not included in the ETS through trading, production reallocation or other channels, unintendedly leading to carbon leakage (Di Maria and Van der Werf 2008, Bistline and Rose 2018, Tan et al 2018, Zhang et al 2020). By assessing the trade intensity that is generally defined as the ratio of the exports and imports to the sum of domestic production and imports, some suggest that those sectors having less inter-sectoral trade in goods should be first included in the ETS in fighting carbon leakage (Juergens et al 2013, Wang et al 2017, Qian et al 2018).
Even with the insightful views on sectoral coverage from current studies, they might disregard the fact that the ETS is primarily designed for minimizing the total EACs (Convery 2009, Zhang and Wei 2010). Despite the consensus that covering more sectors in the ETS can continuously reduce the EACs, the marginal cost savings (MCSs) that represent the marginal reduction of EACs due to the inclusion of an additional sector in the ETS can vary considerably because of the disparate MACs across sectors (De Cara and Jayet 2011, Tang et al 2020). In this sense, the estimation on varying MCSs of sectors would allow for a remarkable decline of EACs with a relatively small sectoral coverage. However, to our knowledge, the MCSs of sectors have not been sufficiently estimated. This absence actually undermines the cost-effective design of ETS with respect to sectoral coverage.
To fill the research gaps, the main contributions of this study are threefold as follows. First, rather than focusing on carbon- and trade-intensive sectors, we begin with looking at the variations in MCSs of each sector and minimize the EACs in any sectoral coverages, with the aim of assisting policymakers in developing a more cost-effective ETS. Second, we propose a costs-oriented approach for sectoral coverage (COASCO) for the MCSs quantification and conduct an empirical study that explores the impacts of sectoral coverage on EACs under China's NDCs by 2030. Third, we validate the Pareto principle that covering six sectors (e.g. Electricity production, Metallurgy, Transport and storage, Petroleum and gas, Nonmetal mining) out of 29 can reduce China's EACs by over 80% compared to covering Electricity production only. The results obtained in this paper could not only be informative for extending China's ETS, but also serve as a robust reference for other economies dedicated to a more cost-effective ETS.
2. Methods and data
Rather than carrying on the debate over emission reduction potential versus carbon leakage, we propose determining the sectoral coverage through the COASCO method that selects and ranks the sectors according to their MCSs (Betz et al 2010, Wang et al 2018b). Unlike the general belief that sectors with lower MACs should be first covered in the ETS, figure 1 provides a schematic representation of how to measure the MCSs of sectors and how to determine the sectoral coverage based on their varying MCSs. Specifically, suppose that Sectors a, b and c have MAC curves, MACa , MACb and MACc , where the historical carbon emission reduction (CER) starts at a0, b0, and c0, respectively. As seen in figure 1(a), compared to Sectors b and c, covering Sector a that has the lowest MACs would lead to fewer EACs to comply with the emission reduction quotas (ERQs) if only one sector is involved. Specifically, the EACs would be equal to the area of Polygons a0 a1 pa1 pa0 , b0 b1 pb1 pb0, and c0 c1 pc1 pc0, when the ETS includes Sectors a, b, and c, respectively. Provided that the ETS extends its coverage to two sectors, there are two options: Sectors a and b, or Sectors a and c. While Sector a increases its CER in both options, the marginal reduction of EACs (defined as MCSs) differs considerably between Sectors b and c. For example, when Sector b is additionally included in the ETS, the EACs would be reduced by S1 + S2 + S3, namely, the MCSs of Sector b would be S1 + S2 + S3 (figure 1(b)). Although the EACs can also be reduced to some extent in the latter option, the MCSs of Sector c (which are estimated at S1 + S4) are comparatively lower than those of Sector b. In this case, including Sector b is preferred even though the MACs of Sector b at b0 are higher than those of Sector c at c0. This simplified example illustrates how the ETS manages to minimize the total EACs; that is, the convergence of MACs of all sectors is achieved through ERQs trading. All this validates the methods used in this paper (i.e.the non-linear programming) to simulate the ETS in terms of sectoral MACs at the macro scale. Meanwhile, it illustrates the way that we define and estimate the MCSs of each sector, and the reasons why sectors have varying MCSs.
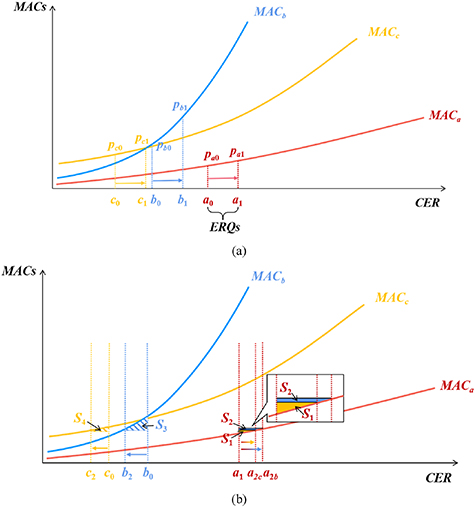
Figure 1. Schematic representation of varying marginal cost savings of three sectors. (a) shows the case where only one sector is involved in the emission trading scheme (ETS). (b) shows the case where the second sector is selected into the ETS. MACs are marginal abatement costs, CER is carbon emission reduction, ERQs are emission reduction quotas, and MACa , MACb and MACc are the MAC curves for Sectors a, b and c.
Download figure:
Standard image High-resolution imageHere we propose the COASCO method that conducts an iteration algorithm for estimating the MCSs of sectors and determines the rankings of ETS-covered sectors in order. Technically, we do four steps:
Step 1: Create new sets for sectoral coverage of ETS. Prior to estimating the MCSs of each sector for prioritization, we recursively create the new sets for sectoral coverage of ETS. For example, suppose there are n ETS-covered sectors and m uncovered sectors, then we will have m new sets including n+1 sectors, in which the potential MCSs of each newly covered sector are to be estimated.
Step 2: Allocate ERQs to ETS-covered sectors. For each new coverage set, we allocate the ERQs to each sector included in the ETS. Even though the selection of criteria for ERQs allocation has not yet reached an agreement, the cost-effectiveness of ETS can be independent from the allocation process (Zhou et al 2013, Chang et al 2016). Note that in the following we take the grandfathering scheme that allocates the ERQs to sectors based on the historical carbon emissions, and that the comparison of various allocation schemes is out of our study.
Step 3: Estimate EACs in each new set. ETS that allows reallocation of ERQs between sectors can reduce EACs in achieving climate targets such as NDCs. To rank the ETS-covered sectors, we calculate the EACs in all the new sets and estimate the MCSs of each newly covered sector. By identifying the sector with largest MCSs, the coverage of ETS from n sectors to n+1 sectors is determined.
Step 4: Iterate Steps 1–3 until all the sectors are ranked. Now that we have a new determined sectoral coverage with n +1 sectors, we successively iterate Steps 1–3 until all the sectors are ranked in order when they are included into the ETS. In this sense, the COASCO method makes it possible to minimize the total EACs associated with any sectoral coverages, strictly conforming with the pursuit of cost-effectiveness in the ETS design.
In the following, we elaborate on the COASCO method with an example of China.
2.1. Measuring China's total ERQs by 2030
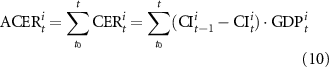
In keeping with China's NDCs of carbon intensity reduction by 2030, we follow Mi et al (2017) and Fang et al (2021) who assume an exponential decline in carbon intensity. The historical trend in China's carbon intensity that decreases from 2.96 tons per 10 thousand RMB in 2005 to 1.61 tons per 10 thousand RMB in 2017 fits well with our exponential model. Moreover, considering the uncertainty of China's economic growth in a post-COVID-19 'new normal' (Song and Zhou 2020), we set three scenarios for future economic growth rate (i.e.3%, 4% and 5%) until 2030. Note that this is generally in line with the China's latest economic plan that requires the average annual GDP growth rate to be 4.7% consistently in the next 15 years in achieving the goal of becoming a moderately developed country by 2035 (Asian Development Bank 2021, National Development and orm Commission of China 2021). The measurement of China's ERQs can be done as:


where m is the mitigation rate (%) of China's carbon intensity from 2018 to 2030. Given China's updated NDCs, we presume a 65% reduction of carbon intensity in 2030 against the 2005 levels. CIt is China's carbon intensity (tons CO2 per 10 thousand RMB) in year t, ERQst is China's emission reduction quotas (million tons, Mt) in year t, GDPt is China's gross domestic product (100 million RMB) in year t, and α is China's economic growth rate (%) from 2018 to 2030.
2.2. Allocating the ERQs to ETS-covered sectors
The total ERQs by 2030 will be allocated to ETS-covered sectors through a top-down approach. Admittedly, there are different schemes for ERQs allocation at the sectoral scale (e.g. grandfathering scheme, output-based scheme), and a consensus on the most appropriate one has not been reached (Fang et al 2019, Lucas et al 2020). However, the cost-effectiveness of ETS can be independent from the allocation process (Zhou et al 2013, Chang et al 2016). In this article, we adopt the grandfathering scheme that allocates ERQs proportionally to the sectoral historical emissions, since it makes the allocation more implementable than other schemes, particularly at the early stage of ETS (Cramton and Kerr 2002, Wang et al 2019). The ERQs allocation based on the grandfathering scheme can be done as:

where  is the carbon emission allowance (CEA) (Mt) of sector i in year t,
  is the carbon emissions (Mt) of sector i in year t,
  is the emission reduction quotas (Mt) of sector i in year t, and t0
is the baseline year. As seen in formula 5, we allocate the CEA to each sector by multiplying China's total CEA and the proportion of sectoral emissions in each year t. Then to simulate the ETS in terms of MACs, we translate CEA to ERQs as previous studies (Zhou et al
2013, Fang et al
2021). In theory, CEA represents the emissions that agents must comply with, and ERQs represent the emissions that should be reduced to meet the caps. In this sense, the translation will have no impacts on the EACs and carbon price. Specifically, the sectoral ERQs then can be calculated by subtracting the allocated CEA from its future carbon emissions (formula 6). We assume that the proportion of carbon emissions by each sector keeps unchanged from 2018 to 2030 for brevity. While this probably increases the uncertainty of the estimated ERQs by sector, it has nothing related to our simulation on the impacts of sectoral coverage on the total EACs. In doing so, formulas 5 and 6 can be converted to formula 7 that accounts for the sectoral ERQs proportional to the historical emissions of each sector. Here the historical emissions refer to the annual average carbon emissions between 2015 and 2017.
is the emission reduction quotas (Mt) of sector i in year t, and t0
is the baseline year. As seen in formula 5, we allocate the CEA to each sector by multiplying China's total CEA and the proportion of sectoral emissions in each year t. Then to simulate the ETS in terms of MACs, we translate CEA to ERQs as previous studies (Zhou et al
2013, Fang et al
2021). In theory, CEA represents the emissions that agents must comply with, and ERQs represent the emissions that should be reduced to meet the caps. In this sense, the translation will have no impacts on the EACs and carbon price. Specifically, the sectoral ERQs then can be calculated by subtracting the allocated CEA from its future carbon emissions (formula 6). We assume that the proportion of carbon emissions by each sector keeps unchanged from 2018 to 2030 for brevity. While this probably increases the uncertainty of the estimated ERQs by sector, it has nothing related to our simulation on the impacts of sectoral coverage on the total EACs. In doing so, formulas 5 and 6 can be converted to formula 7 that accounts for the sectoral ERQs proportional to the historical emissions of each sector. Here the historical emissions refer to the annual average carbon emissions between 2015 and 2017.
2.3. Estimating the MAC curves for sectors
The MAC curves depict how the EACs of a sector increase due to an additional unit of CER. Given the growing MACs when CER increases, we adopt a second-order polynomial function as a basis for estimating the MAC curves for sectors, as suggested by previous studies (Zhou et al 2013, Cui et al 2014, Fan et al 2016). Specifically, we follow Zhou et al (2013) and use accumulative carbon emission reduction (defined in this paper as the CER added up between 2000 and the specific year) as a proxy for the emission reduction potential. To account for the MACs, we introduce the potential economic loss proposed by Fang et al (2021) as a substitute for the investment on clean development mechanism. Potential economic loss that calculates the economic loss due to the production inefficiency and accounts for the direct and indirect costs of CER is expected to correct the serious distortion in the MACs estimation given the phaseout of clean development mechanism since 2008 (World Bank 2012, Maraseni 2013). The MAC curves for sectors are estimated as:


where  is the potential economic loss (100 million RMB) of sector i in year t,
  is the accumulative carbon emission reduction (Mt) of sector i in year t while
  is the carbon emission reduction (Mt) of sector i in the single year t. In this study, we set 2000 as the starting year for measuring the cumulative value.
  is the emission productivity (10 thousand RMB per ton CO2) of sector i in year t, expressed as the inverse of carbon intensity, and ai, bi
and ci
are parameters to be estimated. Specifically, to account for the three parameters for each sector, we calculate potential economic loss and accumulative CER for all the sectors from 2000 to 2017 by formulas 9 and 10. As shown in formula 9, the potential economic loss of sectors is calculated by multiplying the difference in emission productivity and carbon emissions between adjacent years.
is the emission productivity (10 thousand RMB per ton CO2) of sector i in year t, expressed as the inverse of carbon intensity, and ai, bi
and ci
are parameters to be estimated. Specifically, to account for the three parameters for each sector, we calculate potential economic loss and accumulative CER for all the sectors from 2000 to 2017 by formulas 9 and 10. As shown in formula 9, the potential economic loss of sectors is calculated by multiplying the difference in emission productivity and carbon emissions between adjacent years.
2.4. Modelling the emission trading scheme through non-linear programming
In the ETS regime, the sectors with higher MACs tend to transfer their ERQs to those that have lower MACs. By reallocating the ERQs to sectors with lower MACs, the ETS enables the rigorous and cost-effective achievement of climate targets. We develop a non-linear programming model to simulate China's inter-sectoral ETS, and estimate China's EACs under different sectoral coverages, following the formulas:
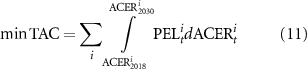
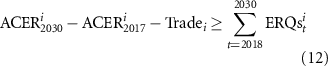
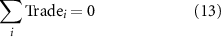
where TAC is China's total abatement (100 million RMB) after trading, and  is the trading ERQs (Mt) of sector i from 2018 to 2030. Note that this study concerns the ERQs trade between sectors instead of CEA trade, whereby the positive Tradei
refers to additional emissions reduced by Sector i for others, and vice versa. Formula 11 sets the objective function of minimizing China's EACs in 2018–2030. Formula 12 implies that the emissions reduced by each sector in 2018–2030 and the trading ERQs should not be fewer than its initially assigned climate targets. Formula 13 suggests a market clearing of ETS in this period.
is the trading ERQs (Mt) of sector i from 2018 to 2030. Note that this study concerns the ERQs trade between sectors instead of CEA trade, whereby the positive Tradei
refers to additional emissions reduced by Sector i for others, and vice versa. Formula 11 sets the objective function of minimizing China's EACs in 2018–2030. Formula 12 implies that the emissions reduced by each sector in 2018–2030 and the trading ERQs should not be fewer than its initially assigned climate targets. Formula 13 suggests a market clearing of ETS in this period.
2.5. Data
As shown in table 1, Chinese economy is classified into 29 sectors, of which 24 are sub-sectors in the manufacturing industry. Because there is no official carbon intensity published at national and sectoral scales, we calculate these values by dividing the carbon emissions by the corresponding GDP. The emission data for China and all the sectors in 2000–2017 come from the China Emission Accounts and Datasets. Since this is an emission inventory of 45 sectors from 1997 to 2017, we aggregate these data according to our sectoral classification. The GDP data for China and all the sectors in 2000–2017 are derived from the Chinese Statistical Yearbooks, all of which have been converted to the 2005 prices for comparability. Due to the lack of access to GDP of sub-sectors in the manufacturing industry, we use the data on value added of industrial enterprises above designed size to estimate the GDP of each sub-sector.
Table 1. Sectors and their abbreviations.
| Code | Sector (Abbreviation) | Code | Sector (Abbreviation) |
|---|---|---|---|
| 1 | Agriculture (Agr) | 16 | General machinery (GenMac) |
| 2 | Coal mining (CoalMin) | 17 | Specialist machinery (SpecMac) |
| 3 | Petroleum and gas (Petr&Gas) | 18 | Transport equipment (TranEqp) |
| 4 | Metal mining (MetlMin) | 19 | Electrical equipment (ElecEqp) |
| 5 | Nonmetal mining (NonmetlMin) | 20 | Electronic equipment (ElenEqp) |
| 6 | Food processing and tobaccos (Food&Tob) | 21 | Instrument and meter (Inst&Metr) |
| 7 | Textile (Textile) | 22 | Other manufacturing (OthrMan) |
| 8 | Clothing, leather, fur, etc (Clothing) | 23 | Electricity and hot water production and supply (E&W Prod) |
| 9 | Wood processing and furnishing (Wood&Furn) | 24 | Gas production and supply (GasProd) |
| 10 | Paper making, printing, stationery, etc (Paper) | 25 | Water production and supply (WatProd) |
| 11 | Petroleum refining, coking, etc (Petr&Coking) | 26 | Construction (Constr) |
| 12 | Chemical industry (ChemInd) | 27 | Wholesale and retailing (Whol&Ret) |
| 13 | Nonmetal products (NonmetlProd) | 28 | Transport and storage (Tran&Stor) |
| 14 | Metallurgy (Metl) | 29 | Other services (OthrServ) |
| 15 | Metal products (MetlProd) |
3. Results
3.1. MAC curves for sectors
Based on the sectoral potential economic loss and accumulative CER from 2000 to 2017, we estimate the MAC curves for 29 sectors using the quadratic function as displayed in figure 2. In general, the MACs experience an exponential rise as the sectoral CER increases. Specifically, GenMac, Whol&Ret and ElecEqp have high MACs irrespective of CER, as they are less carbon-intensive and thus have little potential of CER. By contrast, for those large emitters (e.g. E&W Prod, Metl, NonmetlProd), the MACs always remain at a low level regardless of the CER. In addition, the MACs of Tran&Stor, ChemInd, CoalMin start at the bottom but experience a sharp increase in MACs in response to the deep emission reduction. For instance, when the CER is assumed at 50 Mt, Tran&Stor, ChemInd and CoalMin have their MACs at 22.44, 25.22 and 53.42 RMB per ton. But when the CER increases to 250 Mt, an additional unit of CER of these three sectors will cost 161.32, 504.94 and 829.16 RMB. In addition to the varying MAC curves for sectors, the difference in the historical CER between sectors is pronounced. For instance, NonmetlProd, E&W Prod, and Metl with relatively flat MAC curves have historical CER over 500 Mt, while the majority of the sectors (e.g. Whol&Ret, Petr&Coking, CoalMin) have their historical CER less than 100 Mt.
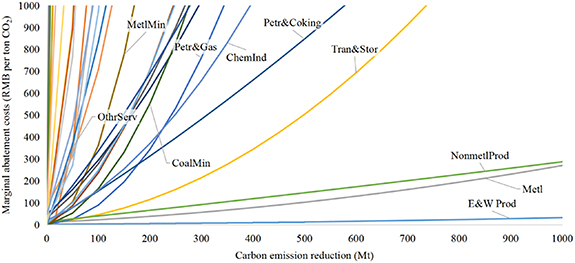
Figure 2. The marginal abatement cost curves for 29 sectors.
Download figure:
Standard image High-resolution imageIn theory, the varying sectoral MACs provide a basis for implementing the ETS across sectors. However, despite the considerable divergence of sectoral MACs, we notice some sectors that have similar MAC curves, e.g. Metl and NonmetlProd, Tran&Stor and Petr&Coking, Petr&Gas and ChemInd. Covering the sectors resembling in their MAC curves might contribute little to the potential cost savings of ETS while leading to a substantial increase in the administrative and transaction costs. With the aim of reducing more EACs with a relatively small sectoral coverage, there is a great need to identify the prioritized sectors that have large MCSs.
3.2. China's EACs and carbon price
Figure 3 shows that China's carbon intensity has reduced from 2.96 tons per 10 thousand RMB in 2005 to 1.61 tons per 10 thousand RMB in 2017, and will continuously decline to 1.04 tons per 10 thousand RMB in 2030 at a mitigation rate of 3.3% according to our exponential model. After projecting China's future GDP in the three scenarios for economic growth (i.e. 3%, 4% and 5%), we measure China's total ERQs from 2018 to 2030 that amount to 4217.78, 4513.30 and 4832.60 Mt, respectively. As seen, enhancing the economic growth will moderately lead to more ERQs in the next decade.

Figure 3. The historical and future trends of China's carbon intensity and GDP. The black solid curve shows the historical carbon intensity from 2005 to 2017, the black dashed curve shows the future carbon intensity from 2018 to 2030, and the black dotted curve estimates the trajectory of China's carbon intensity from 2005 to 2030 in an exponential decline. Likewise, the red solid curve shows the historical GDP from 2005 to 2017, and the red curves in dashed, dot-dashed and dotted project China's GDP at an economic growth rate of 3%, 4% and 5%, respectively.
Download figure:
Standard image High-resolution imageBy estimating and comparing the MCSs of sectors, the rankings of ETS-covered sectors can be determined. Figure 4 shows the impacts of each sector on China's EACs when it is involved in the ETS. In general, China's EACs can be largely reduced due to coverage extension. As seen, at an economic growth rate of 3%, 4% and 5%, the total EACs will drop from 0.90–0.35, 1.07–0.44 and 1.27–0.55 trillion RMB, respectively. Meanwhile, we notice a sharp decrease in the MCSs as the sectoral coverage extends. Regardless of the economic growth scenarios, China's EACs can be cut by over 80% with the engagement of six sectors (i.e. E&W Prod, OthrServ, Metl, Tran&Stor, Petr&Gas and NonmetlMin) compared to the engagement of E&W Prod only. Alternatively, the other 23 sectors contribute less than 20% to reducing the total EACs. This intriguing observation that a small sectoral coverage can save large EACs in the ETS conforms with the Pareto principle that 80% of effects arise from 20% of the causes (also referred to as the 80/20 rule).
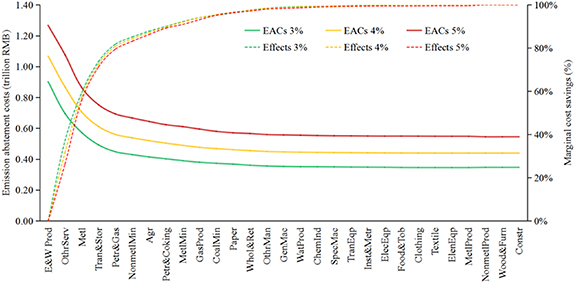
Figure 4. The changes in China's emission abatement costs (EACs) and marginal cost savings with different sectoral coverages. Axis X from left to right shows the rankings of sectors to be covered in the emission trading scheme. The curves in green, yellow and red show the trajectories at an economic growth rate of 3%, 4% and 5%, respectively. The solid curves show China's EACs in different sectoral coverages, and the slashed curves show to what extent China's EACs can be saved as a result of coverage extension.
Download figure:
Standard image High-resolution imageLikewise, our simulation of China's MACs (i.e. the equilibrium carbon price) supports the Pareto principle as well (figure 5). By including the first six sectors (i.e. E&W Prod, OthrServ, Metl, Tran&Stor, Petr&Gas and NonmetlMin), China's MACs can be cut by around 80%, from 802.25, 895.13 and 1001.22 RMB per ton to 341.44, 261.41 and 383.49 RMB per ton at an economic growth rate of 3%, 4% and 5%, respectively. Note that the inter-sectoral trading is not allowed until two or more sectors are engaged. While including OthrSev in the ETS might increase China's MACs compared to the case where only E&W Prod is engaged, it can leave the tertiary industry more room for economic growth and reduce the total EACs considerably. Moreover, we elaborate on the reallocation of the ERQs between sectors through ETS, whereas the technical countermeasures of each sector to realize climate targets (e.g. investment on low-carbon technology, transition of energy mix) are out of this study.
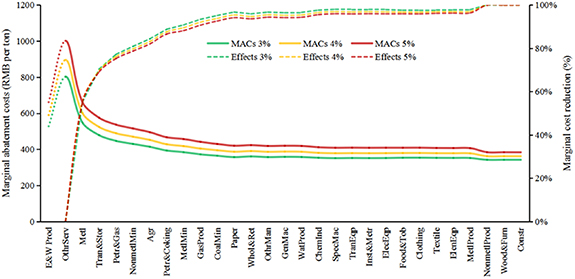
Figure 5. The changes in China's marginal abatement costs (MACs) and marginal cost reduction with different sectoral coverages. The curves in green, yellow and red show the trajectories at an economic growth rate of 3%, 4% and 5%, respectively. The solid curves show China's MACs in different sectoral coverages, and the slashed curves show to what extent China's MACs can be reduced as a result of coverage extension.
Download figure:
Standard image High-resolution image3.3. Sectoral ERQs and abatement costs
Sectoral coverage plays a critical role in the distribution of initial ERQs. As shown in figure 6, under the grandfathering scheme, more initial ERQs tend to be assigned to the sectors that have large historical emissions, e.g. E&W Prod, Metl, Tran&Stor. Overall, the wider coverage of sectors can lead to a more even distribution of initial ERQs across sectors. For example, including the first four sectors (i.e. E&W Prod, OthrServ, Metl and Tran&Stor) in the ETS considerably reduces the ERQs share assigned to E&W Prod and Metl from 100% and 29.6% to 60.3% and 26.5%, respectively, and this ERQs distribution remains largely steady when more sectors are engaged.
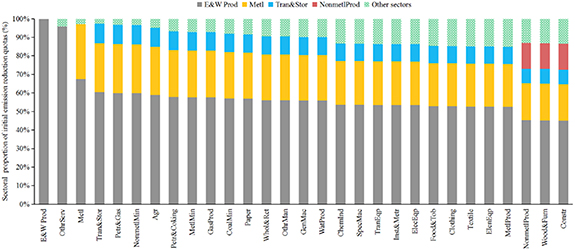
Figure 6. The distribution of initial emission reduction quotas (ERQs) assigned to sectors under different sectoral coverages. We show the sectors having large initial ERQs and aggregate the rest with a few ERQs into other sectors.
Download figure:
Standard image High-resolution imageFigure 7 shows the impacts of sectoral coverage on the ERQs traded between sectors. In general, the total trading volumes of ERQs between sectors experience a notable increase due to coverage extension that improves the market activation of ETS. Our simulation of three economic growth scenarios demonstrates that, on average, covering all the 29 sectors can increase the total trading volumes of ERQs from 289.78 Mt (when E&W Prod and OthrServ are involved) to 1320.41 Mt. However, the impacts of coverage extension on the trading ERQs vary considerably across sectors. For instance, in line with coverage extension, the trading ERQs of E&W Prod exhibit an N-shaped change while those of Metl exhibit a U-shaped change. Despite the benefits of market activation, the involvement of big ERQ traders runs the risk of market manipulatione when the sectoral coverage extends (Deng and Zhang 2019, Bauer et al 2020, Wang et al 2021). As such, we believe that covering the six sectors (i.e. E&W Prod, OthrServ, Metl, Tran&Stor, Petr&Gas, NonmetlMin) in the ETS can reach a balance between ETS market activation and risks especially at its early stage.

Figure 7. The trading emission reduction quotas (ERQs) between sectors under three economic growth scenarios (i.e. 3%, 4% and 5%). The positive values refer to additional emissions reduced by one sector for others, and vice versa. We show those sectors having large ERQs trade and aggregate the rest into other sellers or other buyers.
Download figure:
Standard image High-resolution imageWe further calculate the ratio of sectoral EACs to GDP and explore the impacts of sectoral coverage on the EACs of sectors. Although the sectors involved in the ETS still have varying EACs, the differences between sectors can be reduced as the sectoral coverage extends. Specifically, our simulation result of three economic growth scenarios shows that, on average, E&W Prod and Metl will reduce the ratio of sectoral EACs to GDP from 1.3% to 0.1% and from 14.7% to 6.9% in response to the coverage extension, while the ratio for Petr&Gas increases from −2.7% to −1.7%. In other words, the EACs of sectors tend to converge as the sectoral coverage extends. However, covering the first ten sectors (e.g. E&W Prod, OthrServ, Metl) has enabled a convergence of EACs between sectors. Despite the same observation on cost convergence in all the three economic growth scenarios, we find that higher economic growth will increase the deviations of EACs between sectors, but this impact seems moderate because of the little difference between the three economic growth scenarios (figure 8).
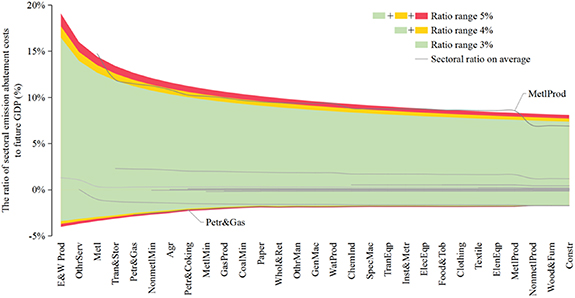
Figure 8. The ratio of sectoral emission abatement costs (EACs) to future GDP under different sectoral coverages. The green shadow shows the ranges of ratio associated with different sectors at an economic growth rate of 3%, and the yellow and red shadows show the extended ranges at an economic growth rate of 4% and 5%, respectively. The gray curves show the average value (which refers to the ratio of EACs to future GDP) in the three economic growth scenarios for each of the 29 sectors as the sectoral coverage extends.
Download figure:
Standard image High-resolution image4. Discussion
4.1. Comparison with other criteria for sectoral coverage
The discussion over the criteria for sectoral coverage has emerged since the proposal of ETS. In addition to MCSs concerned in this paper, carbon intensity and trade intensity are two commonly adopted criteria focusing on emission reduction potential and carbon leakage, respectively (Wang et al 2017, Qian et al 2018). As said, the former refers to the carbon emissions per unit of GDP, and the latter refers to the ratio of the exports and imports to the total market scale. By estimating the MCSs of ETS-covered sectors under each criterion, we bring together these three criteria into figure 9(a). Note that this comparison is performed at an economic growth rate of 4%, and the detailed sectoral rankings by carbon intensity or trade intensity can be found in tables A1 and A2 in appendix A (available online at stacks.iop.org/ERL/17/045002/mmedia). We show that E&W Prod, Metl, NonmetlProd, and Tran&Stor will be first included in the ETS if sectors are ranked by carbon intensity. However, compared to our study, the potentialcost savings of ETS will remain at lower levels until OthrServ is engaged. While determining the sectoral coverage by trade intensity would allow for soaring cost savings even with fewer ETS-covered sectors (e.g. Clothing, ElenEqp, MetlProd), it leads to excessively high EACs compared to the other two criteria because sectors having less emission reduction potential will be first included in the ETS. In summary, despite the insightful views on sectoral coverage from emission reduction potential and carbon leakage, our COASCO method is more appropriate in the sense that it allows for minimal EACs associated with any sectoral coverages.

Figure 9. Cost savings of emission trading scheme (ETS) and emission abatement costs (EACs) by three criteria (a) and marginal abatement cost (MAC) curves for the first-covered sectors (b). (a) We rank 29 sectors by marginal cost savings (MCSs), carbon intensity and trade intensity, and compare China's EACs under different criteria. The curves in red, yellow and blue show the cost savings of ETS when sectors are ranked by MCSs, carbon intensity and trade intensity. The blue bars show the ratio of EACs by trade intensity to EACs by MCSs, and the pink bars show the ratio of EACs by carbon intensity to EACs by MCSs. The ratios are expressed as logarithm. (b) The colored curves show the first six sectors (i.e. E&W Prod, OthrServ, Metl, Tran&Stor, Petr&Gas, NonmetlMin) to be covered in the ETS and the other 23 sectors are drawn in gray.
Download figure:
Standard image High-resolution image
By comparing the MCSs of sectors, our study recommends E&W Prod, OthrServ, Metl, Tran&Stor, Petr&Gas and NonmetlMin to be first included in the ETS. As shown in figure 9(b), these six sectors differ considerably in their MAC curves that basically reflect the overall distribution of the MAC curves for all the 29 sectors. This implies that we should give priority to those sectors that have tremendously diverging MACs if the aim is to embrace the Pareto principle—a remarkable decline in EACs with a relatively small sectoral coverage. In other words, once the typical sectors that have large MCSs are identified, the Pareto principle can arise in terms of sectoral coverage.
4.2. Limitations and solutions
We acknowledge that there remain some limitations in the assumptions and methods of our analysis that need to be addressed in future studies. First, the use of macro data (e.g. sectoral carbon emissions, GDP) is likely to trigger an overestimation of the MACs by sector. Even though projecting future carbon price is not what this study mainly concerns, it is still desirable to further conduct a sensitivity analysis of sectoral MAC curves as long as the methodology underlying the MACs simulation becomes more scientifically robust. Second, while we set three scenarios to explore the impacts of economic growth on our empirical results, more socioeconomic factors that go beyond GDP should be considered at the next step. For example, China recently updates its NDCs in terms of carbon intensity reduction. More efforts to understand the impacts of this update on our empirical results would be required. Third, analysis of some highly aggregated sectors (e.g. Agr, OthrServ) in this paper may lead to impractical results. To strengthen the policy relevance of this study, a potential solution might be to present the results at the aggregated and disaggregated levels in keeping with divergent requirements of policy makers and scientists. Fourth, we assume a long time period of carbon market clearing when all the agents are allowed for inter-temporal trading. Although this assumption may breach the reality of China's ETS and raise some uncertainties of the results, many researches have demonstrated that inter-temporal trading can smooth out the demand shocks of CEA and strengthen the resilience of ETS (Fankhauser and Hepburn 2010, Duan et al 2018, Bocklet et al 2019). In practice, recent reform in the ETS of the European Union allows the inter-temporal trading by making use of the market stability reserve (Perino and Willner 2017, Bocklet et al 2019). Nevertheless, further analyses that divide long time period into several intervals can be the next step to examine the differentiated impacts of inter-temporal trading on the various agents. Fifth, in this article, we consider direct emissions of sectors merely and leave aside indirect emissions associated with outsourcing electricity requirements. While the negligence of indirect emissions might substantially increase the costs of electricity production that would be passed on to power consumers ultimately, some research has demonstrated that the double counting that considers both direct and indirect emissions may cause a higher overall cap of ETS, thus leading to a lower emission reduction effect (Xiong et al 2017, Qian et al 2018, Zeng et al 2018). Further analysis related to this issue would therefore be required. Last but not least, this paper focuses exclusively on ETS as a single policy tool for CER. By allocating all the ERQs to the ETS-covered sectors, the remaining sectors are excluded from CER. This may lead to unfairness and inefficiency because unengaged sectors would not reduce their carbon emissions proactively (Mu et al 2018). Mixed policy packages including ETS, carbon tax, renewable energy subsidy, emission standards and sophisticated emission accounting methods like carbon footprinting, remote sensing retrieval, machine learning and big data analysis are expected to respond to this challenge (Duren and Miller 2012, Gouveia and Palma 2019, Liu and Lo 2021, Long et al 2019, Ye et al 2021, Zhao et al 2021).
5. Conclusions
For a policy that is primarily designed for minimizing the total EACs, previous studies dedicated to determining the sectoral coverage rarely concern the varying MCSs of sectors, thus undermining the cost-effective design of ETS. To estimate and compare the sectoral MCSs, this paper proposes the COASCO method that selects and ranks the sectors to be included in the ETS. Taking China's NDCs by 2030 as an example, we conduct an empirical study using this COASCO method to determine the rankings of 29 sectors to be covered in the ETS and explore the impacts of sectoral coverage on China's EACs under three economic growth scenarios. By providing a generalized and systematic framework for determining the sectoral coverage, this study makes it possible to minimize the total EACs associated with any sectoral coverages, thus being able to assist policymakers in designing a more cost-effective ETS that is the key to fulfilling China's latest ambitious goals of reaching carbon peaking by 2030 and carbon neutrality by 2060.
There are several key findings and policy implications from our simulation results. First, although the extension of sectoral coverage generally reduces China's EACs and improves the cost-effectiveness of ETS, the MCSs vary considerably between sectors and a small sectoral coverage can already lead to a substantial decline in the national EACs. Specifically, irrespective of the economic growth scenarios, covering the six sectors (i.e. E&W Prod, OthrServ, Metl, Tran&Stor, Petr&Gas, NonmetlMin) out of 29 can reduce China's EACs and MACs by over 80% compared to covering E&W Prod only, which conforms with the Pareto principle with respect to the sectoral coverage of ETS. Second, while coverage extension can somehow reduce the sectoral differences in EACs, complementary policies (e.g. fiscal transfers and subsidy, net ETS revenues recycling) that are necessary to further shrink the deviations of EACs between sectors would be highly needed. Third, despite the benefits of market activation as a result of coverage extension, the growing trading ERQs might give rise to big ERQs sellers and buyers (e.g. E&W Prod, Metl), probably increasing the risks of market manipulation. As per our simulation result, covering the first six sectors (i.e. E&W Prod, OthrServ, Metl, Tran&Stor, Petr&Gas, NonmetlMin) in the ETS is preferred as it allows for a balance between ETS market activation and risks. Last but not least, compared to the criteria of carbon intensity and trade intensity, ranking the ETS-covered sectors pertaining to the criterion of MCSs is more appropriated in ways it allows for minimization of the total EACs associated with any sectoral coverages, strictly conforming with the pursuit of cost-effectiveness in the ETS design.
Acknowledgments
This work was supported by the National Natural Science Foundation of China (72074193, 71704157), the Key R&D Program of Zhejiang Province (2022C03154, 2022C03030), the Natural Science Foundation of Zhejiang Province for Distinguished Young Scholars (LR19G030001), and the Ecological Civilization Project of Zhejiang University. We would like to thank Yiqi Tang for her generous help in proofreading the article.
Data availability statement
All data that support the findings of this study are included within the article (and any supplementary files).
Conflict of interest
The authors declare no conflict of interest.
Author contributions
Qifeng Zhang and Kai Fang designed the research. Qifeng Zhang, Jing Chen and Hong Liu performed the research. Kai Fang and Peilin Liu contributed to the interpretation of the results. Qifeng Zhang and Kai Fang prepared the manuscript with comments from all coauthors.