

Abstract
Flooding in the Yangtze River Basin could severely damage socio-economic development, river ecosystems, food security, hydropower production and transportation in China. The Yangtze River Basin accounts for approximately 30% of China's gross domestic product (GDP) and is an engine for the country's rapid economic growth. One commonly held belief is that climate change has intensified extreme flood events, leading to increasing economic damage in the Yangtze River. Here, we quantitatively attributed economic exposure to climate change (i.e. climate-induced changes in weather-related events) and GDP growth, and assessed benefits, i.e. the reduction in economic exposure, from flood defence dikes of varying heights. To do this, we developed a framework by combing a large scale hydrological model, a hydraulic model, and long-term GDP data. We find that climate-induced changes in flood inundation area and resulted economic exposure were decreasing overall, whereas GDP growth drove the increases of potential economic exposure to floods. We also reveal that the basin average flood defence dikes should be at least approximately 3.5 m high to achieve an about ten-year average flood occurrence. Our results have significant policy and socioeconomic development implications.
Export citation and abstract BibTeX RIS

Original content from this work may be used under the terms of the Creative Commons Attribution 4.0 license. Any further distribution of this work must maintain attribution to the author(s) and the title of the work, journal citation and DOI.
1. Introduction
Flooding in the Yangtze River Basin could severely damage socio-economic development, river ecosystems, food security, fishing industry, recreation industry, hydropower production and transportation in China. The Yangtze River Basin covers approximately 1.8 million square kilometres, which is approximately 20% of China's total land area, and is the longest river in Asia (figure 1). The gross domestic production (GDP) in the basin was 4.4 × 10⁴ billion US dollars in 2015 (Kummu et al 2018). The Yangtze River Basin is dominated by the East Asian monsoon climate, with abundant rainfall and frequent flooding in summer (Kundzewicz et al 2019).
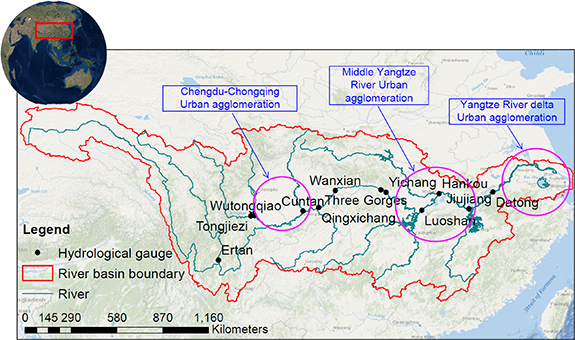
Figure 1. The Yangtze River Basin. Locations of the three urban agglomerations located in the upper, middle and lower reaches of the river basin are indicated.
Download figure:
Standard image High-resolution imageThe catastrophic floods that swept through South China, including the Yangtze River Basin, in the summer of 2020 resulted in estimated direct economic losses of up to 16.58 billion US dollars (RMB 116.05 billion yuan) and affected 45.5 million people, according to the Ministry of Emergency Management for the People's Republic of China. Despite the severe socioeconomic losses, few studies have investigated the spatial distribution and temporal changes of economic exposure to flood inundation in the entire river basin. At present, varying heights of flood dikes along the main channels of the middle and lower reaches of the Yangtze River offer different levels of protection. The function of flood defence dikes to prevent exposure has not been explicitly evaluated under climate change and rapid socioeconomic development, acknowledging that flood defence dikes are important structural measures to reduce flood risk (Kundzewicz et al 2018).
Flood hazard mapping reveals the magnitude and frequency of flood disasters (Willner et al 2018, Scott et al 2019, Smith et al 2019) and is important for flood risk management (Jongman et al 2015, Blöschl et al 2019, Vousdoukas et al 2020). Flood hazard mapping involves a cascade of model simulations. In general, a distributed hydrological model is used to simulate long-term runoff, and then, a two-dimensional hydraulic model is used to simulate flood inundation based on runoff. In recent decades, several large-scale, distributed hydrological models have been developed with a sophisticated physical basis (Wang et al 2009a, 2009b, Knijff et al 2010, Shrestha et al 2010, 2012). Additionally, there has been rapid improvement in two-dimensional hydraulic models with high computational efficiency (Yamazaki et al 2011, 2013). These model developments make large-scale flood risk mapping possible and practical. In quantitative studies of the temporal evolution of flood risk, the risk is often attributed to climate factors and the size of the economy (Winsemius et al 2016, Ward et al 2017, Burke et al 2018, Kundzewicz et al 2018, 2019, Willner et al 2018). In addition to a flood hazard distribution calculated from the cascade of model simulations (Hirabayashi et al 2013), attribution studies also use long-term socioeconomic data. Considering the propagation processes of floods from upstream to downstream, flood risk quantification is commonly carried out in an entire river basin. However, this kind of flood risk attribution effort has not been seen previously in the Yangtze River Basin.
Here, for the first time to our knowledge, we quantitatively studied flood risk changes measured by GDP, attributed economic exposure to climate variations and GDP growth, and assessed benefits, i.e. the reduction in economic exposure, from flood defence dikes of varying heights in the Yangtze River Basin. We adopted a flood risk analysis framework that combines simulation from an extended Water and Energy Budget-based Distributed Hydrological Model with improved Snow physics (WEB-DHM-S) with the two-dimensional CaMa-Flood model and a long-term fine-spatial-resolution GDP dataset (1990–2015) based on historical statistics from the World Bank and United Nations (Kummu et al 2018). First, we mapped the flood hazards and then used the simulated spatial distribution of flood hazards to attribute flood risk to climate variations and to GDP increases. The benefits analysis of raising dike heights was carried out in the last step. In this study, climate changes/variations refer to the climate-induced changes in weather-related precipitation/flood events (Sauer et al 2021).
2. Methodology
2.1. Flood risk analysis and attribution
The framework for flood risk analysis has three main components. First, the WEB-DHM-S model is Generalized, which is hereafter referred to as WEB-DHM-SG, and the model is used to simulate spatially distributed runoff. Second, the runoff data are used as input for flood inundation simulations, calculated by the CaMa-Flood model, including daily flood depth, inundation area, and inundation area fraction for each grid cell. Third, GDP exposure is quantified and attributed from the long-term gridded GDP and simulated flood inundation data.
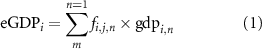
The daily flood inundation area, flood inundation area fraction and flood depth were simulated for each grid cell using the framework, and then, the following procedures were carried out to assess the GDP exposure. The day with the largest total flood inundation area in a given year was identified, and the total GDP exposure across the entire Yangtze River Basin for that year was calculated by summing the exposed GDP in each grid cell as follows:
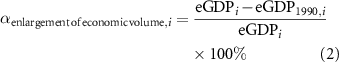
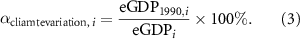
where eGDPi is the total GDP exposure in year i; j is the day with the largest total flood inundation area in year i; m is the total number of inundated grid cells; n is the inundated grid cell index (n = 1, 2, 3,., m); gdpi, n is the GDP for grid cell n in year i; and fi, j, n is the fraction of the area of cell n that is inundated by flooding. We used the following procedures to attribute GDP exposure to climate variations and to GDP growth between 1991 and 2015. First, we calculated the GDP exposure using GDP values from 1990 (due to the GDP data starts from 1990) and the inundation area from year i (eGDP1990,i ). Then, we calculated the relative contributions of climate variations and GDP growth to the GDP exposure for year i, expressing these values in terms of percentage:
Many flood defence dikes with a range of different heights have been built in the Yangtze River Basin. These dikes can reduce flood risk. In the final step of our analysis, we considered the effects of dikes. There are no data on the heights of dikes in different parts of the river basin, so our analysis was based on a range of assumed dike heights. We estimated the benefits of different dike heights (from 0.5 m to 5.0 m with an interval of 0.5 m) by calculating the reduction in GDP exposure that they would provide. These values represent the average dike height in the entire Yangtze River Basin. To determine the effects of dikes, the methodology has two main steps. First, the exposed GDP was quantified for the Yangtze River for the baseline scenario without flood defences; second, the exposed GDP changes were studied by increasing the assumed dike heights and GDP in regions with water depths lower than the dike heights was not influenced. The two steps were repeated for different dike heights.
2.2. Models
WEB-DHM-SG adds four improvements to WEB-DHM-S (Wang et al 2009b, 2017, Shrestha et al 2010). First, WEB-DHM-SG uses global-scale river bathymetry data (river depths and widths), whereas WEB-DHM-S uses virtual channels and does not explicitly consider the spatial distribution of river depths and widths. Second, WEB-DHM-S uses the Pfafstetter numbering system (Verdin and Verdin 1999) and the kinematic wave approach to represent river routing, which generates spatially discontinuous discharge output. WEB-DHM-SG uses either the same routing approach as WEB-DHM-S for river routing or a hydraulic approach (i.e. CaMa-Flood), which is an alternative method to including flood inundation area and depth in the simulations and is facilitated by the use of spatially distributed river depths and widths for the runoff simulations. Third, WEB-DHM-S requires hourly input data, which are generally not readily available at large scales. WEB-DHM-SG uses either hourly or daily data as input, making the model appropriate for a wider range of applications without downscaling. Fourth, WEB-DHM-SG takes soil hydraulic properties from the Global Maps of Soil Hydraulic Property product, available from Future Water (www.futurewater.eu/), and uses a spatially specific temperature threshold to discriminate between rain and snow, which is taken from Jennings et al (2018). WEB-DHM-S takes soil hydraulic properties from data produced by the Food and Agriculture Association (FAO) (2003) and uses a static temperature threshold to discriminate between rain and snow, which must be calibrated and specified, usually from user experience, for individual studies. All parameters in WEB-DHM-SG are global or near global and based on observations, which makes it a suitable model to use for large/global scale spatially distributed studies, such as spatially distributed flood risk. The CaMa-Flood model uses functions to link water depth and area fraction, derived from the 90 m-resolution digital elevation model based on the shuttle radar topography mission data (Yamazaki et al 2013). The simulations do not consider flood defence infrastructure, such as dikes and reservoirs, so the estimated exposure can be considered as the potential flood risk.
2.3. Model calibration and validation methods
We used hydrological gauge data from 12 stations to calibrate discharge simulations (figure 1). Data from 1982 to 1991 were used to calibrate the model parameters, and data from 1991 to the end of the available period were used for validation. Calibration was carried out at a monthly scale because daily discharge data were not available from every gauge and because using this longer time scale helps to reduce the effects of human activity on discharge processes, for example, reservoir operations. In addition to discharge simulation evaluations, other evaluation methods were also used to assess the simulation performance. First, the spatial distribution of the simulated water bodies was validated against Global Surface Water Occurrence (GSWE) data (Pekel et al 2016), which was generated from Landsat observations. Second, the simulated flood depths were compared with the water level gauge observation. More details can be found in the Supporting Information.
3. Results
3.1. Simulation evaluation
Table 1 shows the performance of the discharge simulations. The average Nash-Sutcliffe Efficiency (NSE) values are 0.82 and 0.84, and the averages of absolute values of Relative Bias (|RB|) are 7.9% and 7.4% for the calibration and validation periods, respectively. The values for NSE and |RB|, averaged over all the simulations, are 0.84 and 7.4%, respectively, which shows that the discharge simulations perform acceptably. Figure S2 (available online at stacks.iop.org/ERL/17/034046/mmedia) compares the simulated water body distribution with the GSWE data for the middle and downstream regions of the Yangtze River. The locations of water area are simulated well for large water bodies, such as Tai Lake, Dongting Lake, and Poyang Lake. Figure S3 compares the simulated water level with in situ observation. The average simulated water level at Yichang Station is 40.2 m, and the average observed water level is 43.0 m. RB is −0.7% and R is 0.88, showing that the overall performance for the water level simulations is good. More details about the model evaluation can be found in the Supporting Information.
Table 1. Performance evaluations based on discharge data from gauge stations.
| Hydrological gauge and data available time period | Calibration (1982–1991) | Validation (1992-the end of available data) | Overall performance | |||
|---|---|---|---|---|---|---|
| NSE | RB/|RB| | NSE | RB/|RB| | NSE | RB/|RB| | |
| Cuntan (1982–2008) | 0.91 | 5.8% | 0.90 | 4.8% | 0.90 | 5.2% |
| Ertan (1982–2005) | 0.78 | 4.5% | 0.77 | 1.9% | 0.78 | 3.0% |
| Tongjiezi (1982–2010) | 0.80 | −4.9% | 0.84 | −9.8% | 0.82 | −8.1% |
| Three Gorges (1982–2008) | 0.90 | 6.2% | 0.89 | 6.3% | 0.89 | 6.3% |
| Datong (1982–2010) | 0.68 | 13.0% | 0.74 | 10.0% | 0.72 | 11.0% |
| Luoshan (1982–2009) | 0.81 | 10.3% | 0.81 | 10.6% | 0.81 | 10.5% |
| Wutongqiao (1982–2002) | 0.89 | −2.0% | 0.89 | −3.1% | 0.89 | −2.5% |
| Hankou (1982–2009) | 0.80 | 11.7% | 0.78 | 11.3% | 0.79 | 11.4% |
| Jiujiang (1988–2009) | 0.78 | 13.1% | 0.79 | 10.2% | 0.79 | 10.7% |
| Qingxichang (1990–2009) | — | — | 0.88 | 7.0% | 0.88 | 7.0% |
| Wanxian (1990–2009) | — | — | 0.89 | 6.1% | 0.89 | 6.1% |
| Yichang (1982–2009) | 0.88 | 7.2% | 0.87 | 7.4% | 0.87 | 7.4% |
| Average | 0.82 | 7.9% | 0.84 | 7.4% | 0.84 | 7.4% |
Bold numbers represent the average of absolute values of RB.
3.2. Flood hazards
The mean and maximum daily runoff were higher in the southern and eastern parts of the basin than that in the western and northern parts (figures 2(a) and (b)). The magnitude for the mean daily discharge and for the maximum daily discharge was greater in the middle and lower reaches than that in the other regions (figures 2(c) and (d)). The maximum water depth, mean water depth, and mean and maximum daily flood fractions were also the highest in the regions (figures 2(e)–(h)). These results inform that the middle and lower reaches of the Yangtze River were the flood-prone area. The total flooding area in the river basin was decreasing from 1991 to 2015 (figure 2(i)), which was due to the annual maximum precipitation accumulated in over six days was reducing (figure 3). The result implies that the propagation of floods from upstream to downstream is the main reason of the flooding: the greater the accumulation days, the more the upstream flood propagating to the downstream. With increasing accumulation days from 7 day to 15 day, the slope values of the annual maximum precipitation trend lines were decreasing (figure 3(p)).

Figure 2. Flood hazards in the Yangtze River Basin for 1991–2015. (a), (b) Runoff. (c), (d) Discharge. (e), (f) Water depth. (g), (h) Flood fraction (flooding area/total area). (i) Temporal variations of total flooding area.
Download figure:
Standard image High-resolution image
Figure 3. Annual maximum basin average precipitation changes in the Yangtze River Basin from 1991 to 2015. (a)–(o), AMP in different accumulation days ranging from 1 day to 15 day. (p) Slope values of the AMP trend lines from 1 day to 15 day accumulation periods. AMP = Annual Maximum Precipitation. Sig = Significant. The significance test was based on the nonparametric Mann-Kendall analysis approach (0.05 significance level) (Mann 1945, Kendall 1975). Red colour indicates increasing trends. Purple colour indicates decreasing trends.
Download figure:
Standard image High-resolution imageThe regions where the flooding ratio was relatively high (i.e. where a high proportion of the total number of days experienced flooding) were concentrated in areas that were close to the main river and/or close to lakes (figure 4). The Han River, which is the largest tributary of the Yangtze River, joins the main channel in region B, and this confluence creates a high potential for catastrophic flooding. In the rainy season, flood water flows to Poyang Lake from the main channels of the Yangtze River, increasing the flood risk at the lakeshore. As the water depth threshold increases, the ratio of the number of days with water depth greater than the threshold to the total number of days generally would decrease across the basin (figures 4(f)–(h)).

Figure 4. Flood risk and ratio of water depth in the middle and lower reaches of the Yangtze River Basin. (a)–(e), Flood risk around the middle and lower reaches of the Yangtze River. (f)–(h) Ratio of water depth greater than a threshold around the middle and lower reaches of the Yangtze River. We use the flooding ratio, i.e. the number of flood days as a proportion of the total number of days in a year, to represent flood risk, which is expressed as a percentage. Water depth data for 1991–2015, on a daily scale with ∼500 m spatial resolution, are used in the calculation. Region A is the Dongting Lake area; Region C is the Poyang Lake area.
Download figure:
Standard image High-resolution image3.3. Economic exposure and attribution for flood events
Economic exposure to flooding increased rapidly from 1991 to 2015 without considering flood defences (green bars in figure 5(a)). If there was no economic growth and GDP remained constant at its 1990 value, then economic exposure would not change significantly; in fact, it would decrease (orange bars in figure 5(a)). The increase in economic exposure was solely attributable to GDP growth. As a result, the proportion of the contribution of GDP growth to economic exposure increased rapidly from 1991 to 2015, while the contribution from climate variations decreased steadily (figure 5(b)). Based on the results, from 1997 onwards, the contribution of GDP growth exceeded that of climate variations. In the 1998 flood event, 56% of the potential GDP exposure was attributable to GDP growth. From 1990 to 2015, potential economic exposure accounted for 7.4% of the total GDP in the Yangtze River Basin on average.
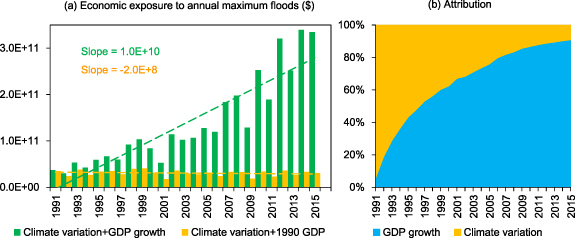
Figure 5. Potential economic exposure and attribution in the Yangtze River Basin. (a) Economic exposure to annual maximum floods from 1991 to 2015. (b) Attribution of the economic exposure. GDP is counted in units equal to the 2011 constant US dollar price. The economic exposure for a flood event is the sum of the exposed GDP over the flooding area.
Download figure:
Standard image High-resolution image3.4. Risks and benefits for different flood dike heights
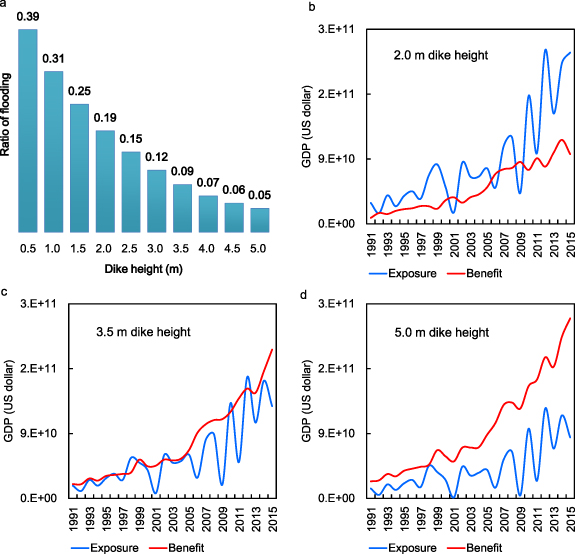
Where flood dikes are 0.5 m high, the average flooding ratio would be 0.39, showing that the areas would flood once every 2.6 (1/0.39 ≈ 2.6) years on average (figure 6(a)). Flood defence dikes that are 2.0 m high would reduce the occurrence of floods to approximately once every five years. To increase the protection level, such that flooding occurs only once about every 11 years (1/0.09 ≈ 11.1), flood dikes need to be 3.5 m high. The benefits would increase largely from 1991 to 2015 with the growth of GDP exposure (figures 6(b)–(d)). Generally, the larger the potential GDP exposure, the greater the benefits.
Figure 6. Ratio of flooding and exposure and benefit of different dike heights in the Yangtze River Basin. (a) The simulated flooding ratio, averaged over the flood-prone area, for different flood defence dike heights. (b) The GDP exposure (without any defence dikes) and the avoided GDP exposure (benefit) if 2.0 m defence dikes are built. (c) As in b but for 3.5 m dikes. (d) As in (b), (c) but for 5.0 m dikes. Areas that are permanently water-covered are excluded from the calculations. GDP unit = 2011 constant US dollar price.
Download figure:
Standard image High-resolution image
4. Discussion
4.1. Comparisons with other studies
In contrast to many previous studies, we studied the GDP exposure to floods based on well validated continuous model simulation and generated flood hazard maps with relatively higher spatial resolution (∼500 m) in the Yangtze River. The continuous model simulation enables the flood risk analysis that is not limited to a specific return period. For example, the flood in the Yichang station in 1998 is about ten year return period (Wu 1999), and the flood in the Hankou station in 1998 is about 30 year return period (Li 1999). The higher spatial resolution hazard map could more accurately show the distribution of flood hazards, and could relatively better facilitate the estimation of the potentially influenced regions/GDP. Our validations were based on multiple datasets, such as discharge, water level and satellite observed water body distribution. The studies by Du et al (2018) and Fang et al (2018b) investigated urban land and population changes in floodplains. These two variables cannot directly represent GDP changes. Their results were limited to the uniformly distributed 100/1000 year return period flood hazard map generated by Rudari et al (2015). This flood hazard map was based on hydraulic models at 1 km spatial resolution, and was not validated in the Yangtze River Basin. In addition, the 100/1000 year return they used is less frequent than ours.
In contrast to many previous studies, we attributed flood risk to climate-induced changes in weather-related flood events and GDP increase considering flood inundation processes. We developed a framework by combing a physically based hydrological model and a hydraulic model to study flood inundation processes and resulted flood risk in the Yangtze River. We showed that the flood inundation changes were closely related to the accumulated precipitation in over seven days. In 1998, the flood in the upper stream of the Yangtze River met with flood in the middle reaches of the Yangtze River, causing devastating flood disaster in the middle reaches of the river (Li 1999). Our study can consider such flood risk propagation regime from upper stream to downstream, whereas the previous studies cannot. The study by Zhang et al (2020) only investigated floods in 1998, 2008 and 2016, and therefore the study is not a complete flood risk study in the Yangtze River. The study by Gu et al (2020) used subjectively selected return period thresholds of runoff to study flood risk, rather than flood inundation process, and therefore the study was empirical in nature. The study by Aerts et al (2020) compared flood hazard maps of different models in China, including the Yangtze River Basin, but the study did not quantitatively attribute flood risk to climate-induced changes in weather-related flood events and GDP increase. The study by Fang et al (2018a) used a statistical approach, and cannot represent flood inundation processes. In addition, the study by Fang et al (2018a) only analysed annual maximum daily and three day precipitation. Therefore, the study by Fang et al (2018a) could not unfold the main reason of flood risk changes in the Yangtze River. Different from the study by Winsemius et al (2016) which investigated the relative influence of climate change and social-economic development on future flood risk in the Yangtze River, we focused on a historical period which has not been studied before. Winsemius et al (2016) showed that economic development would be the main driver of flood risk increases in the Yangtze River over the 21st century. Combining our results with the study by Winsemius et al (2016), we could infer that economic development could be the main driver of flood risk increases in the Yangtze River in both the historical period and future periods.
In contrast to many previous studies, our results revealed that the overall flooding area was decreasing when considering the flood propagation processes from upstream to downstream and the changes of annual maximum precipitation accumulated in over six days. This is a significant new insight provided by our research. When only considering the annual maximum precipitation accumulated in less than seven days, the inference would be that the annual maximum precipitation in the Yangtze River was intensifying. This is what many previous studies commonly did (Wang and Zhou 2005, Su et al 2008, Chen et al 2011, Guan et al 2017), which may lead to the traditional perception that extreme floods in the Yangtze River were intensifying in the past decades and therefore that climate-induced weather-related flood variations resulted in increasing economic exposure in the Yangtze River.
We did not consider the probability distribution of extreme floods in this study, because our study was based on the continuous model simulation approach. It is common to study the year-to-year variations of flood induced damages/exposures based on the continuous model simulation within a time period, rather than probability-based approaches. For example, the study by Sauer et al (2021) used 31 year data (1980–2010) and hydraulic and hydrological combined models to study GDP exposures/damages. Similarly, the study by Hirabayashi et al (2013) also used the continuous model simulation approach to study year-to-year exposure to floods, rather than probability-based approaches and expected exposure. The study by Sauer et al (2021) used GDP to represent assets and the GDP exposure was calculated as the GDP multiplied by the flood area fraction in a grid cell. The total GDP exposure was calculated as the sum of grid scale GDP exposure in a region (Sauer et al 2021). We did not consider the expected annual GDP exposure because it is largely influenced by the linear extrapolation of exposed GDP between different return periods (Aerts et al 2020). In addition, the linear extrapolation could be problematic because it is subjectively selected and there is no theoretical basis. Further, we were studying the historical flood events which have occurred, and there is no need to calculate the expected influence. Our methodology is similar to the previous studies.
Dikes have been proved to be an effective measure in flood risk management (Jongman 2018, Kundzewicz et al 2018). Our study is the first one for the Yangtze River to study the reductions of GDP exposure under different dike heights based on a spatially distributed modelling framework. Our study is informative for both policymakers and future studies. Although our study investigated the potential benefits of raising dikes under several dike heights, our model developed in this study can be implemented for other dike heights and regions.
In the study by Willner et al (2018), the policy-related protections and infrastructure provided protections both were represented using flood protection levels, i.e. return periods, and the return periods were converted into flood depth thresholds. To determine the effects of the flood protection levels, their procedures have two main steps. First, the exposed population was quantified for a baseline scenario; second, the exposed population changes were quantified by increasing the flood protection levels (correspondingly increasing the flood depth thresholds) and population in regions with flood depths lower than the flood protection levels were not influenced. The two steps were repeated in the study by Willner et al (2018). Overall, the study by Willner et al (2018) was based on the water depth thresholds to determine the effects of flood inundation. In our study, the flood depth thresholds were assumed to be the dike heights, i.e. when water depth is lower than the dike heights, the region is not influenced by floods. Therefore, our calculation procedures about the effects of flood protections are similar to the study by Willner et al (2018).
4.2. Implications
When increasing flood protection levels, the regions with high protection levels would have large economic volume since the regions would be considered safe, which would increase the economic exposure to extreme floods when protection infrastructures breach. This phenomenon is often termed levee effects. The levee effects result from the lack of awareness of potential flood risk or the lack of guided development (Burton et al 1968, Baldassarre et al 2013). The risk maps generated in this study provide the likely extent and occurrence of flood inundation for various locations, which could be used to guide economic development and land use management in the Yangtze River to reduce economic exposure. In addition, the flood risk maps can also be used to raise societal awareness of potential flood risk and therefore could help reduce exposure. The analytical framework developed in this study can provide information to support the development of appropriate flood prevention strategies. The framework can also be used to investigate benefits of increasing dike heights along other riverbanks or at other specific locations. We calculated the reductions in economic exposure with different flood defence dike heights. Our results highlight that it is important to consider trade-offs between reducing GDP exposure to flooding and developing the economy. Our study is helpful for balancing reductions in GDP exposure to flood risk against economic development in different areas. Our results have significant policy and socioeconomic development implications.
The height of flood dikes should be decided through consideration of the costs and benefits of increasing dike heights, including consideration of socioeconomic, environmental and ecological factors (Vousdoukas et al 2020). It is important to consider trade-offs between reducing economic exposure to flooding and protecting natural habitats and the environment. A cost-benefit analysis of flood defences is necessary in planning for flood protection in the basin (Jongman 2018). The construction cost information is lacking in China, which is challenging not only for us but also for other studies at the moment. We have provided a quantitative analysis of the benefits of increasing flood dike heights. The benefit analysis should be the first step of a full cost-benefit analysis. The cost-benefit analysis can be carried out to estimate hydraulic infrastructure design floods of a return period without the real cost information as suggested by Botto et al (2014) and Qi et al (2016). Therefore, our estimated benefit information is useful for the cost-benefit based design flood estimation based on the approaches developed by Botto et al (2014) and Qi et al (2016), and our study approach is helpful for flood risk management in the basin and beyond.
4.3. Limitations
In this study, we only quantified the contribution of climate-induced changes in weather-related flood events over the 1991–2015 period and not the contribution of climate change compared to the pre-industrial levels/other time periods; we did not distinguish the contribution from anthropogenic and natural climate changes as suggested by Sauer et al (2021). Our methodology is similar to the study by Sauer et al (2021). Although our study was based on continuous simulation for 1991–2015 (because of the limitations of the datasets used), the developed model and framework in this study can be easily extended to other time periods and regions when necessary data are available.
Currently, there are over 60 000 dams and reservoirs in the Yangtze River Basin. The operation rules of individual reservoirs vary. The detailed information on the over 60 000 dams and reservoirs, such as exact locations, storage capacity and operation rules, is not detailed enough or even lacking. The flood protection level modelled by Wang et al (2021) is at a county level, and has low accuracy (only about 50%). This dataset does not include dam, reservoir and dike information. Our study is in the 500 m spatial resolution, and the data modelled by Wang et al (2021) does not fulfil our need. It is challenging to simulate the flood control processes of such a large number of reservoirs and dams at the moment. Therefore, we investigated the potential flood risk in the Yangtze River Basin. The flood defence infrastructures could reduce GDP exposure generally. Therefore, the actual GDP exposure should be lower than the estimated potential GDP exposure. Despite the limitation, our study provides the first systematic and quantitative assessment of the spatial distribution of potential flood risk with relatively high spatial resolution, quantitative attribution of the potential flood risk, and quantitative assessment of the economic benefits of raising dike heights. The results could provide the baseline information to support flood risk management and adaptive economic development for the region.
When constructing flood protection infrastructure, the population who lives in the floodplain would need to be evicted, which could lead to a large number of human displacement. Such displacement would face the obstacles that people would be reluctant to move, which should be considered in the decision making. When flood protection levels are raised to prevent flooding, the water depth in the river route/other regions would increase, and the required flood protection levels would also increase. Like the studies by Willner et al (2018) and Vousdoukas et al (2020), we also did not consider such feedback because it is challenging not only for us but also for other studies at the moment in such a large river basin. Without considering the feedback, our estimation could be considered as the minimum flood protection levels required to achieve the corresponding flood protection. Inland water flooding and backwaters are difficult to be completely prevented by dikes alone. We studied the effects of flood protection levels provided by dikes in this study, and combinations of different flood protection measures that could provide similar flood protection levels as the dike heights could also be investigated in the future.
5. Conclusions
The Yangtze River Basin accounts for approximately 30% of China's GDP and is an engine for the country's rapid economic growth. Flooding in the Yangtze River Basin could severely damage economy and human well-being. In this study, we quantitatively investigated potential flood risk in the Yangtze River from 1991 to 2015. The following conclusions are presented on the basis of this study.
First, we developed a framework by extending a large scale hydrological model, combining a hydraulic model and a long-term GDP dataset to quantify the potential economic exposure to flooding in the Yangtze River. The developed framework could potentially be used in other regions for flood risk studies.
Second, we found that GDP growth raised economic exposure to flooding, while climate-induced variations in flooding inundation area and resulted economic exposure were decreasing overall.
Third, we generated flood hazard maps for the entire Yangtze River Basin with relatively high spatial resolution (about 500 m). The created potential flood risk maps could be used as references for flood risk management and adaptation, to raise awareness of flooding, and to help prioritize mitigation and response efforts.
Fourth, we presented alternative flood defence dike heights and corresponding benefits (i.e. avoided GDP exposure). To achieve an about ten-year average flood occurrence, the basin average flood defence dikes should be at least approximately 3.5 m high.
Acknowledgments
This study was supported by the Young Scientists Fund of the National Natural Science Foundation of China (51809136), National Natural Science Foundation of China (41971304), the Strategic Priority Research Program of the Chinese Academy of Sciences (XDA20060402), Shenzhen Science and Technology Innovation Committee (JCYJ20190809155205559), Stable Support Plan Program of Shenzhen Natural Science Fund (20200925155151006), Shenzhen Science and Technology Program (KCXFZ20201221173007020). The discharge and water level data used here are available from hydrology bureaus and can be obtained by contacting the Ministry of Water Resources of the People's Republic of China (www.mwr.gov.cn/english/). All authors discussed the results and contributed to the preparation of the manuscript. The authors declare that they have no competing interests.
Data availability statement
The data that support the findings of this study are available upon reasonable request from the authors.