

Abstract
Elevated tropospheric ozone concentration ([O3]) may substantially influence the belowground processes of the terrestrial ecosystem. Nevertheless, a comprehensive and quantitative understanding of the responses of soil C and N dynamics to elevated [O3] remains elusive. In this study, the results of 41 peer-reviewed studies were synthesized using meta-analytic techniques, to quantify the impact of O3 on ten variables associated with soil C and N, i.e. total C (TC, including soil organic C), total N (TN), dissolved organic C (DOC), ammonia N (NH4+), nitrate N (NO3−), microbial biomass C (MBC) and N (MBN), rates of nitrification (NTF) and denitrification (DNF), as well as C/N ratio. The results depicted that all these variables showed significant changes (P < 0.05) with [O3] increased by 27.6 ± 18.7 nl l−1 (mean ± SD), including decreases in TC, DOC, TN, NH4+, MBC, MBN and NTF, and increases in C/N, NO3− and DNF. The effect sizes of TN, NTF, and DNF were significantly correlated with O3 fumigation levels and experimental duration (P < 0.05). Soil pH and climate were essential in analyses of O3 impacts on soil C and N. However, the responses of most variables to elevated [O3] were generally independent of the O3 fumigation method, terrestrial ecosystem type, and additional [CO2] exposure. The altered soil C and N dynamics under elevated [O3] may reduce its C sink capacity, and change soil N availability and thus, impact plant growth and enhance soil N losses.
Export citation and abstract BibTeX RIS

Original content from this work may be used under the terms of the Creative Commons Attribution 4.0 license. Any further distribution of this work must maintain attribution to the author(s) and the title of the work, journal citation and DOI.
1. Introduction
Tropospheric ozone (O3) is an important greenhouse gas that contributes to global warming (Zhao et al 2019), and is a pollutant that is detrimental to human health and damages vegetation (Krupa and Manning 1988, Jerrett et al 2009). O3 is known to impair plant growth by reducing the photosynthetic rate, causing decreased yield and quality of sensitive species (Mills et al 2018, Ainsworth et al 2020). In recent years, considerable attention has been paid to belowground ecosystem processes. Elevated [O3] may impact the C allocation to roots (Andersen 2003), thereby altering rhizodeposition (Kou et al 2014), changing the amount and composition of the root exudate (McCrady and Andersen 2000), modifying the nutrient and energy supply to soil microorganisms (Feng et al 2015), shifting the microbial diversity and community structure (Phillips et al 2002, Min et al 2015, Chen et al 2019), and accordingly, influence soil C and N dynamics (Kanerva et al 2007, Hu et al 2018). The O3-induced alternation in soil C and N status may influence C sequestration capability, greenhouse gas emissions, and ecosystem N losses, which might have feedback effects on climate change (Kanerva et al 2006, Chen et al 2015b).
The effects and mechanisms of elevated [O3] on belowground processes remains controversial despite extensive research. For example, numerous studies found that the belowground C allocation increases under elevated [O3] (Nouchi et al 1995, McCrady and Andersen 2000, Duckmanton and Widden 2018), whereas others obtained contrary results (Landolt et al 2000, Yoshida et al 2001, Andersen et al 2010). In addition, many studies showed that elevated [O3] remarkably decreased soil NH4 + and NO3 − contents, and thus reduced soil N availability (Holmes et al 2003, Kanerva et al 2006, Pereira et al 2011, Formánek et al 2014, He et al 2014, Kou et al 2014, Toet et al 2017), whereas others reported the opposite results (Chen et al 2015a, Wu et al 2016). Moreover, Mörsky et al (2008) found that elevated [O3] increased soil microbial biomass, whereas others showed that it was unaffected (Cheng et al 2011, Zhang et al 2014) or decreased (Phillips et al 2002, Kanerva et al 2008, Bao et al 2015). The factors which drove the discrepancies in findings across studies were still unclear.
This study aimed to assess the responses of soil C and N contents, N transformation processes, and microbial biomass to elevated [O3] by using meta-analytic techniques. The sources of variation were evaluated by addressing the following questions. (1) How do O3 fumigation level, experimental duration, and O3 fumigation methods affect the responses of soil C and N dynamics to elevated [O3]? (2) Do O3-induced responses of soil C and N dynamics vary with various terrestrial ecosystems? (3) Do soil sampling types, soil pH, additional elevated [CO2], as well as geographical and climate conditions impact the responses of soil C and N dynamics to elevated [O3]?
2. Material and methods
2.1. Data sources
All peer-reviewed literature, including journal articles, degree dissertations, and monographs related to soil C and N status with reference to elevated [O3], were extensively searched through the ISI Web of Science (https://apps.webofknowledge.com) and the Scopus (www.scopus.com) by using the following key terms: [O3 OR ozone] AND [soil OR rhizospher* OR terrestrial OR land] AND [carbon OR TC OR *OC OR TN OR *nitr* OR ammon* OR mineraliz*]. The relevant Chinese literatures were searched in the China National Knowledge Infrastructure Database (CNKI, www.cnki.net/). This search produced a total of 579 publications in ISI, 533 publications in Scopus, and 507 publications in CNKI. After examining the relevance, eliminating the duplications in both ISI and Scopus, and cross-checking the reference lists to avoid missing relevant studies, 75 publications were identified for further screening.
The searched publications were carefully screened according to the following criteria. (i) The studies were conducted in the field, and reported O3 effects on at least one of the interesting variables, including total C (TC, including soil organic C), dissolved organic C (DOC), microbial biomass C (MBC), total N (TN), ammonia N (NH4 +), nitrate N (NO3 −), microbial biomass N (MBN), nitrification (NTF) rate, and denitrification (DNF) rate. (ii) The microclimate, vegetation, and initial soil conditions were the same between the control (ambient O3) and O3 enrichment treatments. (iii) The means, standard deviations (SDs), and replicate numbers (n) of the target variables could be directly acquired or obtained from the corresponding authors. (iv) The O3 fumigation was performed over at least one growing season using open top chamber (OTC) or free-air O3 concentration enrichment (FACE) technology. (v) Published articles and their measurements were excluded if the data were reported more completely in another article. (vi) For studies on O3 and CO2 treatments with full factorial design (i.e. control, CO2 exposure, O3 exposure, and combined CO2 and O3 exposure), the data of CO2 exposure alone were not extracted. According to these criteria, 22 studies based on pot-plants, 2 studies on lab cultivations, and 2 studies on lysimeters were excluded. Four publications that only reported charcoal-filtered air as control were not used. Furthermore, four articles that reported data more completely in another article were eliminated. The final database consisted of 41 articles published between 2003 and 2020, including 28 English papers indexed by both ISI and Scopus and 13 Chinese literatures indexed by CNKI (supplementary material A available online at stacks.iop.org/ERL/17/043001/mmedia). The data were acquired from 17 experiments performed at 25°28' N to 60°49' N latitude and 88°14' W to 123°24' E longitude. The mean annual temperature (MAT) ranged from 1.1 °C to 26.6 °C, and the mean annual precipitation (MAP) ranged from 460 to 1280 mm. The average increment in [O3] across all studies was 27.6 ± 18.7 nl l−1. Note that studies in the Southern hemisphere were absent from the database (Hu et al 2021).
Values for each variable were extracted independently if they were obtained from different experiments, corresponded to multiple O3 levels or additional [CO2] exposure within a single study. To acquire as many observations as possible, values were assumed independently if they were obtained from the same experiment but measured on different dates, or when the soil samples were collected from distinct layers within the soil depth range of 0–25 cm. Similar assumptions have been widely held in previous studies (Wittig et al 2009, Li et al 2017, Feng et al 2018, Meng et al 2019). Results obtained from the same experiment were considered independent and included separately in the database if they were associated with different plant species or cultivars, N treatments, and warming or drought stresses (de Graaff et al 2006).
Values of each variable from text or tables were extracted directly. Data from figures were digitized and extracted using GetData Graph Digitizer software (Version 2.26; http://getdata-graph-digitizer.com). If the data were provided with standard errors (SEs), the SD was calculated as follows:  . If confidence intervals (CIs) were reported, they were transformed into SD according to the following equation:
  , where CIL and CIU are the lower and upper confidence limits, respectively, and Zα
/2 is the Z score for a given significance level, which is 1.96 when α = 0.05 and 1.645 when α = 0.10 (Luo et al
2006). Unidentified error bars were assumed to represent SE, and unidentified replicate numbers were assumed to be the replication of the plot (Treseder 2004).
, where CIL and CIU are the lower and upper confidence limits, respectively, and Zα
/2 is the Z score for a given significance level, which is 1.96 when α = 0.05 and 1.645 when α = 0.10 (Luo et al
2006). Unidentified error bars were assumed to represent SE, and unidentified replicate numbers were assumed to be the replication of the plot (Treseder 2004).
The following categorical variables were included to explain the variations in soil C and N status in response to elevated [O3]: (i) experimental O3 level: low ([O3] ⩽ 1.5 × ambient), moderate (1.5 × ambient < [O3] < 2 × ambient), and high ([O3] ⩾ 2 × ambient); (ii) experimental duration, i.e. the duration from the beginning of experiments to the time of measurements: short (duration ⩽ 1 year), medium (1 year < duration ⩽ 3 years), and long (duration > 3 years); (iii) fumigation methods: FACE and OTC; (iv) soil sampling type: rhizosphere or bulk soil; (v) soil pH: acid (pH ⩽ 6.5), neutral (6.5 < pH ⩽ 7.0), and alkaline (pH > 7.0); (vi) terrestrial ecosystem type: woodland, grassland (including meadows), and cropland; (vii) additional elevated [CO2] treatment: no or yes. The mean [O3] in the control and in the treatment was defined as the daylight mean [O3] throughout the entire experimental season. In addition, information such as source of data, study site, latitude, longitude, O3 exposure method (FACE or OTC), soil texture and sampling depth, climate, and fertilizations were acquired directly from the selected articles or their references. Considering that very few studies focused on the interaction of elevated [O3] with drought and N additional treatments, how these factors modify soil C and N responses to elevated [O3] could not be assessed.
2.2. Analysis
The detailed information of analysis methods can be found in supplementary material B. Briefly, the meta-analyses were performed using MetaWin software (Version 2.1; Sinauer Associates, Inc., Sunderland, MA, USA) with the effect size—natural log of the response ratio (lnR) and its corresponding variance. Normal quantile plots (figure S.1) and frequency histogram of lnR (figure S.2) were plotted to check the normality of the data. A weighted random-effects model was used to assess the overall and grouped effect size. Bias-corrected 95% CIs around the effect size were generated using a bootstrapped resampling technique with 64 999 iterations. Twelve studies reported both TC and TN, representing total 64 data pairs for the calculation of C/N ratio by dividing their means. The mean effect size and CIs of C/N was estimated using an unweighted bootstrapped resampling method, since the SD of C/N could not be calculated directly. The response to elevated [O3] were considered significant if the bias-corrected 95% bootstrapped CIs did not overlap from zero. The O3-induced percentage change from the control was calculated as (R − 1) × 100% (de Graaff et al 2006). A negative percentage change indicates a decrease in the response to elevated [O3] treatment, and vice versa.
The total heterogeneity of each variable was assessed using the statistic QT and I2 index (table S.1) (Rosenberg et al 2000, Higgins and Thompson 2002, Huedo-Medina et al 2006). Categorical analysis were performed for all data by dividing QT into within-group heterogeneity (QW) and between-group heterogeneity (QB). The datasets were then grouped on the basis of the levels of the categorical variables with significant QB (table S.1) (Wittig et al 2009). The difference between the means of categories were considered to be significant if their bias-corrected 95% bootstrapped CIs did not overlap (Gurevitch and Hedges 1999, Ainsworth 2008).
Continuous models were applied to determine the relationships between lnR and environmental or forcing factors, such as O3 fumigation levels, experimental duration, soil pH value, and latitude, MAT and MAP of the experimental site. A parametric mixed model approach was used to test whether the slopes of weighted regressions differed from zero (Rosenberg et al 2000). The regressions were considered to be significant at P < 0.05.
Multiple methods were included in the test of publication bias, including funnel plots (figure S.3), Kendall's tau (table S.2) and Spearman's rho (table S.3) rank correlation tests, as well as Rosenthal's fail-safe number (α = 0.05) (table S.4) (Rosenthal 1979). A publication bias was confirmed only if all three methods showed positive results simultaneously, namely, that the funnel plot clearly showed asymmetry (only for the overall data set), or the rank correlation test was significant (P < 0.05), and Rosenthal's fail-safe number appeared less than 5k + 10, where k is the observation number. For the data set with confirmed publication bias, the 'true' overall/grouped effect size and CIs were estimated using a 'Trim and Fill' approach (Jin et al 2015).
3. Results
3.1. Overall effects of elevated [O3]
The TC and DOC reduced by 2.4% and 10.8%, respectively, under elevated [O3] compared with those under control [O3] across all studies (figure 1). The decrease in DOC content caused reduction in the MBC of 6.1%. The reduction in MBN (13.7%) was more than that in MBC, showing a generally increased C/N ratio in soil microbes under elevated [O3]. Elevated [O3] reduced soil TN and NH4 + by 4.5% and 5.8%, respectively, whereas it increased soil NO3 − by 7.0%. In addition, the changes on substrate NH4 + and NO3 − availability for nitrifying and denitrifying bacteria led to a decrease in soil NTF (7.5%) and an increase in soil DNF (5.0%), respectively. Elevated [O3] significantly increased C/N by 3.1%. And there was a strong positive relationship between effect sizes of elevated [O3] on pairwise TC and TN (P < 0.001, n = 64; figure S.4). Though the overall effects of elevated [O3] on all response variables were significant (P < 0.05), the significant QT (P < 0.05) and positive I2 values suggested heterogeneity among studies for presenting response variables except C/N (table S.1).
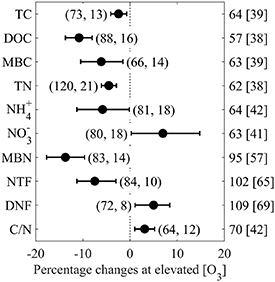
Figure 1. Overall effects of elevated [O3] on soil TC, DOC, MBC, TN, ammonia N (NH4 +), nitrate N (NO3 −), MBN, NTF, DNF, and C/N ratio. Symbols show the grand mean percentage changes under elevated [O3] relative to the control, and the bars represent the bias-corrected 95% bootstrapped CIs. Number of observations and articles are provided in parentheses. Mean elevated [O3] and control [O3] (in brackets) are given on the right side.
Download figure:
Standard image High-resolution image3.2. Effects of O3 fumigation level
The magnitude of O3 effects on soil TN, MBN, NTF, and DNF was dependent on the O3 exposure level due to their significant QB values (P < 0.05; table S.1). As illustrated in figure 2, elevated [O3] generally has the most pronounced effect at high O3 level, and it has no significant effect on these four variables at moderate O3 levels.

Figure 2. Responses of soil TN, MBN, NTF, and DNF to elevated [O3] at different O3 levels: low (∘, ⩽1.5 × ambient), moderate (•, 1.5–2 × ambient), high (□, ⩾2 × ambient). Symbols show the grand mean percentage changes under elevated [O3] relative to the control, and the bars represent the bias-corrected 95% bootstrapped CIs. For the dataset with publication bias, the 'true' mean change (*) and CIs were adjusted using a 'Trim and Fill' approach. The number of observations and articles are provided in parentheses. Mean elevated [O3] and control [O3] (in brackets) are given on the right side.
Download figure:
Standard image High-resolution imageNotably, Kendall's tau and Spearman's rho rank correlation tests for publication bias of TN were significant at low O3 level (P < 0.05), and its Rosenthal's fail-safe number was less than 295 (i.e. 5k + 10, where the observation number k = 57; tables S.2 and S.4), indicating that stronger O3 effects on soil TN at low O3 level were somewhat more likely to be published than were weaker O3 effects. To make up for the publication bias, a 'true' grouped mean effect size and CIs were estimated using the 'Trim and Fill' approach. Based on the adjusted results, TN only showed a significant decrease of 5.2% at a high O3 level (P < 0.05), while it has no significant changes at low or moderate O3 levels. The overlapped CIs suggested that no significant difference in TN existed among the three O3 levels (figure 2).
In terms of MBN, the O3-induced percentage decrease was significantly larger (P < 0.05) at high O3 levels (23.5%) than at a low O3 level (11.8%), and both were significantly different from zero (P < 0.05). Likewise, the reduction of NTF induced by elevated [O3] was significantly larger (P < 0.05) at high [O3] (16.1%) than at moderate [O3] (5.4%). As for DNF, the effect of O3 treatment was not significant at low and moderate O3 levels, and a significant increase was noted at high O3 level (12.3%; P < 0.05). No between-group heterogeneity was found for other response variables when the studies were grouped by O3 exposure level (table S.1 and figure S.5).
Weighted meta-regression analyses showed that the level of elevated [O3] was significantly negatively related with the effect sizes of TN and MBN (P < 0.05; table S.5). Moreover, there was a significant negative correlation between the effect size of NTF and O3 exposure level (P < 0.001; table S.5), whereas the increasing [O3] had a significant positive effect on the effect size of DNF (P < 0.01; table S.5). As expected, the higher O3 concentration is, the greater the impacts on these variables would be.
3.3. Effects of experimental duration
The temporal patterns of responses of soil NO3 −, MBN, NTF, and DNF were investigated by grouping the data by experimental duration, because of their significant QB values (P < 0.05). Soil MBN and NTF progressively decreased with increasing duration of exposure to elevated [O3], whereas an inverse trend was observed for DNF (figure 3 and table S.5). Short O3 exposure had no significant effect on MBN and DNF, whereas it marginally significantly increased soil NO3 − and NTF by about 15.0% and 6.0%, respectively. For the medium experimental duration, MBN and NTF declined moderately with average reductions of 17.2% and 14.2% (P < 0.05), respectively, whereas the changes of NO3 − were not significantly different from zero. Note that the DNF for medium experimental duration showed publication bias according to the results of Kendall's tau and Spearman's rho rank correlation tests, as well as Rosenthal's fail-safe number (tables S.2 and S.4). After adjustments using the 'Trim and Fill' method, the 'true' effect size of DNF for medium O3 exposure duration was still significantly increased (10.4%, P < 0.05). The O3-induced percentage decline of MBN for long O3 exposures (16.0%) were similar to that at medium exposures, whereas NTF was markedly (22.9%) decreased by O3 exposure of >3 years. The percentage increase in DNF after long O3 exposure was approximately two times higher than that after medium exposure. As expected, the longer the duration of O3 exposure, the more pronounced was the O3 impact on these variables. The only exception was NO3 −, which showed a similar change (16.3%, P < 0.05) under long O3 exposure as that under short duration.

Figure 3. Responses of soil nitrate N (NO3 −), MBN, NTF, and DNF to elevated [O3] at different experimental durations: short (∘, ⩽1 year), medium (•, 1–3 years), and long (□, >3 years). Symbols show the grand mean percentage changes under elevated [O3] relative to the control, and the bars represent the bias-corrected 95% bootstrapped CIs. For the datasets with publication bias, the 'true' mean change (*) and CIs were adjusted using a 'Trim and Fill' approach. The number of observations and articles are provided in parentheses. Mean elevated [O3] and control [O3] (in brackets) are given on the right side.
Download figure:
Standard image High-resolution imageThe heterogeneities on the responses of soil TN, NTF and DNF to different O3 durations could be explained by the continuous model, according to the significant QM values (P < 0.05). As expected, the longer the duration of O3 exposure, the more pronounced were the O3 impacts on NTF and DNF. The duration of ozone exposure did not induce significant differences in other response variables (tables S.1 and S.5; figure S.6). Soil TC content for medium experimental duration showed publication bias (tables S.2 and S.4), indicating that stronger O3 effects were somewhat more likely to be published than weaker O3 effects under such circumstance. After being adjusted using the 'Trim and Fill' method, the 'true' mean effect size of TC for medium experimental duration showed a significant decrease of 10.4% (P < 0.05; figure S.6).
3.4. Effects of O3 fumigation methods
Of the total 41 articles, 24 and 17 reported the use of FACE and OTC, respectively. According to the results of heterogeneity analysis (table S.1), the fumigation method significantly affects the responses of MBC, MBN and NTF to elevated [O3], but did not induce significant differences in other response variables. Of three variables with significant QB values, MBC and MBN showed overlapped CIs between FACE and OTC (P > 0.05; figure S.7), while only NTF showed a significant larger decrease in FACE than that in OTC (P < 0.05; figure S.7).
3.5. Effects of soil sampling types
Soil MBC, MBN, NH4 +, NO3 −, NTF and DNF showed significant QB values (P < 0.05) between rhizosphere soil and bulk soil (table S.1). For rhizosphere soil samples, elevated [O3] significantly decreased MBC, MBN and NTF by 14.9%, 18.0% and 12.9%, respectively (P < 0.05); and increased soil NO3 − and DNF by 20.1% and 11.5%, respectively (P < 0.05); while it has no significant impact on soil NH4 + (figure 4). On the contrary, elevated [O3] has no significant effect on these variables in bulk soil, except it significantly reduced bulk soil NH4 + by 10.1% (P < 0.05; figure 4). The differences on the responses of soil MBC, MBN, NTF and DNF between rhizosphere and bulk soil were significant (P < 0.05) owing to their un-overlapped CIs (figure 4). No between-group heterogeneity was found on other response variables when the studies were grouped by soil sampling type (table S.1 and figure S.8).
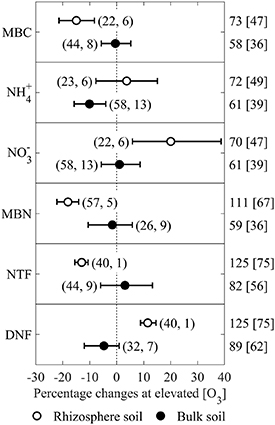
Figure 4. Percentage response of soil MBC, ammonia N (NH4 +), nitrate N (NO3 −), MBN, NTF and DNF to elevated [O3] for different soil sampling types: rhizosphere soil (∘) and bulk soil (•). Symbols show the grand mean percentage changes under elevated [O3] relative to control, and the bars represent the bias-corrected 95% bootstrapped CIs. The number of observations and articles are provided in parentheses. Mean elevated [O3] and control [O3] (in brackets) are given on the right side.
Download figure:
Standard image High-resolution image3.6. Effects of soil pH
The O3-induced impacts on soil C and N were potentially related to the pre-existing soil pH (table S.1). The responses of soil TC, TN, NH4 +, and NTF to elevated [O3], grouped by soil pH according to their significant QB values (P < 0.05) are shown in figure 5.

Figure 5. Effects of elevated [O3] on soil TC, TN, ammonia N (NH4 +), and NTF for categories of soil pH: acid (∘, pH ⩽ 6.5), neutral (•, 6.5 < pH ⩽ 7.0), alkaline (□, pH > 7.0). Symbols show the grand mean percentage changes under elevated [O3] relative to control, and the bars represent the bias-corrected 95% bootstrapped CIs. For the dataset with publication bias, the 'true' mean change (*) and CIs were adjusted using a 'Trim and Fill' approach. The number of observations and papers are provided in parentheses. Mean elevated [O3] and control [O3] (in brackets) are given on the right side.
Download figure:
Standard image High-resolution imageA statistically significant decrease in TC under elevated [O3] occurred in neutral soil (7.2%, P < 0.05), whereas a marginally significant decrease was noted in alkaline soil (1.9%), and no significant change was found in the acid soil. Soil TN content in response to elevated [O3] was reduced by 4.3% (after being adjusted by the 'Trim and Fill' approach due to significant publication bias) and 6.1% in neutral and alkaline soils, respectively; and not affected significantly in acid soil (figure 5). Detailed meta-regression analysis showed that the O3-induced effects on soil TN content were significantly and negatively related to soil pH (P < 0.001; table S.5), indicating that the negative O3 effects on TN were exacerbated at higher soil pH.
In addition, lower soil pH caused stronger declines in soil NH4 + content under elevated [O3] (figure 5). Soil NH4 + was remarkably decreased by 23.6% (P < 0.05) in acidic soil, but was not significantly affected in both neutral and alkaline soils. Indeed, the effect size of soil NH4 + was positively correlated with soil pH (P < 0.001; table S.5), which indicated that higher soil pH ameliorates the negative O3 effects on soil NH4 + content.
Elevated [O3] strongly decreased soil NTF by 5.7% and 20.6% in acid and neutral soils, respectively (figure 5), and this effect was significantly negatively related to soil pH (P < 0.001; table S.5).
Although statistically or marginally significant negative effects of elevated [O3] were noted on soil MBN, no significant differences were observed among soil pH classes (figure S.9). However, the weighted meta-regression analysis showed a significant negative relationship between the effect size of MBN and soil pH (P < 0.01; table S.5).
The number of studies for DNF in neutral and alkaline groups were not sufficient to conduct quantitative comparisons. However, the weighted meta-regression analysis showed a strong significant negative relationship between the effect size of O3 on DNF and soil pH (P < 0.01; table S.5).
3.7. Other categorical analyses
Significant heterogeneities were found on TN and MBN in response to elevated [O3] across terrestrial ecosystems (P < 0.05; table S.1). However, there were no significant differences among groups for TN owing to the overlapped CIs (figure S.10). On the contrary, soil MBN was significantly reduced by 17.9% in cropland, and was significantly different from that in grassland which tended to be increased (P < 0.05; figure S.10).
In addition, only TN, NH4 + and NO3 − have sufficient studies (k > 10) to conduct comparisons between solely O3 stress and combined O3 and CO2 exposure. However, there was no between-group heterogeneity for either variable (table S.1). Thus, the magnitude of the responses to elevated [O3] were independent of the additional [CO2] exposure in the present analysis.
3.8. Effects of latitude and climate conditions
The results of weighted meta-regression analyses for response variables in correlation with latitude, MAT, and MAP are shown in table S.6. The effect sizes of soil TN, MBN, and DNF were significantly correlated with latitude (P < 0.05). Taking as an example the regressing results of MBN (lnR(MBN) = 1.02 × 10⁻² × Latitude−0.528), the fitted effect size of MBN varied from −0.269 to 0.090 within a latitude range of 25°28' N to 60°49' N in the present study. This means the ozone effects on MBN were negative at lower latitudes, but were positive at higher latitudes. Thus, the negative intercepts and positive slopes of the regression on TN and MBN implied stronger detrimental effects (i.e. more negative effect sizes) of O3 on these variables at lower latitudes. In contrast, the intercept of DNF was positive, and the slope was negative. It suggested that the O3 effect on the soil DNF process may be stimulated (i.e. more positive effect sizes) at lower latitudes.
The magnitude of response variables were significant (TC, MBN, and DNF; P < 0.05) or nearly significantly (NH4 +; P = 0.079) related with MAT. The regressions of TC and DNF had negative intercepts and positive slopes, whereas NH4 + and MBN had positive intercepts and negative slopes. With an increase in MAT, the effect size of DNF became more positive, whereas the effect sizes of NH4 + and MBN became more negative. It indicated that higher temperature would benefit the O3 induced adverse effects on soil NH4 + and MBN and the positive effects on soil DNF, which were consistent with the results on latitude, since low latitude is generally related to a higher temperature.
In addition, response variables except DOC, MBN and NTF exhibited significant (P < 0.05) or marginally significant (P = 0.061 for TC; P = 0.059 for MBC) responses to MAP. Although they had very small slopes, TC and TN showed positive intercepts and negative slopes, whereas MBC, NH4 +, NO3 −, and DNF showed negative intercepts and positive slopes. Thus, the negative responses of TC and TN, and the positive responses of NO3 − and DNF to elevated [O3] would be promoted at high precipitation, however, the O3-induced inhibiting effects on MBC and NH4 + would be mitigated.
4. Discussion
4.1. Possible mechanisms on mean O3 effects
The overall meta-analysis showed that elevated [O3] decreased both C and N pools in soil. Ozone is a highly reactive and oxidative pollutant and is destroyed rapidly when interacting with plant surfaces, causing a vertical gradient of decreasing O3 concentrations towards the ground and preventing any appreciable penetration of O3 into the soil (Turner et al 1974, Blum and Tingey 1977). Therefore, the effects of O3 on soil C and N seem unlikely to be direct, but are likely to be mediated indirectly through altering the quantity and quality of plant C inputs and resource allocations (Andersen 2003, Kasurinen et al 2005, Kanerva et al 2006).
Previous meta-analytic studies revealed that chronic O3 exposure decreased photosynthetic rates, Rubisco activity, stomatal conductance, and chlorophyll content, and eventually altered source-sink balance in sensitive plants (Andersen 2003, Valkama et al 2007, Feng et al 2008, Feng and Kobayashi 2009, Wittig et al 2009, Li et al 2017, Feng et al 2018). Although the observed responses vary depending on the species and exposure conditions, elevated [O3] is known to seriously influence the transport of photosynthates from leaves to roots. In many cases, decreased root C allocation occurred rapidly and even before shoot responses could be observed (Andersen 2003). Decreased C allocation below ground altered rhizodeposition, reduced the quantity of root residue and exudates and thereby decreased C flux from root exudates to the soil labile C pool (Yoshida et al 2001, Andersen 2003, Jones et al 2009). Therefore, the contents of soil TC and DOC generally decreased under elevated [O3] (figure 1). As a labile form of soil C, DOC principally consists of low-molecular-weight sugars, fulvic acids, and amino acids (McKeague et al 1986, van Hees et al 2005). The greater reduction of DOC than that of TC may suggest a relative enrichment of recalcitrant organic C, such as high-molecular-weight phenolic compounds, in soil (Jones et al 2009). Since soil microorganisms are generally C-limited (Anderson and Domsch 1978), the decrease in soil labile C availability may explain the reduced soil microbial biomass (figure 6) (de Graaff et al 2006).
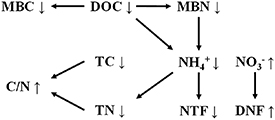
Figure 6. Schematic representations of the O3 effects on soil C and N. TC: total C; DOC: dissolved organic C; MBC: microbial biomass C; TN: total N; NH4 +: ammonia N; NO3 −: nitrate N; MBN: microbial biomass N; NTF: nitrification; DNF: denitrification; C/N: ratio of TC to TN. Up and down arrows represent positive and negative effects, respectively.
Download figure:
Standard image High-resolution image
The availability of soil TN, particularly NH4 + contents, were also reduced under elevated [O3] (figure 1). The inhibition of soil N availability indicated a deficiency in available N for soil microbes under elevated [O3]. The reduced soil NH4 + concentrations or MBN in response to elevated [O3] could be attributed to the decreased belowground C inputs (Kanerva et al 2006, Bhatia et al 2011), or, in some cases, higher NTF and DNF rates (Pereira et al 2011). Indeed, the DNF rate was generally higher under elevated [O3] (figure 1). Previous studies have shown that soil oxygen concentration, NO3 − availability, as well as organic C supply are the three most important factors that determine the DNF rate (Del Grosso et al 2000, Lu et al 2011). Since soil DOC was generally decreased under elevated [O3], the acceleration of the DNF process may be attributed to the increased NO3 − availability (figure 6), and in some cases, decreased oxygen concentration due to the relative increases in the soil water content driven by the reduced stomatal conductance and transpiration rates under elevated [O3] (McLaughlin et al 2007, Hu et al 2018). In contrast, the NTF rate was generally reduced by O3 stress (figure 1). Soil NTF rates have shown to be mainly controlled by soil NH4 + availability (figure 6) (Norton 2008). Decreased substrate quantity and quality under elevated [O3] may exert negative effects on soil NTF. In theory, the inhibited NTF rate and accelerated DNF rate would decrease soil NO3 − under elevated [O3]. The marginally significant increase of soil NO3 − may be explained by the suppressed N demand for plant shoots due to reduced biomass (Broberg et al 2017). Moreover, the increased NO3 − may result in a high risk of soil N loss via leaching and runoff (Hu et al 2018).
4.2. Confounding O3 effects among classes
The response magnitudes of most variables to elevated [O3] were affected by O3 levels, experimental duration, soil pH and sampling type, etc. However, these categorical factors may couple with each other. For example, [O3] in the control and the elevated treatment for rhizosphere soil were generally higher than that for bulk soil (figure 4), which may lead to more significant responses of MBC, MBN, NH4 +, NO3 −, NTF and DNF in rhizosphere soil than that in bulk soil. In addition, MBN responded more significantly in cropland than that in grassland because of the much higher [O3] in the former, and higher a O3 level would exacerbate the detrimental effect of O3 on soil MBN owing to the significant negative regression relationship (P < 0.05; table S.5).
Note that the O3 effects on MBN and NTF were non-significant under a moderate O3 level, while they significantly decreased at low and high O3 levels. One possible reason is the relatively lower mean [O3] of both control and experimental treatments for theses response variables under a moderate O3 level (figure 2). In another case, medium O3 exposure had no significant effect on NO3 −, while it significantly increased at short and long O3 exposures. The relative smaller or even opposite responses of these variables at a moderate (medium) group than that at a low (short) or high (long) groups may also reflect the possibility of soil microbial acclimation to moderate doses of O3 stress. Recently, Agathokleous et al (2019a, 2019b, 2019c) found that many determinants of plant yield followed hermetic-like biphasic dose-response relationships under elevated [O3] stress. Since the effect of elevated [O3] on soil processes are generally mediated indirectly through plants, it may also yield pleiotropic responses. Based on this assumption, the moderate doses of O3 stress may upregulate adaptive responses that may enhance both microbial and biochemical resilience, while high doses may induce inhibitory responses to soil microbes (Agathokleous et al 2019a).
In general, autotrophic nitrifiers function better under neutral and/or slightly alkaline conditions, and NTF rates are often low in acidic soils (Chen et al 2013). In the present analysis, the responses of NTF in acid soil was significantly less negative than that in neutral soil according to their un-overlapped CIs (P < 0.05; figure 5). Note that the increment of [O3] was higher in acid soils (42 nl l−1) than that in neutral soils (19 nl l−1). And higher O3 level under acid condition should have exacerbated the detrimental effect of O3 on NTF. The seemed paradoxical results may be explained by the longer experiment duration (average of 3.7 years) in neutral soil than that in acid soil (average of 1.9 years), since O3 effect on NTF was significantly negatively related to experimental duration (P < 0.001; table S.5). In other words, the regression relationship between NTF and soil pH may be essentially related to the regression relationship between NTF and O3 exposure duration.
The O3-induced effect on NTF was more negative at alkaline condition (figure 5). It means the ability for oxidizing NH4 + to NO3 − was more restrained by elevated [O3] at higher soil pH, which is conducive to the reserve of soil NH4 + (i.e. the substrate for NTF). In other words, the negative O3 effects on soil NH4 + content was ameliorated at higher soil pH (figure 5). Moreover, the number of DNF data was not enough to conduct a categorical analysis at different soil pH levels. But its general increasing pattern (figure 1) may imply an increase in soil N2O emissions under elevated [O3]. ŠImek and Cooper (2002) reported that heterotrophic denitrifiers function better at higher soil pH. Consequently, the total gaseous N loss via DNF would be higher in neutral and slightly alkaline soils than acidic ones. It may explain the exacerbated TN loss due to elevated [O3] at higher soil pH.
In addition, the increase in [O3] used in OTC experiments (40.0 nl l−1) was generally higher than that used in FACE experiments (23.1 nl l−1) for NTF, and higher [O3] was supposed to exacerbate the detrimental effect of O3. However, NTF decreased more in FACE than that in OTC (figure S.7), which may be attributed to the longer experiment duration in FACE studies. Consequently, extended duration may counteract the limitation of lower O3 levels on soil NTF responses to elevated [O3] in FACE and neutral soil conditions.
Since O3 exposure level and duration may offset one another in explaining response variances among groups, a better way would be to combine them together as a cumulative dose variable. The commonly used dose-based indices are accumulated O3 exposure indices (such as AOT40, SUM06 and W126) and flux-based index (e.g. PODY). They all played significant roles in quantifying O3 impacts on plant growth and soil properties (Zhang et al 2017, Hu et al 2019). However, the calculation of exposure indices requires hourly averaged [O3] and effective fumigation time, and the calculation of PODY required further information including hourly data of photosynthetic photon flux density, temperature, water vapour pressure deficit and plant available water, etc. In the 41 papers of present meta-analysis, only 9 papers reported AOT40. So far, we can not obtain the hourly data for the calculation of dose indices for the other 32 studies. Estimating the cumulative dose by multiplying daylight mean [O3] and plant growing season is infeasible and will import immeasurable errors. Because [O3] has obvious daily and seasonal variations, and O3 fumigation usually only applied during the daylight 7–9 h except for rain, dew and fog. Moreover, the effect of elevated [O3] on soil C and N varied with plant growing stages (Hu et al 2018). Once enough data has been gathered, an updated categorical and/or continuous meta-analysis based on dose index will be more efficient in revealing the variation mechanisms of O3 impacts on soil C and N.
4.3. Effects of climate conditions on soil C and N responses to elevated [O3]
Previous studies have reported contrasting effects of warming and O3 on plant physiology, rhizosphere chemical environment, and microbial communities (Changey et al 2018, Qiu et al 2018). In addition, some studies showed that moderate drought might alleviate the O3 effects on photosynthesis, physiology, stomata characteristics, fine-root dynamics, and soil respiration (Xu et al 2017). However, the results of weighted meta-regression analyses in the present study revealed that the responses of soil C and N dynamics to elevated [O3] were generally enhanced at low latitudes—warmer areas with higher precipitation. Note that the lower the latitude is, the longer the annual growing season as well as the effective O3 fumigation time would be. In the present study, the average O3 exposure duration was estimated to be approximately 6 months per year for sites south of 40° N, while it was about 4 months for sites north of 40° N. This may partially explain the detrimental O3 effect at low latitudes. Moreover, soil microbial activities associated with N cycling, such as NTF and DNF, were usually stimulated with increasing temperature (Saad and Conrad 1993). Moreover, increased MAT and MAP usually accelerated soil N leaching losses from terrestrial ecosystems (Jabloun et al 2015). Thus, a decrease in soil N availability due to increased temperature and precipitation may exacerbate the negative O3 effect on soil N pool (Lu et al 2011).
5. Conclusions and outlook
Understanding the effects of elevated [O3] on soil C and N is important, since soil is a major C source or sink, and soil N availability not only limits plant growth but also controls soil N losses. Our meta-analysis revealed that elevated [O3] substantially influenced both C and N dynamics, and thus altered the ability of the soil to store and cycle these nutrients. In general, under elevated [O3], soil TC, DOC, TN and NH4 + contents decreased, microbial growth and NTF rate was inhibited, while soil NO3 − content, hence, DNF rate were stimulated. Soil NTF and DNF were more responsive to elevated [O3] under higher O3 levels, extended fumigation durations, and higher soil pH values. The response magnitudes of most variables to elevated [O3] were exacerbated at low latitudes—warm areas with high precipitation, while they were generally independent of the fumigation method, terrestrial ecosystem types, and additional elevated [CO2].
Meta-analysis has a very important role in generalizing across studies. The moderators in the present study, including discrete factors and continuous variables, provided useful information and enriched the understanding about discrepancies of soil C and N responses to elevated [O3]. However, some confounding effects among classes may influence the robustness of the meta-analysis. For example, the greater O3 effects on rhizosphere soil than on bulk soil may be ascribed to the higher O3 levels in the former. And in some cases, longer experimental duration conquered the limitation of lower level O3 impacts on soil NTF in FACE and neutral soil conditions. Moreover, some controversial issues including NTF and NO3 − at a moderate O3 level (figures 2 and S.5), NH4 + at short and long duration groups (figure S.6) cannot be fully explained due to large measurement uncertainties. Dose indices combining the duration and level of O3 exposure may explain the resulting impacts more compactly. However, there is insufficient dose data in current literature. The limitations of the present study require further investigation in the future. In addition, a more comprehensive meta-analysis on both aboveground and belowground response are required to validate the indirect mediated hypothesis of O3 impacts on soils. As the research progresses, an increasing number of associated data will be published, making it possible to reveal the response routes and mechanisms of the whole plant-soil system to elevated [O3].
Acknowledgments
This work was supported by the National Natural Science Foundation of China (41977388, 31971509 and 31670412), the Liaoning Revitalization Talents Program (XLYC2007127), the Fundamental Research Funds for the Central Universities (N2025008).
Data availability statement
The data that support the findings of this study are openly available at the following URL/DOI: http://doi.org/10.6084/m9.figshare.16993174.