

Abstract
Proxy-based hydro-climate reconstructions in the Levant suggest enhanced water availability during the last glacial maximum (LGM) compared to present-day conditions. To date, the governing hypothesis is that additional water availability may be directly linked to increased Cyprus Low frequency and intensity in the region. However, this paradigm has not been tested in a modelling framework. With this aim, we analysed results from a weather type classification algorithm and regional climate simulations. The weather type classification is applied to ERA5 reanalysis data for present-day (1979–2018) and two Paleoclimate Modelling Inter-comparison Project PMIP3/PMIP4 pre-industrial and LGM model runs. Dynamical downscaling of the two models with the regional Weather Research and Forecast model shows that the present hydro-climate can largely be reproduced. Our simulations suggest that both evaporation and precipitation were lower in the LGM compared to pre-industrial conditions, and that their relative changes can thus most likely explain the additional water availability during that time. Indeed, evaporation in the eastern Mediterranean is reduced to a higher degree (∼−33%) as compared to precipitation (∼−20%) during the LGM. Particularly, lower evaporation during LGM summer may have sustained the year-round wetter conditions in the Levant. In addition, we find significant changes in Cyprus Low characteristics for the LGM. The simulated daily precipitation associated with Cyprus Lows is significantly lower than pre-industrial values (reduction of 26%–29%), whereas the wind intensity is stronger (increase of 7%–8%). Finally, a significant increase in Cyprus Low frequency during LGM winter is likely (+22%). Indeed, our findings are in line with a plethora of proxy-based reconstructions, and provide a reinterpretation of the driving mechanism of water availability, i.e. strong changes in evaporation rather than precipitation. This study places projected hydro-climatic drying of the Levant in a long timescale perspective. As such, it improves our understanding of the physical processes influencing the hydrological cycle in this vulnerable region, situated on the border between sub-tropical and mid-latitude climate zones.
Export citation and abstract BibTeX RIS

Original content from this work may be used under the terms of the Creative Commons Attribution 4.0 license. Any further distribution of this work must maintain attribution to the author(s) and the title of the work, journal citation and DOI.
1. Introduction
The past hydro-climate conditions in the Levant attract continued interest. The reasons for this are two-fold: (a) the Levant is situated in a unique transition zone between mid-latitude temperate climate in the north and sub-tropical arid climate in the south. As such, even small large-scale climatic fluctuations may have a detrimental influence on the region's hydro-climate (Kushnir et al 2017). (b) The region was one of the major pathways out of Africa during relatively wet periods. These rather comfortable hydro-climate conditions enabled humans to cross the Sahara Desert on their way to Asia and Europe (Frumkin et al 2011, Lazar and Stein 2011, Mellars 2011, Hershkovitz et al 2018). Indeed, the first evidence of sedentary cultures (Natufian) and the beginning of agriculture was found in the Levant (Bar-Yosef 1998).
The present-day climate of the Levant is characterised by hot and dry weather conditions with high evaporation rates during the summer and moderate temperatures and rainy spells during the winter (Kushnir et al 2017). Most of the annual precipitation is restricted to a small number of days (Saaroni et al 2010). These rainy events are often associated with a cyclone at surface level and a trough or cut-off low at upper levels, transporting cold air masses from the north over the warm Mediterranean Sea (Alpert and Reisin 1986, Shay-El and Alpert 1991). Since the climatological footprint of these cyclones is found over Cyprus, they are regularly termed 'Cyprus Lows' (Alpert et al 1990). Alike other Mediterranean cyclones, the frequency and associated rainfall of Cyprus Lows has been projected to decline in the 21st century, while their wind intensity has been projected to increase, although with a higher degree of uncertainty (Hochman et al 2018, 2020a, Reale et al 2021). An additional essential weather type over the Levant is the Red Sea Trough that is often characterised by warm and dry weather conditions (Tsvieli and Zangvil 2005). Occasionally, the surface level trough axis may be tilted towards the Mediterranean Sea, when convoyed by an upper-level Extra-Tropical trough covering the Levant. Such conditions favour the development of short-lived heavy precipitation events particularly at south-eastern locations (Krichak et al 1997, 2012). The typical mean sea level pressure distribution for a randomly selected Cyprus Low and Red Sea Trough is shown in figures 1(a) and (b).

Figure 1. Exemplary presentation of mean sea level pressure distribution (black contours) over the eastern Mediterranean for a randomly selected (a) Cyprus Low (31 January 1992) and (b) Red Sea Trough (10 January 1992) based on ERA5-data. (c) Location of some proxy data that are discussed in this study for comparison with model data: (1) Lake Hula (Langgut et al 2021), (2) Ma'ale Efrayim Cave (Vaks et al 2003), (3) Soreq Cave (Bar-Matthews et al 1997), (4) Western Negev desert (Enzel et al 2008). Blue contour lines denote the LGM coastline.
Download figure:
Standard image High-resolution imageIn this study, we categorise the main weather types over the Levant based on a synoptic classification approach (Alpert et al 2004). This method has been shown to faithfully describe the regional weather conditions, predominantly for Cyprus Lows (Saaroni et al 2010, Dayan et al 2012, Hochman et al 2018), and has been successfully applied for both present and future climate predictions and projections (Alpert et al 2004, Saaroni et al 2010, Hochman et al 2018, 2019, 2020a, 2020b, 2020c, 2020d, 2021).
While most climate models project a drier and warmer Levant in the coming decades (Zappa et al 2015, Brogli et al 2019), large uncertainties remain in portraying the past hydro-climate variability in that region (Greve et al 2017, Kiro et al 2020). In recent decades, the region has received ample attention regarding paleo-climate reconstructions based on proxy archives (Bar-Matthews et al 1997, Bartov et al 2002, Amit et al 2006, Torfstein et al 2013, Goldsmith et al 2017, Ben Dor et al 2018, Langgut et al 2021). Important archives are e.g. lake levels (Bookman et al 2006), arid and hyper-arid soils (Goodfriend 1999), speleothems (Frumkin et al 2000), Loess and sand dune fields (Tsoar and Blumberg 2002), and Pollen archives (Miebach et al 2019). These paleo-records advise that the region has experienced dramatic climatic fluctuations in the past, particularly large glacial inter-glacial oscillations (Enzel et al 2008). However, elucidating the last glacial maximum (LGM, ∼21 ka ago; Clark et al 2009) hydro-climate based on individual proxy data frequently disagree (Enzel et al 2008). For example, dune migration in the north-western Negev (southern arid part of nowadays Israel) can be interpreted as indicative of drier conditions (Goring-Morris and Goldberg 1990, Magaritz and Enzel 1990), but also stronger winds (Pye and Tsoar 1990). Indeed, stronger wind speed that may influence dune migration can ensue under wetter, drier or no change in precipitation (Enzel et al 2008). For this reason, a framework for interpreting paleo-records over the Levant has been proposed (Enzel et al 2008). In this context, their hypothesis has been that the major control over the Levant LGM hydro-climate are the frequency and intensity of Cyprus Lows (Enzel et al 2008). According to a synthesis of proxy archives, Enzel et al (2008) proposed that Cyprus Lows have probably been more frequent during the LGM, providing increased precipitation amounts for the growth of speleothems in regions they presently cannot form (Vaks et al 2003), for the rise and maintenance of Lake Lisan, the Pleistocene predecessor of present-day Dead-Sea (Bartov et al 2002), and for the extension of forests into the northern parts of the region (Cheng et al 2015). The above-mentioned hypothesis is tested here. An overview of explicitly used proxy data locations for model comparison is given in figure 1(c).
Despite the high availability of proxy archives and their detailed interpretations, the Levant has received very little attention concerning regional paleo-climate model simulations. Undeniably, the regional modelling perspective can advance the joint interpretation of proxy archives and hydro-climate process understanding (Ludwig et al 2019, Pinto and Ludwig 2020).
In this study, we simulate the LGM hydro-climate by a regional climate model over the Levant, particularly focusing on evaporation/precipitation changes and differences in Cyprus Low frequency and intensity.
The paper is organised as follows: section 2 provides details of the methodology, including the used datasets, model simulations, and the weather type classification. In section 3 we describe the ability of the models to simulate pre-industrial hydro-climate conditions and present the results for the LGM hydro-climate and Cyprus Low characteristics as compared to pre-industrial time. Section 4 provides the main conclusions and interpretation of model results concerning proxy data.
2. Methods
2.1. Data
Data from two different global circulation model (GCM) simulations, namely the Max Planck Institute Earth System Model (MPI-ESM, Jungclaus et al 2013, Stevens et al 2013) and the ECHAM6-FESOM model (Sidorenko et al 2015) developed at the Alfred-Wegener Institute (AWI; hereafter referred to as AWI-ESM), are used for the weather type classification (section 2.3). Additionally, these models provide initial and boundary conditions for regional climate simulations with the weather research and forecast model (WRF; Skamarock et al 2019). For each GCM, 6-hourly data exists for a 32 year period of LGM and pre-industrial (PI) climate conditions at a horizontal grid spacing of 1.85° (∼200 km). The PI runs serve as a reference to assess the model capabilities to characterise present day climate conditions. The LGM and PI simulations follow the Paleoclimate Modelling Inter-comparison Project (PMIP) protocols that specify the boundary conditions and model parameters being representative for the two different climatic periods (Braconnot et al 2012, Kageyama et al 2020).
For the weather type classification and comparison of the downscaled PI simulations with present day conditions, we use 40 years (1979–2018) of daily data from the European Centre for Medium‐Range Weather Forecast reanalysis ERA5 with a horizontal spatial resolution of 0.25° (∼31 km; Hersbach et al 2020). For the sake of comparison, the ERA5 and WRF data were bi-linearly interpolated to a common 0.45° (∼50 km) horizontal grid spacing.
2.2. Dynamical downscaling using the WRF model
The WRF model (version 4.1.2) is used to simulate the LGM climate over Europe and the Mediterranean area at 50 km horizontal grid spacing. The European Co-ordinated Downscaling Experiment domain is used (EURO-CORDEX; Jacob et al 2014) with ten additional grid points in each direction for relaxation. To account for LGM boundary conditions, several adjustments were made to the WRF model that has been successfully applied to study European climate during the LGM (Ludwig et al 2017, 2018, 2020, Pinto and Ludwig 2020, Schaffernicht et al 2020). The adjustments include changes to the greenhouse gas concentrations, implementing an orbital subroutine in the radiation module to account for the changes of the Earth's orbit around the Sun (Prömmel et al 2013), as well as adaptions of coastlines and ice sheets according to the PMIP3 protocol (figure 1; http://pmip3.lsce.ipsl.fr). Vegetation cover and land use types were adapted according to the Climate: Long-range Investigation, Mapping, and Prediction data set (CLIMAP Project Members 1984). An overview of the parameterisation schemes used in the WRF simulations is given in supplementary table S1 (available online at stacks.iop.org/ERL/17/014053/mmedia). Initial and boundary conditions from the global MPI-ESM (WRF-MPI) or AWI-ESM (WRF-AWI) simulations force the WRF model. For each GCM, 32 years were simulated for both LGM and PI climate conditions, with the first 2 years excluded from the analysis to account for model spin-up. A bootstrap test (Efron and Tibshirani 1993) is used for assessing the significance (1% significance level) of the differences between the LGM and PI hydro-climate variables and comparing precipitation and wind speed associated with Cyprus Lows. To compare the LGM and PI Cyprus Low characteristics, we extract those days that are classified as Cyprus Low days based on the weather type classification algorithm. Finally, domain average differences (in %) for annual and seasonal evaporation and precipitation, as well as precipitation and wind speed associated with Cyprus Lows are computed and displayed in the supplementary material (tables S2 and S3).
2.3. Weather type classification
The semi-objective synoptic classification algorithm (Alpert et al 2004) is used to identify five main weather types over the eastern Mediterranean: Persian Troughs, Highs, Sharav Lows, Red Sea Troughs, and Cyprus Lows. This classification characterises well the regional hydro-climate conditions over the Levant, particularly for Cyprus Lows, which are the focus of this study (Saaroni et al 2010, Dayan et al 2012, Hochman et al 2018). The classification is based on daily mean surface air temperature, sea-level-pressure, and 500 hPa geopotential height fields from the ERA5 reanalysis and two GCM simulations (MPI-ESM, AWI-ESM) over the eastern Mediterranean (27.5 °N–37.5 °N; 30 °E–40 °E; figure 2). The weather type approach assumes that the weather types did not entirely change in the LGM. To test this assumption, we have compared the average Euclidean distances for the different periods (see Alpert et al 2004 for the full classification procedure). We find that the average Euclidean distances in the LGM period with respect to the pre-industrial and ERA5 periods change by less than 1%. The Euclidian distance consistency supports in general terms that similar types were operating in the two periods, hence validating the approach used here. Nonetheless, it is still a topic that may be further investigated. The binomial test (von Collani and Dräger 2001) is used to compare the proportions of LGM and PI weather type frequencies at the 5% significance level.
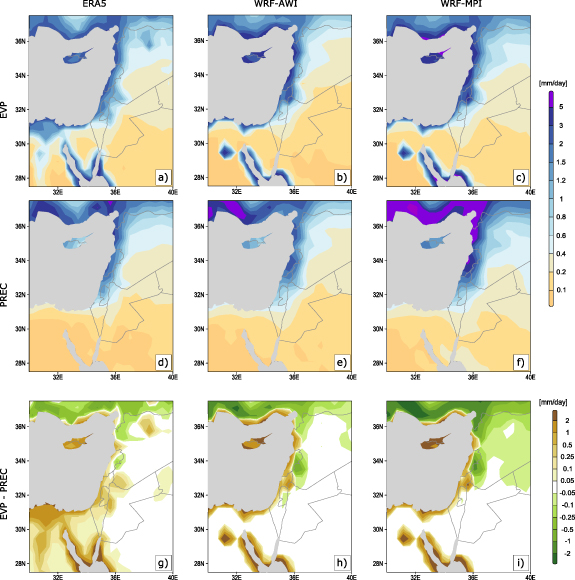
Figure 2. Spatial patterns of daily mean (a)–(c) evaporation (EVP), (d)–(f) precipitation (PREC) and (g)–(i) evaporation minus precipitation for ERA5 (1979–2018) and 30 years of pre-industrial simulations with WRF-AWI and WRF-MPI.
Download figure:
Standard image High-resolution image3. Results
3.1. Evaluation of WRF pre-industrial (PI) simulations
As we focus on the hydro-climate, the capabilities of the WRF-PI runs to simulate recent hydro-climate conditions in comparison with ERA5 are first examined (figure 2). Overall, spatial patterns for both evaporation (E; figures 2(a)–(c)) and precipitation (P; figures 2(d)–(f)) are largely reproduced by both WRF-AWI (figures 2(b) and (e)) and WRF-MPI (figures 2(c) and (f)). The simulations show a steep gradient of E and P from west to east and north to south, which is also indicated in ERA5 data (figures 2(a) and (d)). Though the simulated amounts of E and P slightly differ between both WRF-runs, the general structure of E–P is comparable to ERA5, showing positive water balance (P > E) in the northern parts of the region, and negative water balance at southern locations (figures 2(g)–(i)). Both WRF-PI runs show slight overestimations of evaporation and precipitation, especially over coastal nowadays Turkey and Lebanon (figures 2(a)–(f)). This may be related to the 'drizzle bias' effect, which is a common feature in regional climate models (Maraun 2016). However, one has to also keep in mind, that the PI runs are forced with much lower CO2 concentrations than present-day conditions (Giorgetta et al 2013), thus, the drier conditions in ERA5 might already be attributed to current climate change (Samuels et al 2017, Hochman et al 2020c). The WRF simulations show overall satisfactory results in simulating the hydro-climate key variables and are therefore used to estimate the mean hydro-climate changes during the LGM.
3.2. Hydro-climate during the LGM
The simulated hydro-climate during the LGM shows some significant deviations compared to PI. Both WRF-AWI and WRF-MPI show a significant decrease in evaporation over large parts of the study area during the LGM (figure 3). The overall evaporation decrease over the study area is −36.4% in WRF-MPI and −29.9% in WRF-AWI. This decrease is similar when considering annual (figures 3(a) and (b)), winter (DJF; figures 3(c) and (d)), and summer (JJA; figures 3(e) and (f)). The strongest annual decrease is simulated along the Mediterranean coast, reaching up to −5 mm d−1 (∼–70%) in the north-eastern part of the Levant. Differences around the Gulf of Suez occur because this area was dry during the LGM (Bailey et al 2007). Seasonally, WRF-AWI simulates a slightly higher reduction during summer (−43%) compared to winter (−36%) over the study area (figures 3(c) and (e)). For WRF-MPI, the differences in evaporation over the region are −32% for summer and −34% for winter (figures 3(d) and (f)). In addition, a slight increase in evaporation during summer is simulated over the southern Negev Desert and the Jordanian highlands (figures 3(d) and (f)).

Figure 3. Simulated daily mean evaporation differences (LGM-PI) for WRF-AWI ((a), (c), (e)), and WRF-MPI ((b), (d), (f)). Annual (a) and (b), winter (DJF; (c) and (d)), summer (JJA; (e) and (f)). Grid points with statistically significant differences at the 1% level are marked by black crosses.
Download figure:
Standard image High-resolution imageWhile the patterns of evaporation differences between LGM and PI are similar for WRF-AWI and WRF-MPI, the precipitation patterns show some variation, particularly for summer. On annual basis, the simulated precipitation is reduced in both simulations during the LGM (figures 4(a) and (b)). The reduction is limited to the north/north-eastern parts of the study area, and along the southern Mediterranean coastline. While the study area experiences a decrease in precipitation of −21.9% for WRF-AWI, the reduction is slightly lower in WRF-MPI (−17.3%). The strongest reduction in precipitation (−50%) is simulated along the north-western parts of the Mediterranean coast in both WRF simulations. For winter (figures 4(c) and (d)), the patterns of WRF-AWI and WRF-MPI show minor differences in the south-eastern parts. While WRF-AWI simulates a general reduction of the winter precipitation, with only small additional precipitation in the Jordanian highlands and Lebanon Mountains, the WRF-MPI shows increased precipitation in the southern and south-eastern parts (figure 4(d); see section 4 for discussion). However, the mean winter precipitation changes over the study area are relatively similar in WRF-AWI (−23.7%) and WRF-MPI (−19.3%). For summer, the signal between the two simulations is different: while WRF-AWI simulates 62.1% less precipitation during the LGM compared to PI, the area-wide precipitation difference in WRF-MPI is just −2.2% compared to PI. The strong reduction in summer precipitation in WRF-AWI is mostly limited to the northern parts of the study area. For most of the locations, there is almost zero precipitation during nowadays summer, which is adequately represented by the models (not shown). A summary of annual and seasonal evaporation and precipitation differences over the study area is given in table S2.
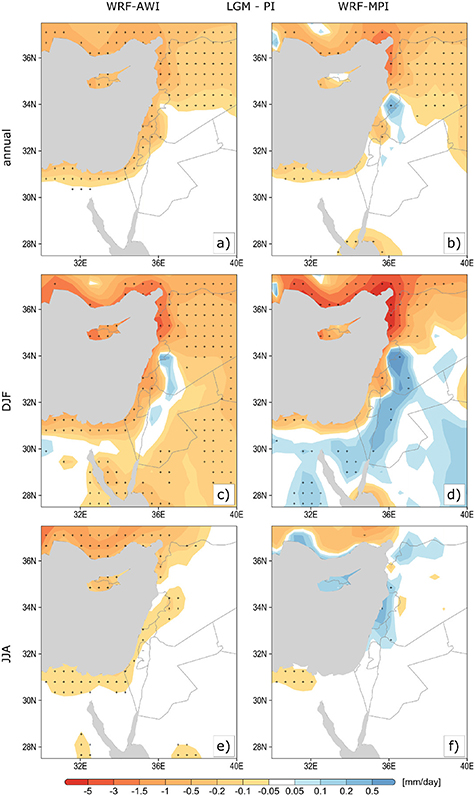
Figure 4. Same as figure 3 but for precipitation differences.
Download figure:
Standard image High-resolution imageFinally, we consider the E–P changes over the region (figure 5). Here, negative numbers represent a more positive water balance during the LGM compared to PI. On annual average, wide parts of the Levant experienced enhanced water availability during the LGM in both simulations (figures 5(a) and (b)). Significant changes in the water balance are simulated by both WRF-AWI and WRF-MPI in the northern parts of nowadays Israel, Lebanon and Syria. A closer look at the seasonal patterns reveals that changes in the water balance in summer are of particular importance (figures 5(c)–(f)). Here, a strong increase in water availability is visible in both simulations, which is mostly due to the significant decrease in evaporation (figures 3(e) and (f)). For winter, changes in the water balance are less pronounced (figures 5(c) and (d)). However, due to the strong decrease in precipitation, exceeding the rate of decrease in evaporation, the northern and north-eastern parts of the study domain experienced a drier hydro-climate during winter for LGM conditions (figures 5(c) and (d)).

Figure 5. Same as figure 3 but for evaporation–precipitation differences.
Download figure:
Standard image High-resolution image3.3. Cyprus Low characteristics during the LGM
First, we discuss the ability of the PI simulations to represent the relative occurrence of the eastern Mediterranean weather types (figure 6). Overall, both models (MPI-ESM and AWI-ESM) are able to reproduce the ERA5 weather type frequencies (figure 6). Certainly, the AWI-ESM simulation reproduces the ERA5 weather type frequencies remarkably well (figures 6(a) and (c)). Small overestimations for the PI period are found for Cyprus Lows in AWI-ESM (∼17%) as compared to ERA5 (figures 6(a) and (c)). On the other hand, the MPI-ESM shows comparatively larger overestimations (annual ∼33% and winter ∼50%; figures 6(b) and (d)). Again, it should be noted that the PI simulations driven by lower CO2 concentrations are prone to display such deviations, due to the strong effect that greenhouse gas concentrations may have on the occurrence of Cyprus Lows (Hochman et al 2018).
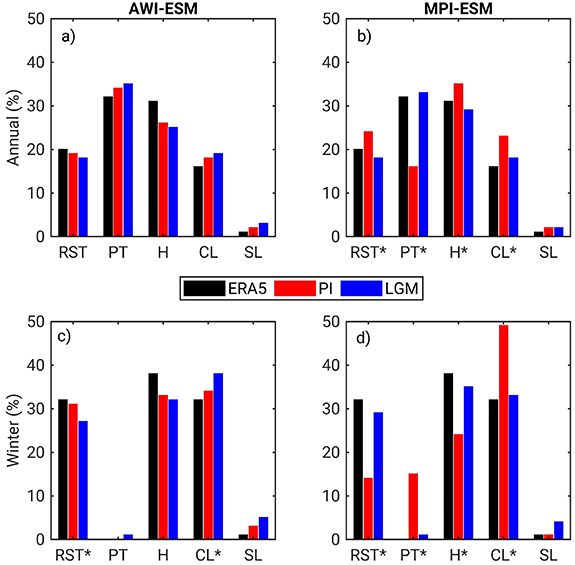
Figure 6. Weather type frequencies (%) over the eastern Mediterranean as simulated by AWI-ESM ((a), (c)) and MPI-ESM ((b), (d)). Annual ((a), (b)) and winter-DJF ((c), (d)). The weather types are Red Sea Trough (RST), Persian Trough (PT), Highs (H), Cyprus Lows (CL) and Sharav Lows (SL). An asterix (*) denotes significant differences using a binomial test at the 5% level between pre-industrial (PI in red) and LGM (in blue) periods. The ERA5 weather type frequencies are displayed in black.
Download figure:
Standard image High-resolution imageNext, we focus on the occurrence of Cyprus Lows during the LGM. The analysed models suggest two different frequency pathways in comparison to the PI period (figure 6). The AWI-ESM displays enhanced frequencies of Cyprus Lows during the LGM that is significant in winter (+22%, figure 6(c)). On the other hand, the MPI-ESM displays lower annual (about −20%) and winter (about −33%) Cyprus Low occurrences, both significant at the 5% level (figures 6(b) and (d)). Even though both models do not agree on the sign of changes in Cyprus Low occurrence, a significant increase in Cyprus Low frequency during the LGM is more likely due to the noteworthy ability of AWI-ESM to depict the general occurrences of all eastern Mediterranean weather types during the PI period (cf figures 6(a) and (c) with figures 6(b) and (d); see Palmer 1999 for a discussion on the importance of adequately simulating weather type frequencies).
The characteristics, including daily mean and extreme (90th percentile) precipitation and wind speed, of LGM Cyprus Lows are compared to their PI counterparts based on the WRF-AWI and WRF-MPI simulations (figures 7 and 8). Overall, both WRF simulations agree on significantly less (stronger) precipitation (wind speed) during the LGM as compared to the PI period (figures 7 and 8, −27% (+7%) on average). In fact, slightly stronger decreases (increases) in precipitation (wind speed) are simulated in their extreme values (figures 7(c), (d) and 8(c), (d), −29% (+8%) on average). For precipitation, the strongest decrease (between −50% in WRF-AWI to −70% in WRF-MPI) is located at north-eastern coastal locations in nowadays Turkey and Lebanon (figures 7(c) and (d)). Besides overall higher LGM wind speeds at these locations, a strong increase in wind speed (+21% in WRF-AWI and +28% in WRF-MPI) is also simulated in the Nile Delta of nowadays Egypt (figures 8(c) and (d)). A summary of the domain averaged wind speed and precipitation differences for Cyprus Low days is given in table S3.
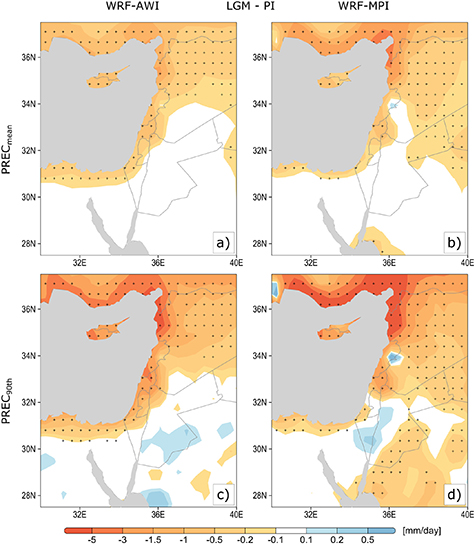
Figure 7. Simulated precipitation differences (LGM-PI) for all days classified as a Cyprus Low for WRF-AWI ((a), (c)) and WRF-MPI ((b), (d)). Daily precipitation means ((a) and (b)). The 90th percentile of daily precipitation ((c) and (d)). Grid points with statistically significant differences at the 1% significance level are marked by black crosses.
Download figure:
Standard image High-resolution image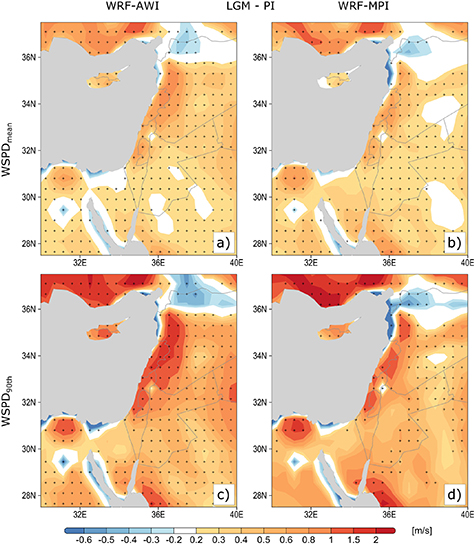
Figure 8. Same as figure 7 but for wind speed differences at 10 m height.
Download figure:
Standard image High-resolution image
4. Discussion and conclusions
Past hydro-climate fluctuations in the Levant, located on a steep climatic gradient (Kushnir et al 2017) attract continued interest, since this region is considered as a main trajectory for the dispersal of humans out of Africa (Mellars 2011, Hershkovitz et al 2018). Although a large variety of proxy data is available for the LGM, discussions are ongoing regarding the prevailing hydro-climate conditions during this period. Here, we complement the proxy records discussion by two regional climate simulations with the WRF model that were forced by two different GCMs. In this study, we focus specifically on the hydro-climatic variations and their relation to the frequency and intensity of Cyprus Lows. It should be noted here that no natural proxy data exist that resolve Cyprus Low dynamics, frequency and intensity. Thus, a direct comparison is not possible.
Our regional model simulations agree in the sense that both evaporation (−33%) and precipitation (−20%) during the LGM were in fact reduced compared to the PI period. This is in good agreement with Bar-Matthews et al (1997) and Langgut et al (2021), who estimated a reduction of ∼20% in precipitation during the LGM with respect to present-day climate, based on speleothem growth and Pollen records, respectively. However, the relative deviations between evaporation and precipitation elucidate the wetter conditions, in agreement with Vaks et al (2003), who used speleothem data in the Levant, and D'Agostino and Lionello (2020), who used an ensemble of six PMIP3 models over the entire Mediterranean region. The reduced evaporation can be related to overall lower annual mean temperatures during the LGM compared to PI (figure S1; −3.6 °C for WRF-AWI; −4.6 °C for WRF-MPI). The simulated temperature differences are in excellent agreement with proxy-based temperatures, e.g. from Lake Hula (nowadays Israel), where the reconstructed annual mean temperature was estimated to be −4 °C lower than today (Langgut et al 2021). Indeed, less evaporation throughout the year and particularly during LGM summer may have sustained high lake levels (Bartov et al 2002, Torfstein et al 2013), forests at northerly locations (Cheng et al 2015), and speleothem formation at regions where they do not grow at present (Vaks et al 2003, 2006). A recent study reconstructed a higher proportion of Irano-Turanian steppe and Mediterranean woodland over the Levant during the LGM (Miebach et al 2019). These authors provide strong evidence that no precipitation increase was required to simulate sufficient amounts of effective moisture for such vegetation proportions.
Besides the hydro-climatic variables, we focus on Cyprus Low characteristics during the LGM. Our regional climate model simulations agree on lesser (stronger) daily precipitation (wind speed), in both the mean and extreme values (90th percentile) of these variables. The changes in the precipitation yield of Cyprus Lows may explain the overall decrease in LGM precipitation in annual mean and particularly during winter. Indeed, Cyprus Low precipitation yield may have decreased in the LGM due to the Clausius–Clapeyron relationship, in which every degree of temperature decrease changes the water holding capacity of the air by −7%, with colder air being able to carry less moisture. Though our WRF simulations agree in reduced Cyprus Low precipitation amounts, two different pathways are analysed for their occurrence frequencies during the LGM. An increase of the LGM Cyprus Low frequency is given by AWI-ESM and a decrease in MPI-ESM compared to the PI time. However, the generally good representation of the Cyprus Low frequency, and also the other eastern Mediterranean weather types during pre-industrial time in the AWI-ESM model, hints that a significantly larger number of Cyprus Low days may have occurred during the LGM (+22% in winter).
The enhanced Cyprus Low wind speeds, particularly in the Delta of the Nile River and the Sinai Peninsula, might have implications for the regional LGM dust cycle. The stronger winds favoured the transport of abundant dust particles (fine grains <20 µm, silt and fine sand) to the east, leading to enhanced deposition in the northern Negev Desert of nowadays Israel (Goring-Morris and Goldberg 1990). Indeed, dust transport from relatively close sources is accountable for ∼50% of the Negev Loess soils (Yaalon and Ganor 1973). In addition, the orientation of the thick Loess zone in the northern Negev hints at a western source for most of the dust (Dan et al 1976, Singer 2007), which Cyprus Lows with stronger wind speeds may account for (Dayan et al 2007). Indeed, Dayan et al (2007) have shown that 2/3 of the total yearly dust yield in the Northern Negev is linked to Cyprus Low systems. An increased number of Cyprus Lows producing stronger wind speeds is also in agreement with the LGM being considered as an era with maximum sand dune migration into the western Negev (Goring-Morris and Goldberg 1990, Magaritz and Enzel 1990).
The simulated increase in precipitation amounts in the southern and eastern parts of the Levant during the LGM (WRF-MPI; figure 4(d)) cannot be explained by changes in the Cyprus Low frequency and intensity alone (cf figure 4(d) with figures 7(b) and (d)). Indeed, an increase of the Red Sea Trough occurrence during the LGM winter (MPI-ESM; figure 6(d)), should also be considered in the discussion, even if the MPI-ESM weather type frequencies are considered less reliable (see section 3.1). In the present-day climate, the active Red Sea Trough produces most of its precipitation in southerly and easterly locations of the Levant (Tsvieli and Zangvil 2005, de Vries et al 2013). Indeed, recent studies provide evidence for increased flood frequencies in the Dead-Sea region during the LGM using varved sediments (Ben Dor et al 2018). Our simulations (particularly WRF-MPI), in combination with the weather type approach, provide evidence that the active Red Sea Trough may have been an important system for the generation of such flood events during winter. However, a full analysis for this type of system requires additional focused consideration, which is out of the scope of the current study.
In addition, the hydro-climate conditions in the Levant may also be controlled by low frequency large scale processes (Xoplaki et al 2004, 2018, Ulbrich et al 2013), such as changes in the phase of the North Atlantic Oscillation (Eshel and Farrel 2000), East-Atlantic Western-Russia pattern (Krichak and Alpert 2005) and sea-surface temperatures in the Mediterranean or/and Atlantic Ocean (Kwiecien et al 2009). All of these features were found to influence the cyclonic activity in the Mediterranean, and consequently also the precipitation variability over the Levant. In this study, we did not analyse the changes in such teleconnection patterns during the LGM in model simulations, but this may be an exciting avenue to pursue in future research.
As a caveat, we note that our analysis does not account for sub-hourly precipitation intensities, which may be an important factor for the generation of flash floods in the Dead-Sea region (Dayan and Morin 2006). However, envisaged WRF simulations with higher spatial and temporal resolution would enable such an analysis in the future. A higher spatial resolution would also allow for a more detailed topography and the consideration of paleo lake level fluctuations (e.g. Lake Lisan, Bartov et al 2002). This would provide additional insights into the LGM climate in the Levant including paleo vegetation and human mobility. Moreover, our interpretation depends on two regional climate simulations. To fully characterise the uncertainty of LGM hydro-climate, a large ensemble of regional climate simulations at high-resolution is foreseen. Finally, our results may be sensitive to the weather type classification procedure used. However, in this study we focus on the ability of our simulations to reproduce the main characteristics of cyclones in the eastern Mediterranean, rather than on the sensitivity of cyclone climatology to the different classification methods.
This study places the projected warming and drying of the Levant (e.g. Samuels et al 2017, Hochman et al 2020c) in a long timescale perspective. Indeed, the location of the Levant on a steep climatic gradient from north to south and from west to east poses substantial challenges where even slight deviations from the mean state may inflict dramatic hydro-climatic shifts in the region (Kushnir et al 2017).
Acknowledgments
This paper is a contribution to: (a) The Hydrological cycle in the Mediterranean Experiment community (HyMeX, www.hymex.org/). (b) The COST MEDCYCLONES: European Network for Mediterranean Cyclones in weather and climate (www.cost.eu/actions/CA19109/#tabs|Name:overview). (c) The cooperation in the international virtual institute Dead Sea Research Venue (DESERVE; www.deserve-vi.net/). (d) the PALEOLINK project (http://pastglobalchanges.org/science/wg/2k-network/projects/paleolink/intro) within the PAGES 2k Network. We thank G Lohmann and X Shi (both from AWI, Bremerhaven) for providing access to AWI-ESM data. We thank the German Climate Computing Centre (DKRZ, Hamburg) for providing computing resources within DKRZ project 965. AH and PL thank Joaquim G Pinto (KIT, Karlsruhe) for valuable discussions. AH thanks the Hebrew University of Jerusalem for providing technical support.
Data availability statements
The results and conclusions drawn in this study are based on the 5th generation of the European Centre for Medium-range Weather Forecasting (ECMWF) ERA5 reanalysis dataset (www.ecmwf.int/en/forecasts/datasets/reanalysis-datasets/era5), the PMIP3 MPI-ESM data (Jungclaus et al 2012a, https://doi.org/10.1594/WDCC/CMIP5.MXEPlg), Jungclaus et al 2012b (https://doi.org/10.1594/WDCC/CMIP5.MXEPpc) and the PMIP4 AWI-ESM data (https://doi.org/10.22033/ESGF/CMIP6.9302).
Funding
The German Helmholtz Association 'Changing Earth' program funds both authors. The Helmholtz Climate Initiative REKLIM supports PL (regional climate change; www.reklim.de/en).
Author contributions
Conceptualization: A H, P L
Methodology: P L, A H
Investigation: A H, P L
Writing—original draft: A H, P L
Writing—review and editing: A H, P L
Conflict of interest
The authors declare no conflict of interest.