

Abstract
The year 2020 had the most catastrophic fire season over the last two decades in the Pantanal, which led to outstanding environmental impacts. Indeed, much of the Pantanal has been affected by severe dry conditions since 2019, with evidence of the 2020's drought being the most extreme and widespread ever recorded in the last 70 years. Although it is unquestionable that this mega-drought contributed significantly to the increase of fire risk, so far, the 2020's fire season has been analyzed at the univariate level of a single climate event, not considering the co-occurrence of extreme and persistent temperatures with soil dryness conditions. Here, we show that similarly to other areas of the globe, the influence of land-atmosphere feedbacks contributed decisively to the simultaneous occurrence of dry and hot spells (HPs), exacerbating fire risk. The ideal synoptic conditions for strong atmospheric heating and large evaporation rates were present, in particular during the HPs, when the maximum temperature was, on average, 6 °C above the normal. The short span of the period during those compound drought-heatwave (CDHW) events accounted for 55% of the burned area of 2020. The vulnerability in the northern forested areas was higher than in the other areas, revealing a synergistic effect between fuel availability and weather-hydrological conditions. Accordingly, where fuel is not a limiting factor, fire activity tends to be more modelled by CDHW events. Our work advances beyond an isolated event-level basis towards a compound and cascading natural hazards approach, simultaneously estimating the contribution of drought and heatwaves to fuelling extreme fire outbreaks in the Pantanal such as those in 2020. Thus, these findings are relevant within a broader context, as the driving mechanisms apply across other ecosystems, implying higher flammability conditions and further efforts for monitoring and predicting such extreme events.
Export citation and abstract BibTeX RIS

Original content from this work may be used under the terms of the Creative Commons Attribution 4.0 license. Any further distribution of this work must maintain attribution to the author(s) and the title of the work, journal citation and DOI.
1. Introduction
In 2020, the world witnessed one-quarter of the Brazilian Pantanal, the largest continuous tropical wetland, on fire [1, 2]. More than 3.9 million hectares were burned, an area four times larger than the long-term average observed between 2001 and 2019 [3, 4]. The Pantanal 2020 fire (hereafter P20F) season may have directly affected 17 million native vertebrates [5] and resulted in total national economic losses of ∼USD 3.6 billion [6].
These extremely intense impacts inevitably raise the doubt: why was the P20F so exceptional? Evidence is mounting that the P20F resulted from a complex interplay of distinct contributing components, including human factors, landscape characteristics, and adverse meteorological conditions [2, 7]. Globally, the year 2020 tied with 2016 for the warmest year on record since record-keeping began in 1880 [8], with several record-breaking temperature (compounded) events taking place in different regions. The 2019/2020 mega-fires in Australia were tightly linked to record-breaking temperatures, both induced to a large extent, by widespread prolonged severe dryness [9–11]. The 2020's catastrophic fires in California were enabled by long-lasting dry conditions across much of western U.S [12]. Among the 2020´s unprecedented climate conditions favoring fire activity in Oceania, Euro-Asia and North America, South America (SA) was not an exception [13]. Extreme dry conditions were reported in countries across central-south SA, reaching Argentina, Brazil, Bolivia and Paraguay [14–16]. Much of SA has been in drought since 2019, influenced by a warming trend in the sea surface temperature of Pacific and Atlantic Oceans [14–17].
The extremely dry conditions across central-south SA were accompanied by heatwave (HW) episodes throughout the austral spring which triggered record-breaking daily maximum temperatures [18]. In Brazil, between the end of September and early November, when anomalies were persistently above 5 °C in the central and southeastern regions, including the Pantanal [18, 19], several warnings of the HWs' risk were issued.
Previous studies suggest that the P20Fs were strongly influenced by the most extreme drought recorded in the region since 1950 [2, 7, 18] which was accompanied by the occurrence of several prolonged periods of extremely high temperatures. Compound drought-HW (CDHW) events usually cause more severe wildfires than single events of drought or HW alone [20] and are being routinely reported worldwide [21–26], including in Brazil [27]. Although understanding the factors that influence the regional occurrence of a CDHW event is imperative, so far, its characterization and association with fire outbreaks have not been fully explored in wetlands such as the Pantanal. Thus, this study aims to assess, for the first time, the severe CDHW conditions and the land-atmosphere feedbacks associated with the P20Fs. A detailed analysis of the exceptional P20F season is provided together with the spatial and temporal analysis of surface conditions and the associated synoptic patterns. The present approach provides a more comprehensive understanding of the physical land-atmosphere coupling mechanisms associated with this extreme climate event, highlighting its dominant role in the observed record-breaking fires.
2. Data and methods
2.1. Datasets
Burned area (BA) was obtained from two main sources. Monthly values were obtained from the MCD64A1 collection 6 derived from the MODIS (moderate resolution imaging spectroradiometer) sensor at 500 m spatial resolution from 2001 to 2020 [28]. For improved accuracy on day-to-day variability of BA [29], daily values for 2020 were obtained through the ALARMES dataset with a 500 m spatial resolution using images from the visible infrared imaging suite imager sensor [29].
Meteorological parameters, including maximum temperature (Tmax), precipitation, surface net solar radiation, geopotential height and temperature at several levels of the atmosphere were extracted, at daily scale, from the European Centre of Medium-range Weather Forecast ERA-5 reanalysis dataset [30]. Soil moisture, evaporation and potential evaporation, at daily scale, were obtained from the Global Land Evaporation Amsterdam Model (GLEAM v3.5a) [31, 32]. All variables were retrieved at a gridded 0.25° × 0.25° spatial resolution and the composite anomalies were computed with respect to the climatological seasonal cycle (1981–2010).
Surface meteorological fire danger conditions were evaluated using the fire weather index (FWI) [33], allowing summarizing the chances of a fire to ignite and propagate and to foresee hazardous fire conditions [34]. The FWI product is provided by the Copernicus Emergency Management Service [35], computed with meteorological fields from the ERA5 reanalysis [36]. Daily values were obtained for the historical period (1980–2020) on a regular grid of 0.25° × 0.25° resolution [37]. All analyses were carried out for the Brazilian sector of the Pantanal wetland.
2.2. Methodology
2.2.1. Fire analysis
To assess the exceptionality of the P20Fs we considered the ratio between the total BA in 2020 and the respective mean BA for the 2001–2019 period. We also estimated the fire return period, defined as the ratio between the 20 years that encompass our study period (2001–2020) and the annual recurrence. Finally, we computed the 75th percentile (P75) of the 2001–2019 period and the percentage of the 2020 BA with no fire and low recurrence (1–2 years). The above-mentioned metrics were computed for each of the nine hydrological subregions of Pantanal [38], to evaluate regional discrepancies within the biome (figure 1(a)).
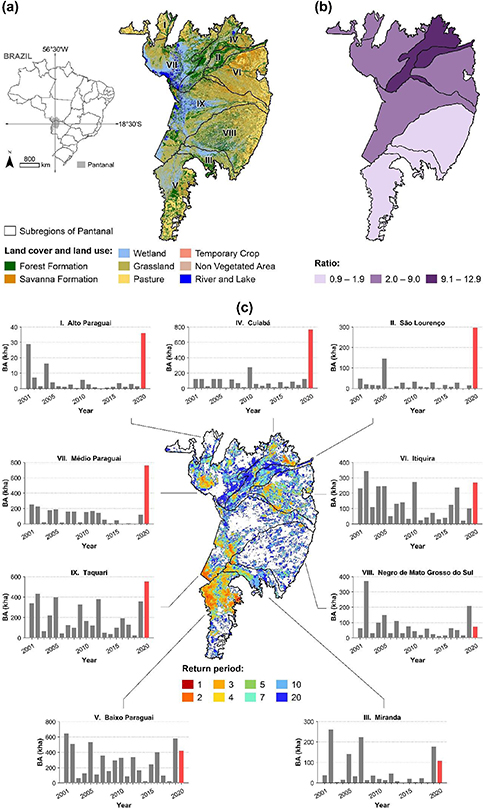
Figure 1. (a) Location of Pantanal within Brazil (left) and the nine hydrological subregions with land cover and land use information from the MapBiomas Collection 5 [61, 62] (right). (b) Subregional ratio between the area burned in 2020 and the mean annual BA (2001–2019), colors represent: light purple for values  percentile 25, purple for value between percentiles 25 and 75 (included), and dark purple for values >percentile 75; (c) Return period (central map) and annual variability of BA in each subregion (2001–2020) (associated plots). Each subregion is labelled according to table S1, and values estimated using the MCD64A1 product.
Download figure:
Standard image High-resolution image2.2.2. Heat wave identification
HW was defined as a period of three or more consecutive days with daily Tmax values above predefined climatological (1981–2010 base period) percentiles (80th, 90th and 95th) of Tmax for each calendar day (on a 15 day moving window). Based on this definition, a secondary metric was computed: the percentage of the Pantanal domain under HW conditions ( ). This method was already used in previous studies conducted for the USA [39] and Brazil [27] and consists of determining the yearly percentage of the total Pantanal cells (
 ) that experienced HW conditions:
Per year, the number of total cells ( ) is obtained by considering the total number of grid-points within the region (
 ) and the hypothetical total number of days that could experience HW conditions (
 ):
):

In our particular case, the  corresponds to the total number of days of the fire season in the Pantanal (July to October [3]). For instance, for a particular year, a percentage of 100% indicates that all the Pantanal experienced HW conditions during all the fire season days.
2.2.3. Drought conditions
Drought conditions were assessed by analyzing soil moisture anomaly composites and monthly standardized precipitation index (SPI) values [40] from 1980 to 2020, using a 6 month accumulation timescale (SPI-6) and precipitation from ERA5 reanalysis as input data. SPI is widely used to characterize drought conditions using a purely meteorological perspective: it indicates the number of standard deviations by which the observed precipitation anomaly deviates from the long-term mean in a particular location. To better assess the long-term tendencies (quantified by applying a 1st-degree polynomial regression) and interannual variability, we further analyze the temporal evolution of key average meteorological parameters over the fire seasons between 1980 and 2020.
2.2.4. Relating fires with the heatwave/drought conditions
We first identified the temporal evolution of each hazard (fire, HW and drought) at the daily scale for the entire Pantanal allowing the identification of concurrent behaviour, i.e. co-occurrence of two or even three of these hazards. Since the Brazilian Pantanal is quite large, we also analyzed the co-occurrence of the multiple hazards for each one of the nine hydrological subregions. During the fire season, we calculated, at the subregional level, the percentage of the BA during the identified hot periods (HPs), defined here as consecutive HWs separated by days with a short heat-stress relief and under drought conditions.
3. Results
3.1. The 2020 fire season in perspective
The P20Fs show an increase in BA for almost all subregions ranging from ∼60% to 1190% of the historical mean value (figure 1(b)). Higher ratios are found in the northern subregions, namely São Lourenço (II) and Cuiabá (IV), which burned ∼65% and 55% of their area in 2020 (table S1 available online at stacks.iop.org/ERL/17/015005/mmedia), respectively. These values were absolute outliers within the historical series (figure 1(c)), as so far these subregions had burned a yearly average of ∼5.1% and 5.8% (table S1), respectively. In the P20Fs only one subregion burned less than its annual average over the 2001–2019 period: Negro de Mato Grosso do Sul (VIII); which, along with Miranda (III) and Baixo Paraguai (V), obtained the lowest ratios to historical mean values (figure 1(b)). Historically, the northern regions are characterized by lower return periods, whereas the southern regions burn more regularly (figure 1(c)). However, this historical tendency was reversed in 2020, when most of the BA was in forested areas of northern Pantanal. Conversely, southern and south-eastern subregions, characterized by large extents of pasture and grasslands (figure 1(a)), burned considerably in 2020 but did not reach record levels. Nevertheless, with the exception of Negro de Mato Grosso do Sul (VIII), the BA from the P20Fs went above P75 of the historical time series for all southern subregions (table S1).
Most subregions in the Pantanal burn within a 4 month period from July to October (figure S1) and, in this regard, 2020 kept as expected: a steady BA increase from July to September is seen in Pantanal, with a peak on 12 September (116 605 ha) and a secondary observed on 27 September (95 478 ha; figure S1). Médio Paraguai (VII) and Taquari (IX) showed the earliest signs of burning in July, while the remaining subregions burned over August to October, and solely Baixo Paraguai (V) and Médio Paraguai (VII) showed considerable BA in the earlier weeks of November. The latter subregion burned consistently over a period of 5 months, severely contrasting with its historical series where BAs mainly occur in September and October. It is also worth noting how Médio Paraguai (VII) burned very little in previous years (2016–2018; figure 1(c)).
Around a third of the BAs in the P20Fs had been undisturbed since 2001, and another 31% burned only once or twice over the entire study period (table S1). Of the entire P20Fs, 64% of BAs were areas not accustomed to regular and systematic burning. Noteworthy are the cases of Cuiabá (IV) and Médio Paraguai (VII) with ∼18% and 19%, respectively, of areas that had not or barely burned within the last 19 years.
3.2. Compound drought and heatwaves
Results show unprecedented extreme heat conditions, with Tmax anomalies for the last two fire seasons over the Pantanal (2019 and 2020) positioned in the high-end tail of the empirical distribution of average Tmax anomalies (figure 2(a)). By contrast, the years 1992, 1990, 1984 are in the low-end tail, as in general, the years within the first half of the analysis period. The time series of Tmax (figure 2(b)) is characterized by a pronounced and statistically significant positive trend of 0.76 °C per decade, responsible for warming throughout the last four decades of ∼3 °C. Accordingly, the spatially averaged Tmax level during the P20F season was 34 °C, roughly 4 °C higher than the average for the first decade in the 1980s. The percentage of the Pantanal under HW conditions (figure 2(c)) followed, closely, the Tmax evolution (figure 2(b)). Because of this sharp warming trend, the spatial and temporal signature of HWs had marked increase, with unprecedented extreme heat conditions in 2020 as well. Analyzing the monthly SPI-6 values from 1980 and 2020 (figure 2(d)), one concludes that during the 21st century most of the fire seasons were preceded by the occurrence of precipitation deficits. As previously described, this period also marks a sharp increase in the Pantanal under HW conditions (figure 2(b)), indicating that after the turn of the century the CDHW conditions became more frequent, in particular for 2020. Accordingly, 2020 was also marked by record fire danger (figure 2(e)): fire season averaged FWI reached values above 30 for the second year in a row. Previously, 2010 held the highest value, consistent with widespread drought conditions in neighboring biomes [41, 42]. Higher fire danger values over the last two decades strongly contrast with those of the 20th century, with a significant positive trend over the last 40 years.
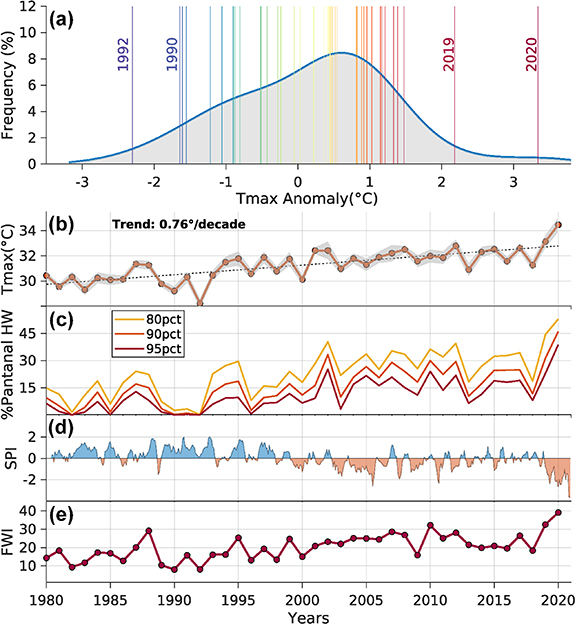
Figure 2. (a) The grey shading shows the fit of a Kernel distribution function for the averaged Tmax anomaly values over the Pantanal (fire seasons between 1980 and 2020). Vertical colored lines indicate mean Tmax anomaly values during the fire seasons for specific years. (b) Temporal evolution from 1980 to 2020 of the Tmax average values for the Pantanal and during the fire season (orange line). The grey shading shows the Tmax variability by highlighting the area delimited by  . (c) Temporal evolution from 1980 to 2020 of the percentage of Pantanal in HW conditions: %
  . (d) Temporal evolution from 1980 to 2020 of the SPI-6 and (e) fire season averaged FWI average values for the Pantanal.
Download figure:
Standard image High-resolution imageIn general, 2020 was marked by the occurrence of numerous HW episodes over the Pantanal when the daily area-averaged Tmax values were considerably above the expected levels for several periods of three or more consecutive days (figures 3(a) and S2). Thus, several HPs were also observed, particularly during the fire season. The first HP occurred from 26 August to 1 September, the second from 5 to 20 September and the third from 25 September to 15 October (red boxes in figure 3(a)).
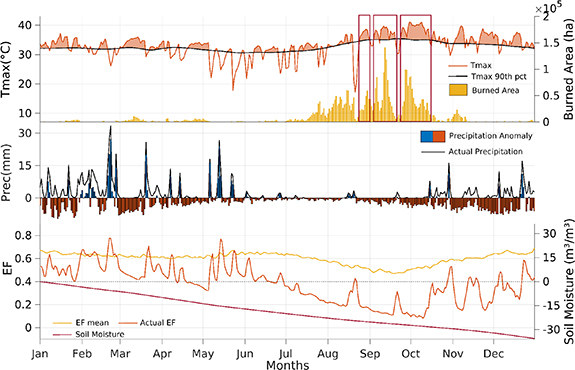
Figure 3. (a) Time series from January to December 2020 of daily area-averaged Tmax values for the Pantanal (orange line) and the respective calendar day climatological (1981–2010 base period) 90th percentile (black line). Yellow bars indicate the daily total BA recorded (using the ALARMES product). (b) Time series of daily area-averaged precipitation levels (black line) and the respective anomalies (bars) regarding climatology (1981–2010 base period). (c) Time series of the observed and expected daily area-averaged evaporative fraction values (orange and yellow line, respectively). The red line indicates the daily accumulated area-averaged soil moisture anomaly values during 2020. HPs are highlighted in red rectangles in panel (a).
Download figure:
Standard image High-resolution imageThroughout 2020, a temporal match between the occurrence of HPs and increasing values of BA (figures 3(a) and S2) was observed. However, it was during the austral winter and the three considered HPs that this temporal correspondence was more pronounced, indicating a close relationship between the induced atmospheric heat-stress conditions and the occurrence of fires. On average, the Tmax value for the three HPs was 38.5 °C, representing a staggering temperature anomaly of about 5.8 °C. In fact, on 1 October (the 6th day of the third HP) the mean Tmax value reached 41 °C, establishing a new record-breaking level for the region. A very similar value was observed nine days later on 10 October, defining this as a period of outstanding extreme heat stress conditions. During this HP of 21 d, the Tmax values were on average 6.5 °C higher than the expected mean levels and a total of 983 900 ha burned, a value that accounts for 25% of the total BA recorded during 2020 in Pantanal. The BA recorded over the entire Pantanal during these three massive HPs accounted for 55% (60%) of the total 2020 (fire season) BA. In all subregions, with the exception of Baixo Paraguai, the BA observed during the three HPs accounted for more than 50% of the amount from the fire season. Moreover, in six of the nine subregions, this BA amount corresponds to more than two-thirds of the fire season, reaching 95% in Miranda (figure S2).
The months preceding the 2020 fire season were marked by large deficits in precipitation (figure 2(d)), within the drought period. During the P20F season, precipitation levels were lower than expected, reaching zero or near-zero values for most of the days (figure 3(b)). Thus, the drought pattern and soil desiccation that initiated during the first months due to a drier wet season substantially amplified throughout the following months, leading to extreme negative anomalies of accumulated soil moisture (figure 3(c)). These precipitation deficits combined with clear sky conditions that were linked to large amounts of incoming shortwave radiative energy at the surface and enhanced diabatic processes (figure 3(a)), induced large evaporation rates from the surface to satisfy the high atmospheric demand for water. This combined process was crucial for the establishment of the pronounced soil moisture deficits and evaporative stress observed during the P20F season.
Concurring warm and dry conditions controlled the partitioning of water and energy fluxes at the surface. The evaporative fraction observed during 2020 followed very closely the precipitation and temperature regimes (figures 3(c) and S2). Several periods marked by a sharp decrease in the evaporative fraction values were clearly paired with dry episodes combined with extremely hot conditions. Thus, negative anomalies of the evaporative fraction were a constant presence during 2020 (figures 3(c) and S2). However, it was during the fire season that the values reached their minima indicating the presence of a strong soil moisture-temperature coupling regime (water-limited) in which disproportional surface losses in the incoming shortwave radiation through upward sensible heat flux allowed a re-amplification of the near-surface (air) temperatures. The atmospheric cooling through latent heat flux was then suppressed as well as the capacity of the surface to mitigate the low atmospheric humidity levels.
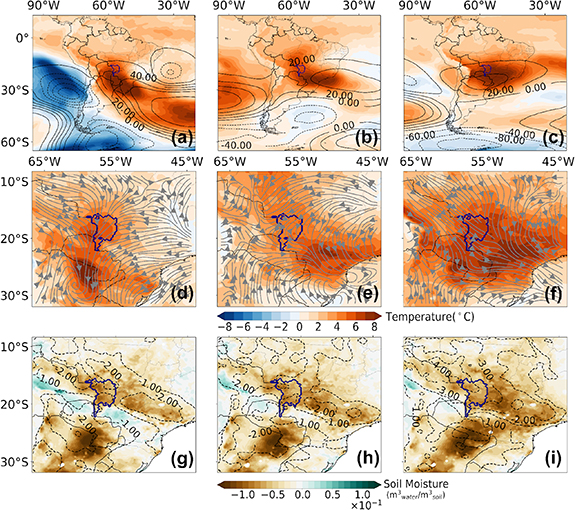
Finally, we evaluate the synoptic conditions that triggered the development of such CDHW events (figure 4). The spatial pattern of the 500 hPa geopotential height anomaly field indicates the presence of concentric positive anomalies during the second and third HPs over the Pantanal (figures 4 (b) and (c)). During the first HP, positive anomalies were also observed. However, they resulted from a northwest extension of the high-pressure system located over the South Atlantic Ocean (figure 4(a)). Exceptional low-tropospheric heating was also recorded as it can be observed by analyzing the 850 hPa temperature anomaly field. These conditions represent an enhanced anomalous anticyclonic circulation pattern over the Pantanal. This continental high-pressure anomaly was widespread and responsible for the air subsidence, causing pronounced adiabatic heating at the surface, through air compression, as well as the persistent clear sky conditions that promoted enhanced diabatic heating at surface (figure S3), low levels of humidity and the absence of precipitation episodes. Therefore, the ideal synoptic conditions for strong atmospheric heating and large evaporation rates were present throughout the P20F season, in particular during the third HP, when the Tmax values were, on average, 6 °C above the expected levels (figure 4(f)). Changes in the low tropospheric wind configuration were also observed, showing the signature, close to the surface, of this anticyclonic circulation pattern. During the two first HPs, it can be observed that the wind pattern presented a higher-than-normal northeast–southwest orientation (figures 4(d) and (e)). This anomalous wind pattern was marked by a confluence throughout a north-south oriented asymptote towards south Paraguay (during the first HP), and throughout a northwest-southeast oriented asymptote towards southeastern Brazil (during the second HP). In fact, by analyzing the mean of the observed wind configuration recorded during these two periods (figures S3(a) and (b)) one may conclude that air masses predominantly from the northeastern regions moved towards the Pantanal. During the third HP the 925 hPa wind pattern was substantially different (figures 4(f) and S3), showing an anomalous northwest-southeast orientation over the Pantanal. Nevertheless, a pronounced confluence similar to the one observed during the second HP was present. In fact, the asymptotes marking these regions of strong confluence were, for all the analyzed HP's, oriented towards the regions where the anomalies of Tmax were higher. This could indicate that the intense daytime heating in the low troposphere over these regions caused the lifting of air, imposing pronounced changes in the normal near-surface wind configuration.
Figure 4. (a), (b) and (c) Spatial patterns of the 850 hPa temperature (°C, shading) and of the 500 hPa geopotential height (gpm, contours) anomaly composites for the (a) 1st HP (26 August to 1 September), the (b) the 2nd HP (5 to 20 September) and (c) the 3rd HP (25 September to 10 October). (d), (e) and (f) Spatial patterns of the Tmax (°C, shading) and of the 925 hPa atmospheric circulation (streamlines) anomaly composites during the three previously considered HP (following the same panel order as in the first row). (g), (h) and (i) Spatial patterns of the soil moisture ( ) average anomalies during the three previously considered HP (following the same panel order as in the first and second rows). Contours show the spatial patterns of the SPI-6 values for August (g), September (h) and October (i) 2020.
Download figure:
Standard image High-resolution image
Therefore, during three HPs, the ideal synoptic conditions, triggering high rates of potential evaporation from the occurrence of clear sky conditions linked to atmospheric subsidence (figure S3), were observed over central SA, particularly in the Pantanal. However, due to the desiccated soil already observed at the time (figure 3(b)), the surface could not meet such atmospheric water demand. This led to low rates of actual evaporation and, consequently, to pronounced evaporative stress in the region (figure 3(c)) when extreme low levels of evaporative fraction were observed during these periods. The spatial pattern of the SPI-6 values, computed from the months when these HPs occurred, confirms severe meteorological drought conditions (figures 4(g)–(i)). An approximately northwest-southeast oriented broad region extending from northern Bolivia to southeastern Brazil, with Pantanal in its center, endured pronounced negative SPI-6 levels from August to October (ranging from −1 to −4). The soil moisture deficits during the three HPs (figures 4(g)–(i)) confirm this situation and are spatially consistent with the analysis of figure S2 by showing the high potential of soil desiccation in inducing low levels of evaporative fraction. A similar situation was also observed southwards, particularly over southern Paraguay and over northern Argentina. It is noteworthy the spatial match between the regions with strong positive Tmax anomalies and areas with negative soil moisture anomalies, emphasizing CDHW conditions, unequivocally associated with the land-atmosphere feedbacks over these SA regions and particularly over all subregions of the Pantanal (figure S2).
4. Discussion and conclusion
Previous studies for several regions in the globe, markedly Europe, the Mediterranean, the USA and Australia, highlighted the key role played by land-atmosphere feedbacks in the amplification of fire episodes [43–46]. However, to the best of our knowledge, the inter-links played by CDHW and fires in Brazil remained practically unknown, particularly in wetlands. Here, we provide evidence that the unprecedented P20Fs were favored by the joint effect of the observed drought and hot conditions. In fact, most of the P20Fs occurred simultaneously to CDHW episodes, which have fuelled fires through two distinct mechanisms, in a cascading effect. First, long-term precipitation deficits and large evaporation rates were essential to dry out the soil and vegetation and to reduce the flood pulse, providing unusual amounts of fuel to fires. In parallel, soil desiccation also played a key role in boosting the concurrence of extremely hot conditions through the establishment of a water-limited regime and an increase in the sensible heat flux between the surface and the atmosphere, increasing flammability thresholds.
High-pressure systems are known to favor CDHW conditions [47], particularly in the Pantanal [18] and also over surrounding regions such as Southeast Brazil [27]. These high-pressure (anticyclonic) anomalies are linked to large-scale teleconnections induced by perturbations of inter-tropical oceanic modes such as the Madden–Julian oscillation [45] and the El Niño-Southern oscillation [48]. In the analyzed CDHW events, positive anomalies of the 500 hPa geopotential heights associated with higher surface pressure over Central SA contributed to pronounced diabatic heating rates at the surface and strong atmospheric subsidence, allowing the escalation of temperatures and leveraging high evaporation rates until the soil dry out.
The occurrence of concurrent hazards (CDHW-fires) is widespread over Pantanal, showing however a great spatial variability in the amount of area affected by fire in each subregion. The P20F occurred mainly in forested zones (in the north) and areas that experienced no flooding and, consequently, had a huge amount of biomass as fuel, mainly as histosols [3], while the fires during the 2001–2019 fire seasons tended to occur in savanna environments (mainly in the south). This fact reinforces the relative contribution of climate and fuel as drivers of fire activity [43, 49]. Accordingly, in regions where fuel was not a limiting factor, fire activity tended to be more vulnerable to CDHW, increasing flammability and the probability of high fire spread.
Previous studies have shown that differences in hydrology modulate nexus between large-scale climatic or geomorphic drivers and vegetation (fuel availability) in the Pantanal [50]. Therefore, it is fundamental to consider the hydrological variability to understand fire dynamics, through the influence of the seasonal north-to-south flood-pulse wave of the Paraguay River, as noted before for Amazonia floodplains [51]. In general, summer rainfall in surrounding areas of the Pantanal results in a slow-moving flood pulse from north to south. Due to complex processes of water retention and flow through floodplain, inundation of the central and southern Pantanal may occur several months after the rainfall peaks [48]. Under these circumstances, areas in the northern Pantanal and areas away from floodplains, vegetation biomass respond synchronically to rainfall [50]. Moreover, as we showed here these areas have spatial matches between strong positive Tmax and negative soil moisture anomalies, particularly in some hydrological regions in the north. On the other hand, in flooded areas, rainfall and vegetation productivity are not clearly correlated [50]. This dynamic suggests that land-atmosphere physical mechanisms responsible for triggering the amplification of fires as we showed here seem to operate more strongly in the years without large floods, as in 2019 and 2020. It is likely that these mechanisms do not have the same importance and synchronicity across the different regions of the Pantanal, nor during years of large floods.
Climate change scenarios from state-of-the-art models, project significant warming in the Pantanal, and although changes in the precipitation pattern are less clear cut than those expected for temperature [52, 53], projected changes in SA monsoon have shown a reduction in the length of the rainy season by the end of the century [54]. Indeed, our results highlight that the current trend in the Pantanal temperature since 1980 is approximately four times greater than the average global warming [8]. The fact that CDHW events are expected to become more frequent and intense worldwide under future climate scenarios [55] may reinforce the occurrence of large fires as also shown for other regions [20, 41, 43, 44, 56, 57]. We are confident that our findings are relevant for other regions of the world, as some of the driving physical mechanisms described here, namely those responsible for the CDHWs, also apply across other ecosystems, implying higher flammability conditions and further efforts for monitoring and predicting such events.
It is worth mentioning that fire is also influenced by drivers beyond those directly associated with weather conditions, namely fuel availability and socio-economic factors. As stated by previous authors [2, 4, 58], the P20F outbreak is not attributable to just a single factor, but rather results from a complex interplay among several contributing factors, including weather conditions, availability of fuel (vegetation), and human ignition sources (both accidental and intended) [2]. A recent study showed that human-caused fires exacerbated drought effects on natural ecosystem during the P20F season, with more BAs primarily over natural areas [59].
Accordingly, any strategy to mitigate the effects of wildfires in the Pantanal needs to consider a combination of these factors and the different characteristics of each one. Accordingly, integrative fire strategies should require adaptive and social transformative perspectives [4, 60]. Thus, our results may improve the assessment of potential high-impact hazards, like the P20F, helping stakeholders to act upon these complex events.
Acknowledgments
This work was developed under the scope of Project Andura (CNPq Grant No. 441971/2018–0) and partially funded by Project Rede Pantanal from the Ministry of Science, Technology and Innovations of Brazil (FINEP Grant No. 01.20.0201.00). R L was supported by CNPq (Grant No. 305159/2018–6) and FAPERJ (Grant No. E26/202.714/2019); J L G and P S S were supported by FCT (Grant Nos. 2020.05198.BD and SFRH/BD/146646/2019); A R and R T were supported by FCT (IMPECAF, PTDC CTA-CLI28902 2017); J N was supported by the 'Women in Research'-fellowship program, Westfälische Wilhelms-Universität Münster (WWU Münster); J A R was supported by CNPq (Grant No. 380779/2019–6); L B C B was supported by FAPERJ (Grant No. E-26/202.118/2020); F O R was supported by CNPq (Grant No. 302755/2018-7); J A M was supported by CNPq (Grant No. 465501/2014–1), FAPESP (Grant Nos. 2014/50848–9 and 2017/09659–6) and CAPES (Grant No. 88887.136402/2017–00). FCT supports IDL (Project No. UIDB/50019/2020). We thank Ivan Bergier for his helpful suggestions about the hydrological dynamics of the Pantanal in an earlier version of the manuscript.
Data availability statement
The data that support the findings of this study are available upon reasonable request from the authors.