

Abstract
Soil microbial communities potentially serve as indicators for their responses to changes in various ecosystems at scales from a region to the globe. However, changes in wetland soil bacterial communities and how they are related to urbanization intensities remains poorly understood. Here, we collected 60 soil samples along urbanization intensity gradients from 20 wetlands. We measured a range of environmental factors and characterized bacterial communities structure using 16S ribosomal RNA (16S rRNA) gene amplicon sequencing that targeted the V4-V5 region. Our results revealed the dominant soil bacterial phyla included Proteobacteria (39.3%), Acidobacteria (21.4%) and Chloroflexi (12.3%) in the wetlands, and showed a significant divergence of composition in intensive urbanization area (UI_4) than other places. A critical 'threshold' exists in the soil bacterial diversity, demonstrating different patterns: a gradual increase in the areas of low-to-intermediate disturbances but a significant decrease in highly urbanized areas where metabolic functions were significantly strong. Additionally, soil pH, total phosphorus (TP), available phosphorus (AP) and ammonia nitrogen (NH4+-N) made a significant contribution to variations in bacterial communities, explaining 49.6%, 35.1%, 26.2% and 30.7% of the total variance, respectively. pH and NH4+-N were identified as the main environmental drivers to determine bacterial community structure and diversity in the urban wetlands. Our results highlight collective changes in multiple environmental variables induced by urbanization rather than by the proportion of impervious surface area (ISA), which were potentially attributed to the spatial heterogeneity along different urbanization gradients.
Export citation and abstract BibTeX RIS

Original content from this work may be used under the terms of the Creative Commons Attribution 4.0 license. Any further distribution of this work must maintain attribution to the author(s) and the title of the work, journal citation and DOI.
1. Introduction
Wetlands are major reservoirs of genetic and species diversity (Gorham 1991) and provide important ecosystem services (Mitsch and Gosselink 2000). Urban wetland are spatially heterogeneous ecosystems, in which physical geomorphological changes associated with roads, building construction, disturbances and pollution caused by human activities could alter the micro-climate and habitat characteristics (Rockström et al 2009, Youngsteadt et al 2015). Urbanization collectively caused disturbances to wetland environment (Moffett et al 2015) and leads to dramatic changes in ecosystem functions (Rockström et al 2009, Zhu et al 2011, Cui et al 2019, Li and Zhou 2019) that affect the microorganisms especially for bacterial communities in wetland soils (Wu et al 2017, Delgado-Baquerizo et al 2018). The response of bacterial communities to urbanization may affect the key ecological processes such as biogeochemical cycles in wetland ecosystems (Hartman et al 2008). Understanding how urbanization influences wetland soil bacterial communities is essential for evaluating the influences of urbanization on both wetland nutrient cycles and global biogeochemical cycles (Kaye et al 2005).
Soil bacteria play an important role in wetlands, such as regulating the carbon and nitrogen cycling and the release of major nutrients (Roulet 2000). However, the extent to which bacterial communities in wetland soils respond to urbanization intensity gradients is less well understood. Urbanization substantially influences the physicochemical properties of soils (Utz et al 2011) and ultimately causes the changes in the structure of bacterial communities (McCaig et al 2001). Previous studies regarding urbanization gradients that have considered factors that impact bacterial communities in many terrestrial and aquatic ecosystems were classified according to the human population (Wang et al 2017), urban ring roads (Yan et al 2016), land use and economic development levels (Li et al 2020). For example, researches has indicated that an elevated urbanization level induces the loss of bacterial biodiversity and ecological functions in aquatic ecosystems (Hosen et al 2017). However, wetlands, as transitional gradients between terrestrial and aquatic ecosystems linking to an exchange of water, soil, nutrients, sediments and organisms, thus they may have more complex changes in their microbial communities.
Although soil bacterial communities can be driven by changes in environmental conditions and spatial factors, there is limited progress in understanding what are the key factors that manipulated the soil bacterial communities in urban wetlands and their relationships to the different urbanization gradients. Previous work has demonstrated how microbial communities in ecosystems are related to the physical, chemical and biological characteristics (Gregg et al 2003). For example, nitrogen (N) and carbon (C) availability are among the important environmental predictors of bacterial communities' composition and diversity in wetland soils (Ma et al 2020). In addition, spatial factors have been considered to be important competitive elements that driving microbial community changes at larger spatial scales (Horner-Devine et al 2004, Hollister et al 2010). With urbanization, changes in the impervious surface area (ISA) can exert significant impacts on soil nutrients and vegetation growth, and thereby affecting the underlying ecological processes and functions (Raciti et al 2012, Seto et al 2012, Hu et al 2018). For example, Zhao et al (2016) developed a general conceptual framework for quantifying the impacts of urbanization on vegetation growth and indicated that vegetation growth decreased with urbanization intensity (defined by the ISA). Soil bacteria are sensitive to environmental changes (Harris 2009), which attract our attention to question linking bacterial communities to urbanization intensity gradients defined by the ISA. Therefore, we present that if urbanization intensity is an appropriate indicator for quantifying the impacts of urbanization on changes of bacterial communities' composition and diversity in wetland soil.
Fully understanding the responses of soil bacterial communities in wetland based on the influences of different urbanization intensities combing with aspects of soil environmental factors would provide new insights into the effect of urbanization on the wetland ecosystems. In this study, we apply high throughput sequencing of the 16S ribosomal RNA (16S rRNA) genes of wetland soil bacterial groups in wetland soils to examine how the diversity and composition index changes along different urbanization gradients in Changsha-Zhuzhou-Xiangtan (Chang-Zhu-Tan) agglomeration of Hunan province, China. We used these results to address three questions: (a) how did bacterial communities in wetlands change in response to urbanization intensities? (b) what are the key factors that determined the soil bacterial communities in the wetlands and their relationships to the urbanization intensity gradients? and (c) whether the urbanization intensity measured as ISA can be an appropriate indicator of changes in bacterial communities in wetland soils?
2. Materials and methods
2.1. Study sites and sample collection
The study sites were located in the Chang-Zhu-Tan agglomeration of Hunan Province, China, which is in the middle and lower reaches of Xiangjiang River (figure 1) (27°49'N ∼ 28°15'N, 112°54' to 113°10'E). The annual precipitation is approximately 1400 mm and the averaged temperature is 17 °C. This region has a typical subtropical monsoon climate. The Chang-Zhu-Xiang agglomeration, an important economic center in South China and one of the largest city agglomerations in the middle reach of the Yangtze River (Gu et al 2020), has experienced rapid economic growth and urbanization.
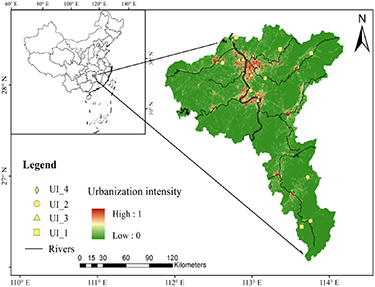
Figure 1. The sampling locations and distribution across the Chang-Zhu-Tan agglomeration and the solid dots represent the wetland soil sampling sites.
Download figure:
Standard image High-resolution imageThe land cover data in 2017 were obtained from our previous study with 30 m × 30 m spatial resolution. It was derived from the continuous change detection and classification method of Landsat 5, 7, 8 and multisource remote sensing data with the Random Forest classifier (Liu et al 2020). The overall classification accuracy for the 2017 dataset was more than 90%. The land cover product consisted six categories (Cropland, Forest, Grassland, Wetland, Water and impervious surface). The urbanization intensity in this paper was defined as the percentage of ISA within an area of 2 km × 2 km that was equivalent to our field study and expressed as:
where UIi is the urbanization intensity, UAi is the area of impervious surface, and TAi is the total area of the ith 2.0 km × 2.0 km grid. For convenience, we grouped urbanization intensities into four groups: UI_1 (UI < 0.1, the less anthropogenically influenced reference site); UI_2 (0.1 ⩽ UI < 0.3, the suburban development area, in proximity of the farmlands and villagers); UI_3 (0.3 ⩽ UI < 0.6, the urban area, within the urban park or constructed wetland park); and UI_4 (UI ⩾ 0.6, within the most urbanized site, and in proximity of the industrial workshop, chemical plant or gas station) (table S1 (available online at stacks.iop.org/ERL/17/014027/mmedia)).
A total of 60 soil samples were collected along with the different degrees of urbanization from 20 sites in April, 2019 and each site had three replicate samples. Three soil samples (∼300 g each) were collected randomly within each wetland from the top 10 cm of wetland soil at the land-water interface. A total of 60 samples were prepared and c. About 500 g of each sample was used for physicochemical analyses. A portion of each soil sample was stored at −80 °C for soil DNA extraction.
2.2. Determination of soil chemical properties
Soil pH was determined with air-dried soil samples (sieved to <2 mm) in 1: 2.5 soil: water (w/v) suspension after 30 min of incubation using a pH meter PHS-3 C (INESA instruments Inc., China). Total organic carbon (TOC) in samples was analyzed using TOC analyzers (TOC-VCPH) analyzer (Shimadzu, Japan). Total nitrogen (TN) was analyzed by UV spectrophotometry using UV-2550 (Metash instruments Inc., China). Total phosphorus (TP) and available phosphorus (AP) were determined by segmented flow analysis in an AutoAnalyzer II (Bran + Luebbe, Germany). Ammonia nitrogen (NH4 +-N) and nitrate (NO3 −-N) were determined by continuous-flow automated analyzer with 2 M potassium chloride at 1:5 (w/v) ratio. Sulfate (SO4 2−) was tested using ICs-2000 Ion chromatography (Dana Inc., USA).
2.3. DNA extraction and sequencing
Microbial DNA was extracted from wetland soil samples using the E.Z.N.Z. ® soil DNA Kit (Omega Bio-tek, Norcross, GA, U.S.). The final DNA concentration and purification were determined with NanoDrop 2000 UV–vis spectrophotometer (Thermo Scientific, Wilmington, USA), and DNA quality was checked by 1% agarose gel electrophoresis. Polymerase Chain Reaction (PCR) was performed in triplicate 20 µl mixture containing 4 µl of 5 × FastPfu Buffer, 2 µl of 2.5 mM dNTPs, 0.8 µl of each primer (5 µM), 0.4 µl of FastPfu Polymerase and 10 ng of template DNA. The resulted PCR products were extracted from a 2% agarose gel and further purified using the AxyPrep DNA Gel Extration Kit (Axygen Biosciences, Union City, CA, USA) and quantified using QuantiFluorTM-ST (Promega, USA). Purified amplicons were pooled in equimolar and paired-end sequenced (2 × 300) on an Iluumina Miseq platform (Illumina, San Diego, USA) according to the standard protocols by Majorbio Bio-Pharm Technology Co. Ltd (Shanghai, China). The raw reads were deposited into the NCBI sequece read archive database (Accession Number: PRJNA566311).
Raw fastq files were demultiplexed, quality-filtered by Trimmomatic and merged by FLASH. Operational taxonomic units (OTUs) were clustered with 97% similarity cutoff using UPARSE (version 7.1 http://drive5.com/uparse/) and chimeric sequences were identified and removed using UCHIME. The representative sequences were assigned to taxonomy using RDP Classifier algorithm (http://rdp.cme.msu.edu/) against the Silva (SSU123) 16 S rRNA database using confidence threshold of 70%. Sequences used for the phylogenetic investigation of communities by reconstruction of unobserved states (PICRUSt) prediction were clustered into OTUs with a similarity threshold 0.97 in QIIME 1.8.0, and the Greengenes database (gg_13_8) was used as a reference for clustering.
2.4. Statistical analysis
All of the statistical analyses were conducted using R 3.5 with the vegan, ecodist and ggplot packages. Alpha diversity indexes (Shannon, Observed_species, Ace and Chao) were analyzed to evaluate differences in the bacterial community diversity. Nonparametric tests (Kruskal–Wallis tests) were used for significant differential comparisons at different degrees of urbanization. Stepwise multiple regression analysis was performed to determine the potential for environmental factors to explain differences in the bacterial diversity. Non-metric multidimensional scaling (NMDS) analysis was performed to assess variations in the bacterial community structure based on the Bray-Curtis dissimilarity distance index. The bacterial community structure were compared with one-way analysis of similarities (ANOSIM) using PRIMER 6 (Plymouth Routines In Multivariate Ecological Research) (Clarke and Gorley 2006). Biomarker analysis was performed by the linear discriminant analysis for effect size (LEfSe) using the Kruskal–Wallis test to determine the significant difference in soil bacterial species between groups. The Canonical correspondence analysis (CCA) was used to determine the correlations between bacterial communities and environmental factors. The Mantel test (Spearman's rank correlation analysis) was performed to determine the correlation between bacterial communities and environmental variables at the OTU level. The predicted relative abundances of genes for selected pathways representing bacterial functions were plotted by the heatmap package.
We used the structural equation model (SEM) in the lavaan package to determine both the direct and indirect effects of environmental factors on bacterial communities. All data were standardized and transformed to improve normality. We then generated a priori model including the ISA, soil properties, and bacterial community (biodiversity index and dominant group abundance) based on effects and relationships among the independent drivers and effects on the bacterial communities. The model was tested iteratively using the bootstrap goodness-of-fit test and non-significant links were subsequentially removed until a significant model fit with a root mean squared error (RMSE) of ⩽0.05), P-value of >0.05 and the lowest comparative fit index (CFI) value (CFI corrected for small sample size (> 0.95) (Schermelleh-Engel et al 2003).
3. Results
3.1. Environmental characteristics
Wetland soil properties showed various patterns along the urbanization intensity gradients (figure S2 and table S2). The soil pH, TOC, TN, TP, AP, and NO3 - tended to decrease with the urbanization intensity and their lowest values were observed in UI_4. As shown in table S2, samples from UI_4 were more acidic and had a significantly lower average pH. The nutrient contents at the low urbanization intensity sites (UI_1 and UI_2) were significantly higher than at the urban sites (UI_3 and UI_4) (P< 0.01). Whereas, the highest contents of NH4 + and SO4 2− were found at the most urbanized sites (UI_4), which received a high amounts of sewage from residential or industrial surroundings (P < 0.01).
3.2. Variations in the bacterial diversity
The data in figure 2 and table S5 indicated that the Observed_species, Chao, Ace and Shannon indexes followed a positive correlation with the low and median gradient of the urbanization intensity (from UI_1 to UI_3), but did not vary significantly between these three intensity levels (P > 0.05). The bacterial community diversity was observed being the highest in the UI_3 and the significantly lower in UI_4 (P < 0.01).
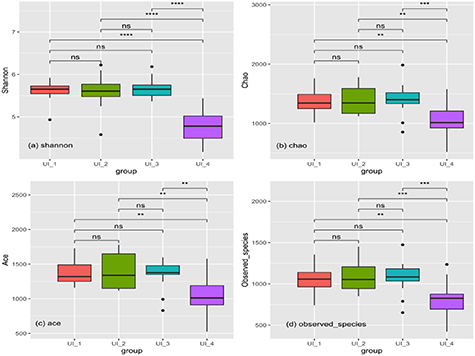
Figure 2. Alpha diversity comparison of bacterial community of wetland soils by different urbanization intensities.
Download figure:
Standard image High-resolution image3.3. Composition of the bacterial communities (dominant taxa)
Approximately 722 547 high quality sequences with an average of 36 127 sequences per sample (ranging from 26 795 to 51 872) were obtained. All of the sequences classified below the phylum level had 55 545 OTUs at the 97% identity threshold in total, with the number of OTUs ranging from 1714 to 3981 per sample (tables S3 and S4). The rarefaction curves showed clear asymptotes (figure S1), indicating that sequences generated from these samples represented most of the bacterial communities in the sampling sites.
The obtained sequences were assigned to 54 bacterial phyla, 137 classes, 391 orders, and 662 families. Most sequences of 16 S rRNA were mainly assigned to Proteobacteria (39.31%), Acidobacteria (21.43%), Chloroflexi (12.28%), Bacteroidetes (4.98%) and Actinobacteria (3.77%) (figure 3). Lower abundance of Proteobacteria and Nitrospirae were found in the urban areas from UI_3 to UI_4. In highly urbanizaed areas (UI_4), Acidobacteria (27.02%), Bacteroidetes (5.68%), Actinobacteria (4.83%) and WPS-2 (1.14%) dominated the wetland soil bacterial communities. The most abundance classes were Gammaproteobacteria (18.86%), Deltaproteobacteria (11.86%), Alphaproteobacteria (10.5%), Acidobacteriia (7.29%) and Anaerolineae (5.61%) (figure S4). In the group of UI_4, Gammaproteobacteria (20.17%) and Acidobacteriia (14.78%) dominated the wetland soil bacterial species.
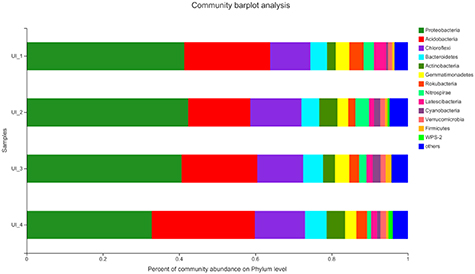
Figure 3. Relative abundances of bacterial community composition at phylum level detected in wetland soils by different urbanization intensities. Abundance is represented in terms of an average percentage of the total effective bacterial sequences of three samples from each sampling site, and classified by RDP Classifier at confidence threshold of 97%. Others refers to the taxa with a maximum abundance of <1% in any sample.
Download figure:
Standard image High-resolution imageDifference in the wetland soil bacterial structure was found when LEfSe algorithm was used to determine the taxon that best characterizes each biological class. As shown in figure S5, 26 bacteria clades exhibited significant difference in all soil samples with an LDA threshold of 2.0. The samples of UI_4 were rich in Ktedonobacteria, norank_p__WPS-2 and Planctomycetacia.
The NMDS plot based on the Bray-Curtis distance revealed a significant variability in bacterial community composition across different urbanization intensity gradients (figure 4(a)). The ANOSIM analysis revealed significant differences between the bacterial community structures among different urbanization intensities at the OTU level (R = 0.1364, P = 0.001) (figure 4(b)).
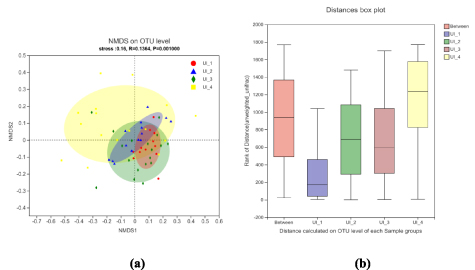
Figure 4. (a) NMDS plot based on the Bray-Cutis dissimilarities. The main ordination shows similarity between samples and the arrows show correlations between environmental factors and ordination axes; (b) ANOSIM based on the Uweighted_Unifrac distance at the OTU level to statistically evaluate the difference between different urbanization intensities groups for the bacterial communities.
Download figure:
Standard image High-resolution image3.4. Relationships between the environmental factors and the bacterial community compositions
As shown in figure 5, the bacterial community structure was influenced by environmental variables (including TOC, pH, TN, TP, AP, NH4 +-N, NO3 −-N and SO4 2−) and urbanization intensity (Urb). The CCA1 and CCA2 explained 15.38% and 7.63% of the total variance in the bacterial community, respectively. Of all the variables listed in table 1, pH (P = 0.001), TP (P = 0.001), AP (P = 0.001) and NH4 +-N (P = 0.001) had the strongest effect on the bacterial community composition explaining 49.6%, 35.1%, 26.2% and 30.7% of the total variance, respectively. The pH was identified as the main environmental drivers that determined the bacterial community structure and diversity in the urban wetlands. Urbanization intensity did influence the bacterial community composition (P = 0.014) by contributing 14.6% to the total variance.

Figure 5. CCA of OTU and environmental factors (arrows). The values of axe1 and 2 are the percentages explained by corresponding axis. Symbols indicated sampling sites and arrows indicate environmental factors and their relative effects on bacterial communities. The lengths of the arrows indicate how much variance was explained by the environmental factors. Urb, urbanization intensity based on the ISA value for 2.0 km × 2.0 km grids.
Download figure:
Standard image High-resolution imageTable 1. Mantel tests of bacterial community at OTU level among different urbanization intensities in all groups.
| Environmental variables | UI_1 | UI_2 | UI_3 | UI_4 | All groups |
|---|---|---|---|---|---|
| P | P | P | P | P | |
| pH | 0.301 | 0.049 | 0.041 | 0.006 | 0.001 |
| TOC | 0.006 | 0.665 | 0.008 | 0.442 | 0.006 |
| TP | 0.013 | 0.005 | 0.001 | 0.015 | 0.001 |
| TN | 0.011 | 0.006 | 0.529 | 0.889 | 0.196 |
| AP | 0.018 | 0.001 | 0.006 | 0.152 | 0.001 |
| NH+ 4_N | 0.012 | 0.017 | 0.014 | 0.006 | 0.001 |
| NO− 3_N | 0.829 | 0.2 | 0.436 | 0.632 | 0.025 |
| SO4 2− | 0.787 | 0.087 | 0.509 | 0.077 | 0.007 |
| URB | 0.086 | 0.001 | 0.894 | 0.002 | 0.014 |
The significance (P value) were determined based on 999 permutations between community structure (Bray-Curits distance), environmental factors and urbanization intensity. Values in bold indicate significant correlations (P <0.01). URB, urbanization intensity based on the ISA value for 2.0 km × 2.0 km grids.
The Spearman rank correlation was used to analyze the relationship between environmental factors and the abundance of dominant bacteria populations (figure S6). The correlation heat map showed that Acidobacteria was negatively correlated with soil pH (P < 0.001). Chloroflexi was significantly negatively correlated with soil pH, TOC, TP, TN, and NO3-N (P < 0.05). Firmicutes had a positive correlation with pH, AP, SO4 2− and Urb (P < 0.01). Bacteroidetes showed a significant positive correlation with soil pH, TN and TP (P < 0.01).
The SEM models explained 23.3% ∼ 26.8% of the variance found in the bacterial diversity and abundance among samples examined (figure 6). Compared to the urbanization intensity, environmental variables had stronger effects on the bacterial diversity and composition. As shown in figure 6(a), AvN (inorganic nitrogen: NH4 +-N and NO3 −-N) showed a robustly negative effect on the Shannon, Observed richness and Chao of the bacterial communities (path coefficient = −0.68, −0.58 and −0.56, respectively), whereas the urbanization intensity (URB) showed weakly negative effects on the above indices (path coefficient = −0.35, −0.31 and −0.25, respectively), but it was positively correlated with SO4 2− (path coefficient = 0.65). The diversity of bacterial communities was influenced positively by the rest of the environmental variables, most notably by AP (path coefficient = 0.33, 0.44 and 0.46) and pH (path coefficient = 0.35, 0.36, and 0.36).

Figure 6. Structural equation model (SEM) results of interactions with environmental factors, urbanization intensity, bacterial diversity and composition along rural-urban gradients. (a) bacterial diversity, are presented by the Shannon indices, observed_species and Chao estimators; (b) bacterial composition, are presented by Proteobacteria, Acidobacteria, Chloroflexi and Nitrospirae. Arrows indicate notable effect sizes (P < 0.1), where the thickness of the arrow represents the strength of the relationship (green lines indicates positive relationship, while red lines indicates negative relationships). Standardized path coefficients (P values) are shown next to pathways. ToN, total nutrient; AvN, available nitrogen; URB, urbanization intensity based on the ISA value for each grid. URB1, the study area was split into 0.25 km × 0.25 km grids; URB2, the study area was split into 1.0 km × 1.0 km grids; URB3, the study area was split into 2.0 km × 2.0 km grids; URB4, the study area was split into 5.0 km × 5.0 km grids.
Download figure:
Standard image High-resolution imageFor the dominant bacterial groups, we examined the relationships between the environmental factors and the three most abundant phyla (Proteobacteria, Acidobacteria and Chloroflexi) plus the Nitrospirae (one of nitrification groups in the nitrogen cycle) (figure 6(b)). AvN had a strong positive effect on Proteobacteria (path coefficient = 0.90), but significantly negative effects on Acidobacteria, Chloroflexi and Nitrospirae (path coefficient = −0.66, −0.39 and −0.54, respectively). The results also showed that ToN contributed more to the abundance of bacterial communities than to the diversity by enhancing Nitrospirae (path coefficient = 0.76) but limiting Proteobacteria (path coefficient = −0.38). On the other hand, pH showed strongly negative effects on Acidobacteria (path coefficient = −0.44) and positive effects on Proteobacteria (path coefficient = 0.43) as well as a direct negative effect of AP on the abundance of both Chloroflexi and Nitrospirae (path coefficient = −0.53 and −0.23).
3.5. Potential functional consequences of the bacterial communities
As illustrated in figure 7, PICRUSt predicted the occurrence of several genes potentially involved in cellular processes, environmental information processing, genetic information processing, human diseases, metabolism, organismal systems and unclassified in the bacterial communities. For 60 samples, the nearest sequence taxon index of PICRUSt ranged from 0.12 to 0.26. The genes related to the biosynthesis of other secondary metabolites, enzyme families, lipid metabolism and metabolism of other amino acids were the top four pathways in the cluster of metabolisms. In general, the UI_4 samples had significantly higher abundances of functional genes among these pathways. For example, 12 pathways were observed for metabolism, the UI_4 showed higher abundance in carbohydrate metabolism, enzyme families, metabolism of other amino acids (p < 0.05), and the abundance of biosynthesis of other secondary metabolites significantly higher than other groups (p < 0.01). PICRUSt provided important insight into the bacterial community functions between different urbanization intensities. However, the accuracy of PICRUSt for predicting bacterial metabolic pathways depended much on the available reference bacterial ggenome in database. Although high agreement has been reached between the PICRUSt predictions and the metagenome data, the relevance of using PICRUSt to predict bacterial functions requires further validation. Other omics approaches (e.g. transcriptomics and metabolomics) are required to confirm these discoveries and improve our understanding of the bacterial functions in wetlands along different urbanization intensities.
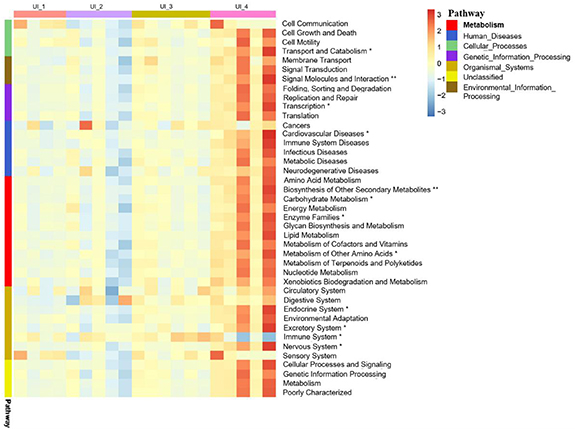
Figure 7. Relative abundances of Phylogenetic Investigation of Communities by Reconstruction of Unobserved States (PICRUSt) predicted function relevant to cellular processing, genetic information processing and metabolism by different urbanization intensity levels. Asterisks indicate significant differences between different urbanization intensities (Kruskal–Wallis test,**P < 0.01, *P < 0.05).
Download figure:
Standard image High-resolution image4. Discussion
4.1. Bacterial community diversity under urbanization: the ' threshold hypothesis'
Our results highlighted the proportion of ISA was not sufficient for inferring controls on bacterial community structure and composition. Urbanization could affect bacterial communities by directly or indirectly changing environmental characteristics in wetlands, which were potentially attributed to the complex gradient along which many environmental variables are changing. Identifying determinants of changes in bacterial communities also requires detailed information on land covers, demographics and soil physicochemical properties (Zhang et al 2020).
The differences in bacterial community structure were reflected in the alpha diversity indices. It is generally believed that a higher environmental heterogeneity can impact the establishment of dispersed species and reduce the similarity of bacterial community composition, and further lead to high diversity (Questad and Foster 2008, Kuramae et al 2012, Dini-Andreote et al 2015, Tripathi et al 2018). However, other studies have shown the urbanization likely increases habitat heterogeneity and results in a lower level of diversity (Wang et al 2017, Zhang et al 2020). This is probably because the urbanization gradients were less continuous and the environmental conditions were more homogeneous. Our study showed a slow increasing in diversity under the low and medium urbanization intensities, which can be attributed to the greater environmental heterogeneity. However, a significantly lower diversity was observed in group UI_4 which had the highest environmental heterogeneity. In this study, UI_4 sampling sites were in proximity to industrial and residential areas. In the urban environment, the increase of urbanization intensity gradients (represented by the percentage of ISA) from nature-dominated area to human dominated area may result in the wetlands being near to industrial and residential sewage outlets. Extreme urban habitat fragmentation, extensive impervious surface and disturbance and pollution inputs have existed to form a strong selection pressure on bacterial communities (Yao et al 2014) and potentially influence metabolic functions (Peng et al 2020). Therefore, the PICRUSt results suggested that the metabolic functions were relatively strengthened in the UI_4 of the most urbanized sites to provide consistent and generic niche adaptation.
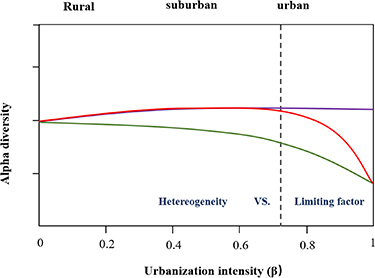
We believed that there was a threshold value of wetland soil bacterial diversity along urbanization intensity gradients (figure 8). In this study, the bacterial community structure is relatively stable along urbanization gradients, which likely attributed to the physiological flexibility and stability of the bacterial communities. However, once the system surpassed a threshold, the parameters of the soil physicochemical properties and bacterial communities could rapidly shift to a new stable status. This threshold may vary with the bacteria and the environmental conditions (Scheffer et al 2001, Mikkelson et al 2016). Although our results showed this pattern, due to the complexity and heterogeneity of mosaic urban microhabitats, a broader investigation covering each threshold should be considered in the further studies to support the contention that this represents a threshold.
Figure 8. The red line represented the nonlinear characteristics of alpha diversity along the urbanization intensity gradient, which is described as the 'threshold hypothesis', where a threshold exist beyond which the limiting factors cause significant decrease in diversity. The purple line indicates the impacts of urbanization intensity on bacterial diversity without limiting factors (Carrino-Kyker et al 2011). The green line indicates the negative impacts of urbanization intensities on diversity in the absence of a threshold (Wang et al 2017, Zhang et al 2020).
Download figure:
Standard image High-resolution image
4.2. Bacterial community composition
The wetland bacterial communities in our study area had relatively stable compositions to ensure their ecological functions. Here, five major phyla (Proteobacteria (39.31%), Acidobacteria (21.43%), Chloroflexi (12.28%), Bacteroidetes (4.98%), and Actinobacteria (3.77%)) were found in all of the soil samples and together accounted for greater than 80% of the sequences (figure 3). Although the dominant presence of these five phyla was also observed in different samples (Hu et al 2017, Sun et al 2019). Our study highlighted some taxa that were significantly different in terms of abundance across site groups. For example, the abundance of Nitrospirae, an oligotrophic bacteria, was suppressed significantly in the most urbanized group of UI_4 with a lower pH condition, and the highest abundance was found in the less urbanized UI_2 group. Interestingly, the NH4 +-N content was extremely higher in UI_2 and UI_4. Nitrospirae species can nitrify Gram-negative chemoautotrophic bacteria, however, nitrifying bacteria cannot be directly inhibited by the toxicity of the NH4 + since they can work with high NH4 + concentration (Altmann et al 2003). The significantly lower abundance of Nitrospirae in UI_4 may be attributed to other pollutants, such as heavy metals and permanent organic pollutants (Yang et al 2013). In contrast, the Acidobacteria, Bacteroidetes, and Actinobacteria were relatively abundant phyla in UI_4. The Acidobacteria were abundant in acidic soils with high organic matter. The Bacteroidetes were distinctly copiotrophic. Members of Actinobacteria are associated with stress tolerance (Gong et al 2018), and probably existed as a result of lower pH and organic matter contamination in the most urbanized area. Firmicutes, as an indicator of fecal contamination, is one of the markers for identifying human feces in untreated sewage waters (Shanks et al 2013, McLellan and Eren 2014) and was reported that dominated in many areas seriously polluted and disturbed by human activities (Lu et al 2016). Their ability to form spores facilitates their survival in a variety of aerobic and anaerobic environments (Galperin 2013). In this study, the highest abundance of Firmicutes in UI_4 (highly urbanization areas) tend to be linked with the untreated fecal sewage, in which sewage waters serve as common delivery routes for fecal matter to aquatic ecosystems (Aragonés et al 2016).
4.3. Effects of environmental factors
Urbanization induces environmental heterogeneity and strongly influences bacterial communities. Our results showed that changes in the soil pH, TP, AP, NH4 +-N and SO4 2− can significantly affects bacterial communities across urbanization intensity gradients. For example, studies have highlighted the importance of pH as an integrating variable that provides an integrated index of the soil environment and influencing bacterial communities (Lauber et al 2009, Griffiths et al 2011, Shen et al 2013, Tian et al 2018). In our study, the bacterial diversity was positively correlated with soil pH (figure 6(a)), which was agreed with previous studies (Yao et al 2014, Yang et al 2018). A lower pH can narrow the niche of soil bacterial communities and consequently lead toa lower diversity because of selective stress on some sensitive bacteria (Fierer et al 2007, Shen et al 2013, Bárta et al 2017). On the contrary, some bacteria can thrive in acidic soils with high organic matter. For example, the high abundance of Acidobacteria was due to its high level of adaption to acidic habitats (figures 5 and 6), such as urban wetlands impacted by wastewater drainage.
Previous studies have found that the total nutrients highly correlates with the total bacterial cell abundance and activity (Dai et al 2019) and can increase (Tan et al 2013) or decrease (Chhabra et al 2013) the bacterial diversity. In our study, the total nutrients (TC, TN and TP) contributed more to the abundance of the bacterial communities than to the diversity. For example, TP was found to be significantly correlated with the bacterial communities (Mantel test, p= 0.001). The relationship of inorganic nitrogen(e.g. NH4 +-N, NO3 −-N) and the bacterial community composition might be directly or indirectly related to soil pH, because variation in inorganic nitrogen might regulate the availability of soil nutrients (Fierer et al 2007, Trivedi et al 2013, Delgado-Baquerizo et al 2017, Yang et al 2018). Therefore, it is believed that the bioavailable forms of N might be used more by microorganisms and is more closely associated with bacterial community structure (Hou et al 2015, Soares et al 2017). According to the SEM results, AvN and pH had a significantly negative effect on Acidobacteria, and NH4 +-N was identified as the key driver of bacterial community in the urban wetlands. However, researches pointed to the positive correlation between Acidobacteria subgroups 1, 2 and 17 with soil amended with inorganic N (Leite et al 2017), and Acidobacteria subgroup 4, 6, 7 and 16 positively correlated with soil pH (Rousk et al 2010). Acidobacteria is a broad and phylogenetically diverse phylum. More detailed analysis at the subgroup level revealed that they respond differently to soil characteristics. A similar discrepancy was observed regarding our group of Nitrospira, which according to Maeschner et al (2003) become increased in high inorganic N content. The SEM results only indicate a positive or negative relationship based on standardized path coefficients, but apparent inconsistencies highlight the need for a deeper characterization of microbial r/k-strategists at taxa levels. Additionally, our results provide evidences that the bacterial communities may have a major response to the SO4 2− level, and the sulphate cycle process is largely influenced by anthropogenic activities and sulphur supports the metabolisms of organisms growing in environments contaminated with pollutants. In the SEM analysis, the SO4 2− concentration was shown to be significantly correlated with the urbanization intensity, and this was an environmental factor that could indirectly explain changes in the bacterial community structure and diversity.
5. Conclusions
Overall, urbanization does not directly alter bacterial communities themselves but directly or indirectly affects environmental variables that are responsible for changes in bacterial communities. Urbanization intensity had positive effects on the bacterial diversity in the intermediately disturbed wetlands, but a significantly lower diversity of bacterial communities was observed in the most urbanized areas. Additionally, pH and NH4 +-N were identified as the primary environmental drivers to determine the bacterial community structure and diversity in urban wetlands. As a result, the regional scale might underestimate the true variations in bacterial community structure and diversity, which present a highly context-dependent mode by environmental factors (e.g. soil nutrients) and spacial heterogeneity (rural to urban). Our study thus underlined the importance of 'limiting factor' from environmental factors that affecting wetland bacterial communities along urbanization intensities, which is also important for management and sustainability development.
Acknowledgments
This work was supported by the the Postdoctoral fund of Central South University of Forestry and Technology (45180047), the National Natural Science Foundation of China (U20A2089, 31901118 and 41971152), Hunan Innovative Talent Program (2019RS1062), and the Forestry Science and Technology Innovation Fund, Hunan Province (XLK202108-5). We also thank the anonymous reviewers for their valuable comments.
Data availability statement
The data that support the findings of this study are available upon reasonable request from the authors.