


Abstract
Humid heat impacts a large portion of the world's population that works outdoors. Previous studies have quantified humid heat impacts on labor productivity by relying on exposure response functions that are based on uncontrolled experiments under a limited range of heat and humidity. Here we use the latest empirical model, based on a wider range of temperatures and humidity, for studying the impact of humid heat and recent climate change on labor productivity. We show that globally, humid heat may currently be associated with over 650 billion hours of annual lost labor (148 million full time equivalent jobs lost), 400 billion hours more than previous estimates. These differences in labor loss estimates are comparable to losses caused by the COVID-19 pandemic. Globally, annual heat-induced labor productivity losses are estimated at 2.1 trillion in 2017 PPP$, and in several countries are equivalent to more than 10% of gross domestic product. Over the last four decades, global heat-related labor losses increased by at least 9% (>60 billion hours annually using the new empirical model) highlighting that relatively small changes in climate (<0.5 °C) can have large impacts on global labor and the economy.
Export citation and abstract BibTeX RIS

Original content from this work may be used under the terms of the Creative Commons Attribution 4.0 license. Any further distribution of this work must maintain attribution to the author(s) and the title of the work, journal citation and DOI.
1. Introduction
Increasing temperatures and humidity are prominent mechanisms by which climate change impacts people. High temperatures increase morbidity, mortality (Gasparrini et al 2017, Vicedo-Cabrera et al 2021), and migration (Mueller et al 2014), and can reduce educational outcomes (Garg et al 2020, Park et al 2021), cognitive performance (Masuda et al 2020), and economic output (Burke et al 2015, Carleton and Hsiang 2016). Heat effects vary spatially, with outdoor workers in low- and middle-income countries (LMICs) in the low latitudes facing the greatest exposure to humid heat (Burke et al 2015, Chavaillaz et al 2019, Kjellstrom et al 2019, de Lima et al 2021).
Despite the large body of evidence showing the adverse effects of heat on human health and well-being, estimates of the impact of heat exposure on labor productivity are still being refined (Vanos et al 2020, Dasgupta et al 2021, Foster et al 2021). This is due in part to challenges in accurately estimating heat stress, which can vary due to an individual's behavioral and other adaptive responses and controls, as well as differential exposure to heat based on a worker's location, activities, and occupation (Vanos et al 2020). What is clear, however, is that estimates of labor loss from hot environments are concerning, especially for workers in heavy labor sectors (Watts et al 2021, Romanello et al 2021) (e.g. agriculture, forestry, fisheries, and construction). Field studies of outdoor workers report productivity declines when workers experienced hot and humid work environments (Sahu et al 2013, Sett and Sahu 2014, Masuda et al 2021), with macro-level analyses showing non-linear relationships between temperatures and labor productivity and overall economic production (Burke et al 2015, Parsons 2021). High humid heat is expected to increase labor loss and decrease global gross domestic product (GDP) by up to 4.0% by 2100 (Borg et al 2021).
Recent global estimates by the Lancet Countdown on Health and Climate Change (Watts et al 2021, Romanello et al 2021) (LCHCC)—an international platform tracking impacts of climate change on public health—indicate heat exposure already leads to labor loss of approximately 200 billion hours yr−1 for those engaged in heavy labor in agriculture and construction, with global GDP losses estimated to be $311 billion yr−1 in purchasing power parity-adjusted international dollars (PPP$) (DARA and Climate Vulnerable Forum 2012, Kjellstrom et al 2019). Workers in the agricultural sector have experienced 10–90 times the amount of work hours lost compared to those conducting light (e.g. clerical, service sectors) and moderate (e.g. manufacturing) work. Impacts are largest for agricultural workers in LMICs because these workers tend to conduct labor at high intensities and have limited access to defenses against heat (Coffel et al 2018, Watts et al 2021, Romanello et al 2021).
Recent studies have argued that estimates of labor loss from heat exposure must be refined because they have so far relied on exposure response functions (ERFs) based on uncontrolled experiments under a limited range of heat and humidity (Wyndham 1969, Sahu et al 2013, Kjellstrom et al 2018, Vanos et al 2020, Foster et al 2021), which can vary substantially by latitude and other geophysical factors. The LCHCC, which uses the ERF from Kjellstrom et al (2018), provides an important benchmark of high humid heat impacts on labor. This benchmark is used by national governments, multilaterals, and decision makers interested in advancing public health goals in the face of climate change. However, a new ERF from a controlled laboratory setting (Foster et al 2021) (hereafter 'laboratory ERF') is based on a wider range of heat and humidity and remedies many of the limitations of existing estimates of humid heat impacts on labor loss. This new laboratory ERF provides an opportunity to quantify one of the uncertainties associated with estimates of global labor losses.
Here, we use the latest reanalysis data to calculate hourly humid heat (simplified wet bulb globe temperatures (sWBGTs)) exposure for the last 20 years (2001–2020) to estimate the number of workers exposed to unsafe levels of humid heat and the associated labor impact, as well as the change in labor losses relative to the previous 20 years (1981–2000). Specifically, we quantify the difference in labor loss estimates from the ERF employed in LCHCC and the laboratory ERF using identical climate data, worker statistics, and population data (details in section 2) to demonstrate how much humid heat impacts on labor may be underestimated in existing estimates over these two time periods. For outdoor workers in agriculture, fisheries, forestry, and construction conducting heavy labor, we find labor losses are significantly higher using the laboratory ERF, suggesting a need to better constrain modeled worker responses to humid heat exposure and to increase these workers' resilience to adverse heat effects.
2. Data and methods
2.1. Estimating hourly humid heat from reanalysis data
There are a variety of methods for estimating humid heat exposure (Buzan and Huber 2020, Schwingshackl et al 2021). Here, we use an approximation of WBGT (Yaglou and Minard 1957), an internationally recognized heat stress metric that incorporates temperature and humidity measures and is used in occupational health studies (Lemke and Kjellstrom 2012, American Conference of Governmental Industrial Hygienists 2015, Jacklitsch et al 2016). The advantage of a metric such as WBGT is that it considers both temperature and humidity in relation to heat exposure and heat stress for working individuals. The term 'humid heat' here refers to conditions that are either hot (and dry) or hot and humid enough to cause decreases in labor productivity. Although WBGT has its limitations (Bates and Schneider 2008, Holmér 2010, Dehghan et al 2012, d'Ambrosio Alfano et al 2014), we use sWBGT to estimate humid heat exposure and labor impacts, due to its common use in previous studies (e.g. Watts et al 2018, 2021, Li et al 2020) and the availability of hourly reanalysis data to calculate sWBGT (near-surface air temperature, humidity, and pressure). Following the method of Li et al (2020), we use hourly European Centre for Medium-Range Weather Forecast 5th Generation Reanalysis (ERA5) output (1 January 1981–31 December 2020), including t2m (2 m air temperature), surface pressure (sp), and 2 m dew point temperature (d2m) to calculate sWBGT. ERA5 is provided at ∼31 km spatial resolution; when ERA5 sWBGT and hours lost data are compared to population data, the hours lost data are regridded to the population resolution (∼0.5° × 0.5° spatial resolution) via bilinear interpolation. The sWBGT metric used here assumes no solar radiation and is intended to estimate humid heat exposure in the shade or indoors with no air conditioning (Li et al 2020). WBGT may underestimate the impacts of heat in high humidity environments (d'Ambrosio Alfano et al 2014), and sWBGT in the sun can be at least 2 °C–3 °C higher than shade values (Kjellstrom et al 2013), so our estimates of productivity losses from heat exposure are conservative. Estimating global impacts of humid heat on labor using ERFs with global gridded data represents one method for investigating, at a large scale, the potential impacts of warming on workers.
2.2. Humid heat impacts on labor productivity
2.2.1. Calculating per capita labor losses
Following Kjellstrom et al (2018), we examine work losses in the 12 h workday by calculating the daily mean sWBGT, daily maximum sWBGT, and the halfway point between these two values and assume 4 h is spent near each of these values in the 12 h work day (4 × sWBGT max + 4 × sWBGT mean + 4 × sWBGT half). The theoretical annual maximum work loss per person in the 12 h workday is 4380 h yr−1 (12 h d−1, 365 days yr−1); this assumption is slightly different than the Kjellstrom et al (2018) and LCHCC method (Watts et al 2021), which uses a 30 day month (i.e. 4320 potential work hours). We estimate hourly losses for each year 1981–2020 and average the hourly losses to calculate the mean per capita hours lost over the 1981–2000 and 2001–2020 time periods, respectively, to estimate mean changes in labor loss between these two time periods. Uncertainty (±) in section 3.1 is reported as the standard deviation of annual labor losses 2001–2020. Shading in zonal mean in figures shows the maximum and minimum zonal values across all years (2001–2020) to illustrate the spread of year-to-year variability in the per capita and population-weighted labor losses.
2.2.2. Calculating population-weighted labor losses
Here we define 'population-weighted' labor losses as the product of spatially gridded, per capita work loss (due to environmental exposure and assumed heavy labor intensity) and spatially gridded, working-age population. To calculate population-weighted labor impacts from per capita losses, we (a) regrid the spatially explicit annual 12 h workday per capita losses (1981–2000 mean and 2001–2020 mean) to the population spatial grid structure (0.5° × 0.5°), (b) overlay the regridded work hours lost information onto spatially explicit working-age population (ages 15+ data) from the year 2017 from the Gridded Population of the World, version 4 (GPWv4) (Center for International Earth Science Information Network 2018), and (c) within each country's borders, multiply working-age population-weighted hours lost by the fraction of the working-age population in agriculture/forestry/fishery and construction sectors (table S1 (available online at stacks.iop.org/ERL/17/014050/mmedia), downloaded from the ILOSTAT database on 17 July 2020). We assume a 12 h workday and 365 days of work to maintain consistency with our assumptions about total possible work hours lost in a year. We assume population and worker statistics are fixed at their 2017 values to isolate the impact of changes in background temperatures and heat exposure.
2.2.3. Calculating productivity losses
To estimate the monetary value of productivity losses from humid heat, we multiply the full time-equivalent (FTE) work hour loss in each of our two heavy labor sectors (agriculture, forestry and fisheries; construction) by the average value added per worker in each sector. To calculate FTE work hour losses, we divide the hours lost per year by the total possible work hours in a year (4380; see section 2.2.2). For each country, we calculate average value added per worker in agriculture, forestry and fisheries by dividing total value added in 2017 (in current local currency units (LCUs); World Bank (WB) data product 2021b ID: NV.AGR.TOTL.CN) in agriculture, forestry and fisheries by total, working-age employment in agriculture, forestry and fisheries. Because the WB does not report value added in construction, we instead use the value-added data for 'industry (incl. construction)', and calculate average worker productivity in each country by dividing total value added in 2017 in industry (including construction) (ID: NV.IND.TOTL.CN) by total employment in industry. For each country, we calculate total employment in agriculture, forestry and fisheries and in industry, respectively, as the product of total population (ID: API_SP.POP.TOTL), percent of total population ages 15–64 (ID: API_SP.POP.1564.TO.ZS), percent of employed population ages 15+ (ID: API_SL.EMP.TOTL.SP.ZS), and percent of employed population ages 15+ in agriculture, forestry and fisheries (ID: API_SL.AGR.EMPL.ZS), and in industry including construction (ID: API_SL.IND.EMPL.ZS), respectively. We convert from current 2017 LCU to 2017 PPP$ by dividing a country's LCU by its GDP 2017 PPP conversion rate (LCU per USD) (The World Bank 2021a). We sum value added losses over all countries to obtain the estimated global productivity loss.
Note that our estimates are not directly comparable to several other estimates of climate-related economic impacts (Burke et al 2015, Howard and Sterner 2017, International Monetary Fund 2017, Pindyck 2019, Neumann et al 2020) that include various combinations of other damages in addition to labor productivity losses, such as increased mortality (Green et al 2019, Lee et al 2019, Neumann et al 2020), infrastructure damages (Neumann et al 2020), reductions in livestock and crop productivity (Hsiang et al 2017, Zhao et al 2017, Asseng et al 2021) and fisheries (Thiault et al 2019, Neumann et al 2020), increased electricity consumption (Hsiang et al 2017, Biardeau et al 2020, Neumann et al 2020), or damages to environmental amenities (Howard and Sterner 2017, Drupp and Hänsel 2021) not captured in output statistics but quantifiable in monetary terms; though none include damages from increases in heat-related morbidity (Green et al 2019) in the form of increased healthcare expenses (Borg et al 2021) or non-market health damages from pain and suffering (Alberini and Krupnick 2000) caused by heat-related stress (Li et al 2020).
2.3. ERFs
We compare labor productivity loss (also called 'labor loss' or 'physical work capacity' loss) estimates using two methods: the LCHCC method (Watts et al 2021, 2018, Romanello et al 2021) and Foster et al (2021) (laboratory ERF). Figure S1 shows the fraction of work capacity lost as a function of WBGT for each ERF. The LCHCC exposure response relationship is based on epidemiological data to derive the fraction of work lost for a given hourly value of WBGT (Watts et al 2018, 2021), whereas the Foster et al (2021) ERF is derived from measurements of reduced human physical work capacity in a controlled laboratory environment. Although both ERFs provide estimates of work capacity or productivity losses due to humid heat exposure, neither study is based on a globally representative sample of agriculture and construction workers (details below). Nonetheless, use of a single ERF (i.e. the LCHCC ERF), to estimate global labor losses is a common practice in several prominent publications (Watts et al 2018, 2021, Kjellstrom et al 2018, Orlov et al 2020).
The LCHCC method employs estimated exposure response relationships for reduced hourly work capacity (labor productivity) for heavy manual labor conducted at 400 watt (W) intensity using a cumulative normal (ERF) function. This ERF is based on two studies of heat exposure and productivity in outdoor workers: one of Indian rice harvesters (Sahu et al 2013), and the other of African miners (Wyndham 1969). The Kjellstrom et al (2018) ERF employed in 2018 LCHCC begins to show work loss at WBGT greater than ∼23 °C (figure S1). Previous work (Watts et al 2021, Kjellstrom et al 2018) has assumed labor loss cutoffs of 10% and 90% of the hour (i.e. WBGT causing labor productivity losses <6 min h−1 were counted as 'zero productivity loss', and losses >54 min h−1 were 'capped' at 54 min). However, we use the approach employed in the 2020 LCHCC (Watts et al 2021) and 2021 LCHCC (Romanello et al 2021) that assumes no work loss cutoffs at 10% and 90% of work capacity. Although humid heat exposure can impact workers conducting light (e.g. services) and medium (e.g. manufacturing) labor, here we only consider heavy labor impacts because heavy labor losses account for the largest fraction of labor loss from humid heat exposure (Watts et al 2018, 2021, Romanello et al 2021).
We compare estimates of labor losses from humid heat using the 2020 and 2021 LCHCC (Watts et al 2021, Romanello et al 2021) ERF to the Foster et al (2021) ERF, which is derived from measurements of reduced human physical work capacity in a range of controlled heat and humidity relative to a cool environment. Whereas the LCHCC ERF is not based on data above WBGT of ∼34 °C, the laboratory ERF does include measurements of work capacity up to WBGT of 40 °C. The Foster et al (2021) method yields estimates of reduced work capacity at much lower humid heat than the LCHCC method, with ∼10% reduced work capacity at WBGT of 18 °C (figure S1). This lower threshold for reduced work capacity has been reported in other studies, such as in Deryugina and Hsiang (2014), who found that county-level earnings in the United States began to decline at a temperature threshold of ∼15 °C. Limitations of the Foster et al WBGT-Physical Work Capacity (PWC) relationship include that the study used young, healthy, fit British participants who were not acclimatized to heat. However, as discussed in Foster et al (2021), acclimatization to heat is less critical in fit individuals. Further discussion of the specific methods and limitations can be found in Foster et al (2021).
3. Results
3.1. Global differences in labor loss estimates
Between 2001 and 2020, exposure to high humid heat is associated with approximately 677 billion hours of lost labor per year (±30 billion hours yr−1; figure 1), with 72% of the global working-age population (∼4 billion people) living in locations with background climate conditions that would cause heavy labor losses of at least 100 h person−1 yr−1 (figure S2). Previous estimates (using the LCHCC ERF) indicate that labor loss due to humid heat exposure was approximately 248 billion hours yr−1 (±24 billion hours yr−1), with 40% of the global working-age population (∼2.2 billion people) living in locations with heavy labor losses over 100 h person−1 yr−1. Using the laboratory ERF, estimates of labor loss for workers in heavy labor sectors are approximately 2.7 times as high as estimates from the LCHCC ERF (figure 1(a) and (b); table S1).
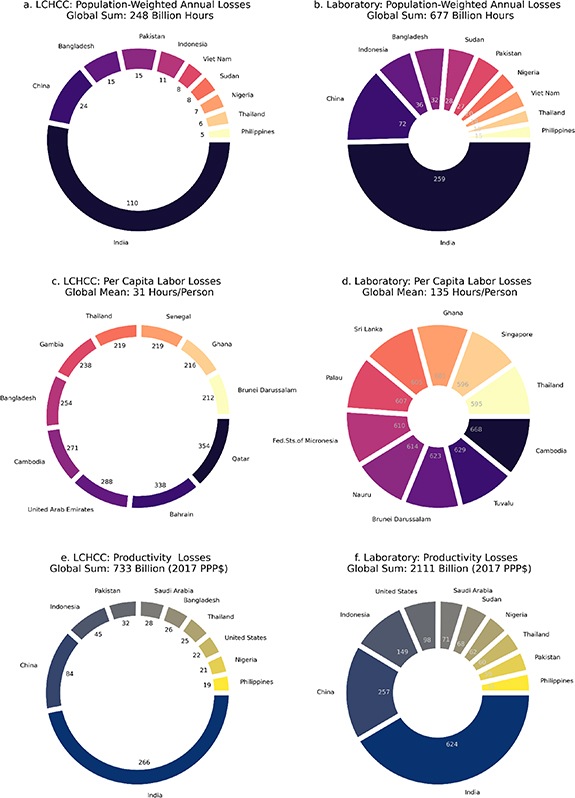
Figure 1. Countries with the largest labor and productivity losses. Mean (2001–2020) population-weighted annual labor losses (a) and (b), per capita annual labor losses (c) and (d), and annual productivity losses (e) and (f) due to humid heat exposure using the Lancet Countdown ('LCHCC', (a), (c), (e)) and laboratory exposure response to heat ('Laboratory', (b), (d), (f)). Numbers around the edge of the inner ring show losses for the ten most impacted countries. The number above each panel shows the global sum in billions of h yr−1 (a) and (b), unweighted mean across all countries in h person−1 yr−1 (c) and (d) for countries for which the data are available (table S1), and global sum of productivity losses (2017 PPP$)/year (e) and (f). Thickness of rings scales linearly with the global sum or mean. 'Population-weighted' labor loss is defined as the product of the mean per-capita hours lost and the working-age population (ages 15+) in heavy labor sectors.
Download figure:
Standard image High-resolution image3.2. Geographic differences in labor loss estimates
Figure 2(a)–(c) shows the spatial distribution of per capita labor losses (h person−1 yr−1) due to humid heat exposure in the recent past using the LCHCC and the laboratory ERFs, respectively. In both global maps, large portions of the tropics have experienced major labor losses (>100 h person−1 yr−1, or >8 days person−1 yr−1), which is consistent with the hot and humid climate in this region. However, the laboratory ERF-based estimates show maximum labor losses upwards of 600 h person−1 yr−1 (>50 days person−1 yr−1) compared to <250 h person−1 yr−1 (<21 days person−1 yr−1) reported in the LCHCC (figure 1(c), (d) and 2). Additionally, laboratory ERF-based estimates show that labor losses extend to the mid-latitudes, with many locations in this region (e.g. southern and eastern continental United States) experiencing labor losses >100 h person−1 yr−1 (>8 days person−1 yr−1). Using the LCHCC ERF, losses of this magnitude are only seen in the worst-impacted areas in the tropics and South and Southwest Asia (figure 1(c)).
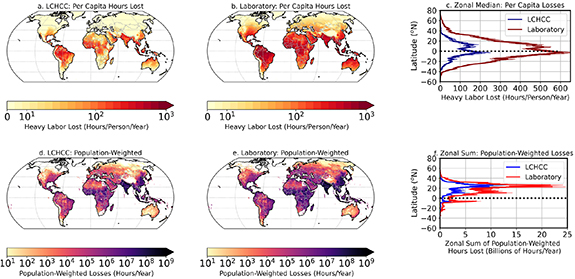
Figure 2. Spatial extent of heavy labor losses due to humid heat. Per capita heavy labor lost (a)–(c) and population-weighted heavy labor lost (d)–(f) for the Lancet Countdown method ('LCHCC', (a), (d)) and the laboratory exposure response to heat ('Laboratory', (b), (e)). Panels on right show the zonal median (c) and zonal sums (f) of heavy labor losses. Maps in the top row show mean h person−1 yr−1 lost due to background heat and humidity combined with internal heat generation in individuals conducting heavy labor. Maps in the bottom row display 'population-weighted' labor loss, which is defined as the product of the mean per-capita hours lost overlaid and the ILO heavy labor sector proportion of the working-age population (ages 15+) for 163 countries for which the data are available (table S1). Shading around zonal median (top right) and zonal sum (bottom right) lines outlines the range of zonal values for individual years.
Download figure:
Standard image High-resolution image3.3. Country-level differences in labor losses
Estimates of humid heat impacts also show significant country-level changes when using the LCHCC as opposed to the laboratory ERF. India, China, and Indonesia saw the largest differences, with approximately 149 billion, 49 billion, and 25 billion hours yr−1 difference, respectively (table S1). Over 40 countries saw a difference of at least 1 billion hours yr−1. However, when examining differences as a proportion of LCHCC, differences may be several orders of magnitude higher, with multiple high-latitude countries showing labor losses using the laboratory ERF that experienced almost no labor losses using the LCHCC ERF (table S1). Nearly all countries showed at least 100% higher estimates using the laboratory method. Just four countries (United Arab Emirates, Pakistan, Qatar, and Bahrain) saw <100% changes in labor loss between the estimates, and no countries showed declines in labor loss. In the locations with smaller labor loss changes, humid heat already reaches unsafe thresholds for continuous labor regardless of the employed ERF.
Labor losses weighted by the working-age population engaged in outdoor labor (section 2) are highest in South, East, and Southeast Asia (figure 2(d)–(f)), where there are large numbers of working-age people (figure S3) working in agriculture (table S1). Specifically, labor losses are most pronounced in India, which accounts for almost half of the global total losses and experienced over four times the labor losses of the second most impacted country, China (figure 1(a) and (b)).
Some coastal and island nations in Southeast Asia (e.g. Cambodia) and the western Pacific (e.g. Tuvalu) saw up to seven to eight weeks person−1 yr−1 of labor loss (figure S4), and humid heat contributed to at least four weeks person−1 yr−1 of labor loss in 87 countries (table S1). Many low-latitude, coastal or island nations (e.g. Tuvalu) with the largest annual per capita labor losses according to the laboratory ERF experience minimally seasonal climates. In these tropical locations, the minimum sWBGT remains above 17 °C (figure S5), the sWBGT at which the laboratory ERF shows noticeable losses (figure S1). Therefore, the laboratory ERF indicates the mean climate is already warm enough to create decreases in labor productivity throughout much of the year across a large swath of the tropics. By contrast, the coolest months of the year are still below the minimum sWBGT (23 °C) that causes noticeable labor losses using the LCHCC ERF. According to the LCHCC ERF, the largest per capita labor losses are experienced in locations with seasonally hot (and potentially humid) climates (figures 1(c) and S4). In these locations (e.g. Qatar, Bahrain, Bangladesh), the LCHCC ERF indicates the warm season sWBGT would cause relatively large labor productivity losses, but the cool season does not experience sWBGT high enough to cause noticeable labor losses (figure S5).
Per capita working-age population labor loss translates to a job-equivalent loss (section 2) of 155 million jobs globally per year (98 million more than LCHCC), with India accounting for nearly half of this loss (equivalent to approximately 62 million jobs lost). These annual losses are comparable to temporary work loss during the global COVID-19 lockdowns, which are estimated to have caused workhour losses equivalent to approximately 130 million full-time jobs in the first quarter of the pandemic (ILO 2020a). The impacts from high humid heat we report here exceed or are comparable to those caused by other pressing environmental health challenges, such as air pollution, which in 2016 caused 1.2 billion lost working days (OECD 2016), or lack of safe drinking water and sanitation, which was projected to cause an estimated 22 billion lost work days in 2015 (Hutton and Haller 2004).
3.4. Country-level differences in productivity losses
These labor losses translate to significant economic costs (section 2). Annually, the humid heat-related global labor loss results in lost productivity (figure 1(e) and (f)) of approximately 2.1 trillion in 2017 PPP$ (±98 billion 2017 PPP$) using the laboratory ERF, nearly three times as high as the impacts that result when using the LCHCC ERF (733 billion 2017 PPP$, ±72 billion 2017 PPP$). Impacts also vary significantly by country, with China and India again experiencing the largest losses, and Indonesia and the United States showing over 90 billion PPP$ losses per year. To put this in perspective, India experiences annual productivity losses from high humid heat equivalent to almost 7% of its 2017 GDP. Humid heat impacts on labor cause productivity losses equivalent to >10% of GDP in several countries in tropical Africa, such as Sudan and Sierra Leone (figure S6 and table S2).
3.5. Changes in labor and productivity losses over time
We also compare recent labor losses (2001–2020 mean; figure S7(d)–(f)) to losses at the end of the 20th century (1981–2000 mean; figure S7(a)–(c)). Here we use 2017 population and worker statistics for both time periods to focus on the impacts of climate. Over this time period, global-mean, near-surface air temperatures have increased by ∼0.4 °C (Lenssen et al 2019), resulting in increases in per capita labor losses of up to 150 h person−1 yr−1 (12.5 days person−1 yr−1) in some low-latitude locations for both ERFs (figure 3(a) and (b)). However, median increases in labor losses across all latitudes are typically higher for the laboratory ERF, peaking near the equator and 10°–20° N (figure 3(c)). These changes in labor losses over the last several decades have also resulted in large increases in global and country-level population-weighted labor losses, per capita losses, and associated decreases in production that impact the economy (figure S8). Specifically, both ERFs show increases in population-weighted global labor productivity losses of at least 9% between the two time periods (LCHCC: increase of 39 billion lost hours, laboratory: increase of 58 billion lost hours). Both ERFs also show increases in productivity losses of at least 100 billion (2017 PPP$), with the laboratory ERF showing an increase in global losses of 192 billion (2017 PPP$).

Figure 3. Change in mean per capita heavy labor losses (h person−1 yr−1) due to humid heat between the 1981–2000 time period and the 2001–2020 time period. Change in per capita labor losses for the Lancet Countdown method ('LCHCC', (a)) and the laboratory exposure response to heat ('Laboratory', (b)). The panel on the right (c) shows the zonal median of change in heavy labor losses over land.
Download figure:
Standard image High-resolution image
4. Discussion and conclusions
The scale and distribution of the impacts of humid heat on labor loss indicate significant risks to the resilience and well-being of outdoor workers, as well as the families that rely on these workers for their livelihood. The ability of workers to earn incomes in safe work environments is important for tackling global poverty, addressing household climate resilience, and for national economic development.
Our economic loss estimates represent humid heat-related productivity losses that, barring adaptation of production processes, translate into equivalent reductions in the value of marketed output (GDP). Our estimate of humid heat-related productivity losses is equivalent to 1.7% of global GDP in 2017 (when global GDP was 121.9 trillion in 2017 PPP$; The World Bank 2021b). This estimate substantially exceeds the existing humid heat-related global labor productivity loss estimate of 311 billion (2010 PPP$) for 2010 (∼0.5% of GDP) and approaches a previous loss estimate for 2030 of 2.4–2.5 trillion (2010 PPP$; 2.2% of GDP) (Kjellstrom et al 2019, Borg et al 2021). This difference is not surprising since those existing estimates are based on the same ERF used in LCHCC. Importantly, the ILO 2030 estimate (Kjellstrom et al 2019) is based on Representative Concentration Pathway (RCP2.6) that assumes temperature increases by 2100 of no more than 1.5 °C above pre-industrial conditions, which in early 2020 already was well below actual global emissions (Schwalm et al 2020) and temperature trajectories (Sherwood et al 2020). Additionally, differences among results presented here and previous estimates are amplified by the assumption in the ILO report that no work is lost when workers are exposed to humid heat causing less than 6 min h−1 losses (Kjellstrom et al 2019).
Our labor loss estimates are limited to workers in agriculture, fisheries, forestry, and construction, but these sectors represent a significant proportion of the overall workforce in many regions, with approximately 69% of workers in low-income countries working in agricultural and other primary-sector occupations (ILO 2020b). Many of these workers already face challenges such as employment that lacks basic social protections, or lack of adequate health and safety policies (Packard et al 2019). Absent basic protections and workplace adaptations, workers may be forced to adopt new livelihood strategies. Future work should quantify the impacts of high humid heat on other sectors of the economy, as adaptation to humid heat can vary substantially and have different implications for work loss, health, and well-being.
Our estimates do not incorporate adaptations that people across the world make every day, which can change the impacts of humid heat. Workplace adaptations include moving the time of work to cooler hours of the day (Morabito et al 2006, Takakura et al 2018, Masuda et al 2019, Parsons et al 2021), increased access to water, rest breaks, education and training on protection from heat stress, changing work pace, movement of labor intensive tasks to cooler hours, and mechanization (Spector et al 2019). However, adaptation mechanisms such as movement of the timing of work to the early morning hours or night will be highly context specific, and may be impractical given competing hazards and health risks such as sleep disruption and associated increased risk of injuries (Zhu et al 2014, Graves and Miller 2015), lack of lighting, childcare needs, and other community impacts. Additionally, this adaptation mechanism is expected to lose effectiveness as the globe warms (Parsons et al 2021).
Our results are consistent with both station-based and reanalysis-based studies that have found that climate conditions in much of the tropics and subtropics are already exceeding thresholds for human safety (Li et al 2020, Raymond et al 2020). Furthermore, isolated field-based studies of outdoor laborers in the tropics also indicate these workers are already being forced to adapt to work in uncomfortably hot conditions (Mani et al 2018, Masuda et al 2019), which can be exacerbated by changes to the local environment such as forest cover loss (Wolff et al 2018, Wolff et al 2021, Suter et al 2019, Masuda et al 2019, Masuda et al 2020, Masuda et al 2021, Vargas Zeppetello et al 2020, Parsons et al 2021). However, although reanalysis-based estimates of heat exposure and associated global labor productivity losses approach hundreds of billions of hours lost per year, there are only a handful of field-based studies that quantify work time lost due to working in hot and humid environments (e.g. Mani et al 2018, Masuda et al 2019) and how workers are responding to working in hot and humid environments (Ioannou et al 2017, Masuda et al 2019, 2021). Isolated studies have documented that agricultural workers often start work early in the day and continue until approximately midday or mid-afternoon, depending on the location and work environment (e.g. Morabito et al 2006, Sahu et al 2013, Ioannou et al 2017, Masuda et al 2019), but more field observations are needed to verify the findings presented here and elsewhere (e.g. Watts et al 2021, Romanello et al 2021).
Although the results presented here reinforce findings of previous work that high humid heat is already adversely impacting working populations via labor loss (Chavaillaz et al 2019, Orlov et al 2020, Watts et al 2021, Romanello et al 2021) our estimates suggest that high humid heat may be having a greater impact on outdoor workers than previously estimated. Our study also underscores the importance of research that refines ERFs and reconciles differences between laboratory and field-based studies, as refinements can lead to dramatically different results. For example, recent work by Dasgupta et al (2021) uses relationships among temperature, WBGT, and labor from International Public Use Microdata Series-International to derive region-specific relationships among temperatures and labor supply. Advancing this area of work is critical for policy and practice: estimating how warming is impacting working populations can help establish policy priorities for climate change adaptation, as well as supporting mitigation actions by providing estimates of the cost of inaction. However, regardless of the ERF employed here, our analysis suggests that global warming of about 0.4 °C since the late 20th century (Lenssen et al 2019) has already caused large-scale increases in lost global labor productivity (e.g. Watts et al 2021, Romanello et al 2021), with many of these increases in losses felt most strongly in low-latitude regions (figure 3). These findings emphasize the importance of limiting warming because even fractions of a degree of global climate change can have large-scale implications for labor. National governments, multilateral and philanthropic institutions, and others are increasingly aware that climate change disproportionately impacts certain populations, and our results highlight the need for greater and more rapid investments and support for climate change mitigation, resilience, and adaptation.
Acknowledgments
L A P and D S acknowledge NASA GISS Grant Number 80NSSC19M0138 for funding support. This work contains modified Copernicus Climate Change Service Information (ERA5 data).
Data availability statement
ERA5 hourly data on single levels from 1979 to present are available at: doi:10.24381/cds.adbb2d47. ILO data can be found at: https://ilostat.ilo.org/. World Bank data can be found at: https://data.worldbank.org/indicator?tab=all. GPW population data can be found at: https://sedac.ciesin.columbia.edu/data/collection/gpw-v4. Python scripts to calculate hourly sWBGT from ERA5 data (from Li et al 2020) are posted on GitHub (https://github.com/dw-li/WBGT).
The data that support the findings of this study are openly available on Zenodo at the following URL/DOI: doi:10.5281/zenodo.5768042. Python scripts used to generate figures and statistics are posted on GitHub (https://github.com/LukeAParsons/erfs_comparison) and are also available from the corresponding author upon request.
Conflict of interest
The authors declare no competing interest.