

Abstract
There is strong evidence that wood-based products are typically associated with lower fossil-based emissions over their lifecycle than functionally equivalent products made from other materials. However, the potential impact of large-scale material substitution at the market level remains challenging to quantify and is subject to assumptions and system boundary considerations. This paper presents a systematic review covering 44 peer-reviewed studies that quantify the substitution impacts of wood use at the level of a region or sector, to assess the commonalities and differences in scopes, system boundaries and key assumptions. We estimated the average and range of market-level substitution impacts and identify the caveats and knowledge gaps for such assessments. The results indicate an average substitution factor of 0.55 tonnes of fossil C avoided per tonne of C contained in wood harvested, with a range of 0.27–1.16 tC/tC for baseline scenarios covering all wood flows. This value depicts the average efficiency of avoided fossil emissions per unit of wood used for a certain wood use structure based on published studies but is of limited practical use as it is strictly context specific. A direct comparison between studies is complicated because a notable proportion of the studies provided insufficient information to estimate substitution factors or were not transparent in their assumptions, such as specifying which wood product is assumed to substitute for which non-wood product. A growing number of studies focus on policy-relevant analyses of the climate change mitigation potential associated with marginal changes in wood use, but market dynamics are generally considered to a limited extent. To further support decision-making, future studies could focus on changes in those end uses where increased substitution impacts could realistically be expected, while considering the various market dynamics and uncertainties.
Export citation and abstract BibTeX RIS

Original content from this work may be used under the terms of the Creative Commons Attribution 4.0 license. Any further distribution of this work must maintain attribution to the author(s) and the title of the work, journal citation and DOI.
1. Introduction
The potential of forests and the forest sector to mitigate climate change has been widely recognised (Nabuurs et al 2007, Griscom et al 2017, IPCC 2019a). Mitigation of climate change refers to a human intervention to reduce emissions or enhance the sinks of greenhouse gases (IPCC 2019b). The mitigation potential of forests and the forest sector can be realised through several measures, including increasing the forest area, managing existing forests to enhance forest carbon sinks, or reducing deforestation or soil degradation (Roe et al 2019). Additionally, the net emissions of the forest sector may be reduced by increasing the carbon storage in wood-based products or through the material and energy substitution impacts arising from wood use (Nabuurs et al 2007). However, this depends on the balance between biogenic and fossil emissions in the ecosystem and technosystem in desired timeframes in comparison to a baseline, i.e. the reduction in forest carbon stock caused by harvesting, and the time by which the reduction is compensated for by the recovered forest carbon stock, the avoided fossil emissions and the carbon stored in products (Grassi et al 2018). This review focuses exclusively on the substitution impacts of wood use because it remains one of the most uncertain components in determining the overall climate impacts of the forest sector (Lemprière et al 2013, Harmon 2019).
The system boundaries of the analysis are illustrated in figure 1, and include 'crade to grave' fossil emissions for wood and non-wood products, but do not include biogenic emissions and removals. We exclude the carbon storage effect of wood products from our analysis, because there are established practices for estimating this impact for national greenhouse gas (GHG) inventories (Rüter et al 2019). We also exclude studies that focus solely on bioenergy, due to the larger body of literature concerning forest bioenergy, as compared to material uses of wood, and due to having been subject to a number of previous reviews (e.g. Mitchell et al 2012, Matthews et al 2014, Geng et al 2017, Birdsey et al 2018, Cowie et al 2021). The avoided fossil emissions related to bioenergy are more straightforward to estimate compared to material uses of wood, if we ignore the broader systemic impacts, such as indirect land use changes, biophysical impacts, and the associated carbon parity times (Birdsey et al 2018). As the Intergovernmental Panel on Climate Change (IPCC) has clear methodological guidance on calculating the emissions of the energy sector, including wood-based fuels, the uncertainties regarding substitution relate mostly to the definition of the reference energy carriers.
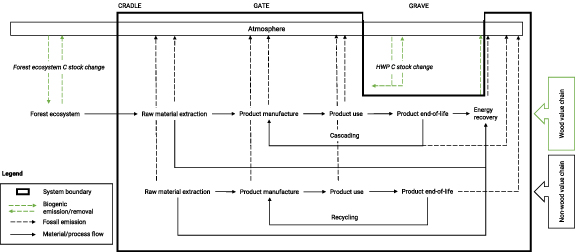
Figure 1. System boundaries covered by the review, using construction as an example of the end uses of wood products.
Download figure:
Standard image High-resolution imageWood can be used for numerous products and applications, such as construction, energy, furniture, packaging, hygiene, and graphical paper. As products can be made from alternative materials, wood-based products and the alternative products are substitute products, defined as products that provide interchangeable value or service in terms of economic utility or technical function. There is strong evidence that, on the product level, wood-based products are, on average, associated with lower fossil-based GHG emissions than non-wood products or energy carriers (Sathre and O'Connor 2010, Geng et al 2017, Leskinen et al 2018). Substitution impacts refer to the amount of fossil emissions avoided when wood-based products or energy are used in place of alternative products or energy carriers. The emissions are determined over their lifecycle, covering processing and manufacturing from material extraction to factory gate incl. transportation, product use lifetime, possible cascading (reuse, recycling, downcycling), and end-of-life (energy recovery or landfilling). Substitution impacts are typically expressed per unit of wood and measured by a displacement factor (DF), which expresses the amount of fossil emissions avoided by the use of one unit of wood products in a specific end use (Sathre and O'Connor 2010, Leskinen et al 2018). This factor is often interchangeably referred to as 'substitution factor' or 'displacement factor' (DF), and we use the latter as it appears to be more established.
The DF can be used to estimate the avoided fossil emissions associated with a marginal change in wood use (a change in wood use compared to baseline) in the context of climate change mitigation analyses, when comparing the net GHG emissions of a mitigation scenario to those of a baseline (synonym to reference or counterfactual) scenario. However, some studies report also estimates for avoided fossil emissions for overall wood flows, and not marginal changes. In this review, we make no distinction, whether the substitution impacts are estimated for mitigation or for other purposes and used all available information. Thus, the values presented in the review ought not to be interpreted as mitigation efficiency, but only as the efficiency of avoided fossil emissions for a certain wood use structure in comparison to a varying baseline and in varying contexts.
According to Gustavsson and Sathre (2011), material substitution can be analysed at the micro-level by examining the marginal change between individual products or processes, and at the meso-level by examining structural changes in society's production and consumption patterns, i.e. between industries or sectors of the economy. Analyses at the macro-level examine the macroeconomic and landscape implications of wood-based substitution, where it becomes necessary to analyse the overall systemic impacts of wood use and interdependencies with other GHG flows and direct and indirect market responses. The broader scope invariably leads to a greater number of factors affecting the system, making the task more complex. In this review, we use the term 'upscaling' to refer to the process of aggregating the substitution impact estimates of single wood-based products (or functional units) and the related product-specific DFs to cover an entire market, i.e. sector or region.
Systematic reviews of material substitution impacts have quantified the variance in DFs at a product level (Sathre and O'Connor 2010, Geng et al 2017, Leskinen et al 2018, Myllyviita et al 2021). However, there are no established practices for the use of product-level DFs when upscaling the substitution impacts to cover an entire market, and recent literature indicates the existence of many complexities related to upscaling (e.g. Harmon 2019, Howard et al 2021). As noted by Geng et al (2017) and Leskinen et al (2018), the great diversity in system boundaries (which define the processes that are included in the emissions estimates), baselines, substitution scenarios, and study periods can lead to large differences in substitution impacts. Moreover, the results of different studies are not easy to compare because there are significant differences in assumptions (Suter et al 2017, Leskinen et al 2018). Thus, there is a need to identify best practices for upscaling substitution impacts at the market level as well as pinpointing gaps and possible caveats. Additionally, quantifying the impacts of an expanding bioeconomy that substitutes for fossil-based resources requires a systematic review of the methods and results of market-level substitution impacts of wood use.
In this review, we address the following research questions:
- How are studies on market-level substitution impacts distributed across regional, sectoral, and temporal scopes?
- What are the commonalities and differences in system boundaries and key assumptions across the studies that upscale substitution impacts to the market level?
- What are the average and range of substitution impacts estimated at the market level, and how do they vary with the assumptions and system boundaries applied by the studies?
- What caveats and knowledge gaps emerge for the upscaling approaches and assumptions?
The main emphasis of the analysis is on calculating the average and range of substitution impacts, and comparing them to the reported scopes, assumptions, and system boundaries, as well as identifying uncertainties and knowledge gaps. This allows us to explore the best practices for upscaling substitution impact estimates at the market level and draw implications for policy and research on how to improve the validity and reliability of the substitution impact estimates.
2. Material and methods
2.1. Data collection
A systematic review of peer-reviewed literature focused on the market-level substitution impacts of material wood use was carried out. The material collection adhered to the principles of the Preferred Reporting Items for Systematic Reviews and Meta-Analyses (PRISMA) approach for systematic reviews (Moher et al 2009). PRISMA is a checklist of 27 reporting items and a four-phase flow diagram intended to improve the quality of systematic reviews and meta-analyses (Moher et al 2009). For example, the methods section should contain a description of the search strategy that is detailed enough to allow for replication (Moher et al 2009). The sample covers peer-reviewed research articles published in English in scientific journals up to the year 2020 and excludes grey literature (e.g. Rüter et al 2016, Holmgren 2020).
The sample was gathered in four phases. First, queries with relevant keywords identified based on key literature were conducted in Scopus in April 2020 and in March 2021. A few iterations of relevant keyword combinations were tested, and additional search words were added one by one to obtain a manageable number of abstracts to evaluate. The optimal search query was considered to be 'substitution AND (wood OR timber) AND (climate OR carbon OR greenhouse)' in the abstract, title and keyword fields, which returned fewer than 500 hits and a relatively high percentage of relevant hits. Second, irrelevant articles, e.g. those unrelated to avoided emissions or solely focused on bioenergy, were excluded based on the title or the abstract. A total of 62 articles were selected for closer examination. Third, after skimming through the articles to assess their eligibility, those not complying with the inclusion criteria (described below) were excluded. Altogether, 34 studies from the initial sample were included in the final sample. Fourth, studies found with other means than the systematic search, mainly studies cited in the initial sample but not appearing in the search results in Scopus, were subjected to the same screening procedure. This final step added ten articles, for a total of 44 articles included in the final sample, containing a total of 156 scenarios.
The first and main criterion for including an article was that it contained sufficient data to estimate an average substitution factor for a market (i.e. an entire product sector or a region), so that we could compare market-level substitution impacts across widely varying scopes and contexts. If these data were not available in the article or the supplementary material (available online at stacks.iop.org/ERL/16/123004/mmedia), due to e.g. using different metrics (e.g. radiative forcing) or reporting the substitution impacts only in figures or as aggregated to the net climate impact of forests, the corresponding authors of these studies were contacted with a request to provide these disaggregated data. If the corresponding author could not be reached or did not reply, the study was excluded from the sample. Due to our focus on market-level substitution impacts, we targeted studies with a global, international, national, and sub-national focus, but excluded stand level studies.
The second inclusion criterion was the consideration of material uses of wood, which excluded studies that considered only bioenergy. We thus focused on studies covering entire markets (regions or sectors), which includes bioenergy as an individual end use, as a by-product of harvesting and manufacturing, or as a post-consumer treatment.
After identifying the studies to be included in our sample, we extracted relevant data from each study. We used a review matrix to disaggregate the scopes, assumptions, and system boundaries of the studies (see table A1). We considered the regional, sectoral, and temporal scopes, scenario types and descriptions, product lifecycle stages, separation of biogenic and fossil emissions, disaggregation of upstream wood flows and end use markets, disaggregation of substitution assumptions, data sources, and other system boundaries. If an entry remained unclear after reading the paper and the possible supplementary material, it was coded explicitly as 'unclear', 'not reported', or similar, depending on the context.
All authors participated in the collection of data in a common review spreadsheet. A definition for each variable was introduced and agreed upon among the authors prior to collection, and the template was iterated into its final form during the review of the first few articles. A few studies were tabulated by more than one author to test for intercoder reliability. The entries were found to be only slightly different, and the authors agreed on common formulations after discussing the minor differences. After collecting all data, the corresponding author went through the entries to check for inconsistencies and discussed potential sources of bias with the co-authors.
2.2. Data analysis
After extracting all data to the review spreadsheet, the entries were coded into relevant categories to facilitate the calculation of distributions and conducting of comparisons. The categories and their explanations are presented in table A1 and in the supplementary online material.
The mean and range of average DFs were extracted or calculated for each scenario, which allowed us to compare them by scope, assumptions, and system boundary category. The product-level DFp was defined as:
where GHG alternative and GHG wood are the fossil GHG emissions resulting from the use of the non-wood and wood designs, respectively, expressed in mass units of carbon (C) derived from CO2 equivalents over a timeframe of 100 years, and WU wood and WU alternative are the amounts of wood used in the wood and non-wood designs, respectively, expressed in mass units of C contained in the wood product (Sathre and O'Connor 2010). A positive value of DFp represents reduced fossil GHG emissions when an alternative product is replaced by a wood-based product, while a negative value represents increased fossil GHG emissions.
Based on the DFp, the average DF for a market (DFm) in year t was defined as:

where the avoided fossil-based GHG emissions (expressed as tC) per unit of carbon contained in n products (expressed as tC), Spi is the annual volume of wood product i produced (MtC yr−1) or, alternatively, the amount of annual harvest (MtC yr−1), and t is year. Note that the DFm may be calculated from overall flows or marginal flows, as the impact is normalised per unit of wood use. The marginal substitution impact is calculated by additional avoided emissions per additional wood use compared to baseline. Conversion factors assumed 1 tCO2eq to equate 12/44 tC and 1 t of wood to contain 0.5 tC, and the average wood density was 500 kg m−3 if harvest volumes were provided without specific information on wood density.
Due to the nature of the research problem and the low number of fully comparable observations, statistical analysis was limited to simple descriptive statistics (mean and range). The statistical analysis of variance of means was deemed inappropriate due to non-independent observations, i.e. the need to include more than one DFm from each study, representing the different scenarios.
The summary statistics were reported with appropriate data filters to normalise the data as much as possible, e.g. by scenario type and coverage of wood flows, which allowed us to identify potential sources of variation and interpret the similarities and differences detected. Knowledge gaps were identified by observing a lack of entries for the variables in the review template, as well as by reading the discussion sections of the reviewed articles. The collected database and summary statistics are available in supplementary online material.
3. Results
3.1. Study scopes
Table 1 lists the studies included in the sample, as well as their regional, sectoral and temporal scopes. There is an increasing trend in the annual number of publications involving the analysis of market-level substitution impacts, with few publications prior to 2010.
Table 1. Studies included in the review and their scopes.
| Study | Region | Sector | Time horizon |
|---|---|---|---|
| Asada et al (2020) | EU-27 | Transport equipment, construction, textile, chemical | Unspecified |
| Baul et al (2017) | Finland | All wood flows | 2016–2055 |
| Bösch et al (2019) | Germany | All wood flows | 2014–2048 |
| Braun et al (2016) | Austria | All wood flows | 2010–2100 |
| Buchanan and Levine (1999) | New Zealand | Construction | Unspecified |
| Böttcher et al (2008) | Thuringia (Germany) | All wood flows | 2003–2043 |
| Böttcher et al (2012) | Thuringia (Germany) | All wood flows from Picea abies L. forests, all wood flows from Fagus sylvatica L. forests | 300 years |
| Chen et al (2014) | Canada | All wood flows | 1951–2010 |
| Chen et al (2018) | Canada | All wood flows | 100 years |
| Churkina et al (2020) | Global | Mid-rise urban buildings | 2020–2050 |
| D'Amico et al (2020) | Global | Construction (CLT floors) | 2020–2050 |
| Dugan et al (2018) | US (Wisconsin, South Carolina) | All wood flows | 2018–2050 |
| Geng et al (2019a) | China | Construction, furniture | Unspecified |
| Geng et al (2019b) | China | Furniture | Unspecified |
| Gustavsson et al (2017) | Sweden | All wood flows | 100 years |
| Hurmekoski et al (2020) | Finland | All wood flows | 2016–2056 |
| Höglmeier et al (2015) | Bavaria (Germany) | All wood flows except wood for pulp and paper production | Unspecified |
| Jasinevičius et al (2017) | Lithuania | Sawnwood, panels, CLT and Euro pallets | 2015–2100 |
| Jonsson et al (2021) | EU-26 | All wood flows | 2015–2030 |
| Kalliokoski et al (2020) | Finland | All wood flows | 50 years |
| Kayo and Noda (2018) | Japan | Civil engineering | 2050 |
| Kayo et al (2018) | Japan | All wood flows | 1970–2013-2050 |
| Knauf (2015) | North Rhine-Westphalia, Germany | All wood flows | 2005–2010 |
| Knauf (2016) | Germany | All wood flows | 2010 |
| Knauf et al (2015) | North Rhine-Westphalia, Germany | All wood flows | 2011–2100 |
| Lundholm et al (2020) | Moycullen (Ireland) | All wood flows | 2017–2116 |
| Lundmark et al (2014) | Sweden | All wood flows | 2005–2100 |
| Matsumoto et al (2016) | Japan | All wood flows | 2010–2050 |
| Nepal et al (2016) | USA | Non-residential construction | 2010–2060 |
| Olguin et al (2018) | Mexico (Durango, Quintana Roo) | All wood flows | 2018–2050 |
| Palma et al (2017) | 16 selected countries in Central Europe | Kitchen cabinets | 2010–2014 |
| Pingoud et al (2010) | Finland | All wood flows | Unspecified |
| Poudel et al (2011) | Southern Sweden | All wood flows (construction and energy) | 2000–2119 |
| Poudel et al (2012) | Southern Sweden | All wood flows (construction and energy) | 2000–2119 |
| Sathre and Gustavsson (2012) | Northern Sweden | All wood flows | 225 years |
| Schweinle et al (2018) | Germany | All wood flows | 2013–2208 |
| Smyth et al (2014) | Canada | All wood flows | 2015–2050 |
| Smyth et al (2020) | British Columbia (Canada) | All wood flows | 2020–2070 |
| Soimakallio et al (2016) | Finland | All wood flows | 2010–2110 |
| Suter et al (2017) | Switzerland | All wood flows | 2017 |
| Valade et al (2017) | EU | All wood flows | 150 years |
| Valade et al (2018) | France | All wood flows | 2010–2110 |
| Werner et al (2006) | Switzerland | Construction, furniture, energy | 2000–2130 |
| Werner et al (2010) | Switzerland | All wood flows | 2000–2100 |
The studies were unequally distributed in terms of regional and sectoral coverage. Most studies (66%) focused on Europe, with only a few studies focused on Asia, North America, or other regions. Most studies (59%) were focused on national or sub-national levels, with only a few studies covering continental or global levels. In terms of the sector focus, most studies (77%) aimed to cover all harvested wood flows in a region, and the most frequently covered single sub-sector was construction, which was covered in five studies. Time horizons varied substantially between studies, with 28% of the studies having a medium time frame (31 and 50 years), 19% not making projections, 16% having a time horizon exceeding a century, and one study projecting the substitution impacts for up to three centuries. The time horizon was unspecified in 14% of the studies.
3.2. System boundaries and assumptions
The level of detail in the description of assumptions and system boundaries of the reviewed studies varied greatly. Table 2 summarises the shares of studies considering the assumptions or system boundaries that could be extracted with a yes/no division.
Table 2. Consideration of selected assumptions and system boundaries.
| Yes | No | Not reported | ||||
|---|---|---|---|---|---|---|
| Count | Percent | Count | Percent | Count | Percent | |
| Exclusion of biogenic emissions? | 38 | 86% | 0 | 0% | 6 | 14% |
| Regionalisation of impacts? | 8 | 18% | 36 | 82% | 0 | 0% |
| Study assesses overall net emissions in addition to substitution impacts? | 33 | 75% | 11 | 25% | 0 | 0% |
| Inclusion of Lifecycle stages: | ||||||
| Processing and manufacturing stage—material uses | 44 | 100% | 0 | 0% | 0 | 0% |
| Processing and manufacturing stage—energy uses | 30 | 68% | 14 | 32% | 0 | 0% |
| Processing and manufacturing stage—internal mill energy | 20 | 45% | 24 | 55% | 0 | 0% |
| Product use stage | 10 | 23% | 34 | 77% | 0 | 0% |
| Cascading stage | 6 | 14% | 38 | 86% | 0 | 0% |
| End-of-life stage (energy recovery) | 23 | 52% | 21 | 48% | 0 | 0% |
| Upstream wood flows disaggregated? | 25 | 57% | 19 | 43% | 0 | 0% |
| Key intermediate product groups: | ||||||
| Solid wood products | 38 | 86% | 0 | 0% | 6 | 14% |
| Pulp and paper products | 18 | 41% | 20 | 45% | 6 | 14% |
| Byproducts and/or residues | 28 | 64% | 9 | 20% | 7 | 16% |
| Major overlap in DF data sources? | 17 | 39% | 26 | 59% | 1 | 2% |
| Sensitivity analysis conducted? | 15 | 34% | 28 | 64% | 0 | 0% |
For 86% of the studies, we could determine the substitution impact as the difference in fossil emissions between a wood product and non-wood product—excluding biogenic carbon emissions from the DF—although in the remaining cases it was not obvious from reading the study if the biogenic component was or was not included. In contrast, some of the assumptions were covered by only a few studies. For example, only 18% of the studies specified the regions in which the fossil emissions would be avoided when wood products were produced in one region. Therefore, the average DFms do not necessarily portray the avoided fossil impacts in the given region, as the emissions may equally be avoided in the producer countries, in the consumer countries, or in third countries, depending on the technologies and competing supplier regions that respond to the substitution-induced changes in demand for production inputs.
Most studies (75%) considered substitution in the context of a broader assessment of the net emissions of the forest sector, i.e. modelling both the ecosystem carbon flows and the substitution and carbon storage impacts of wood products, while the remaining 25% of the studies focused exclusively on substitution impacts. The studies that focused exclusively on substitution impacts were invariably focused on a single sub-sector. Studies with a focus on marginal substitution impacts, i.e. a change in substitution impacts compared to baseline, were relatively more common in the studies assessing the overall climate impacts of the forest sector compared to those assessing only substitution impacts. However, only a slight majority of the studies that had a broader scope focused on marginal GHG emissions (see supplementary data), thus not necessarily qualifying as mitigation analyses. Several studies also considered sustainability indicators other than climate impacts.
Not all studies were explicit on which lifecycle stages were included, so that it needed to be inferred or extracted from secondary sources. All studies considered material uses in the processing and manufacturing stage of the lifecycle, but only a few studies considered the cascading or use stage of the life cycle. The studies differed in the extent that they considered the various energy uses, with many studies including energy associated with processing and manufacturing (either for internal or external energy uses) and just over half (52%) considering end-of-life energy recovery.
The studies also differed in terms of the level of detail for the disaggregation of upstream wood flows, end uses of wood products, and the substitution cases, i.e. which wood product was assumed to replace which non-wood product. A slight majority (57%) of studies disaggregated upstream wood flows by identifying different wood sources, often using material flow analysis. The end use categories included construction (e.g. structural, non-structural, civil engineering, remodelling, formwork, scaffolding), furniture, packaging, graphic paper, hygienic paper, textiles, electricity, heat, transport fuel, and a few other niche uses. The total number of end uses considered by each study varied from one to 16, with the greatest detail found in studies focused on the construction sector. At the other extreme, in 25% of the studies the assumed end uses were completely unclear. In studies that considered only two end uses, the distinction was typically between material use (for construction) and use for energy generation. The greatest detail on the non-wood substitution cases was found in the studies that focused on the construction sector. The substitute non-wood products included brick, concrete, primary and secondary steel, aluminum, plastics (polyethylene, polypropylene, polystyrene, polyvinyl chloride, polyurethane), gypsum, rock wool, laminate, linoleum, glass, electronic media, cotton, asphalt, and fossil fuels (mainly coal, oil and natural gas). However, in 36% of the studies the substitution cases were unspecified.
In many studies, an average DF taken from previous literature was applied to cover a heterogeneous set of wood flows and end uses. Under such an approach, the functional units that are compared remain unclear. Moreover, 39% of the studies were found to have major overlap with other studies in terms of the DFp or DFm data sources. Major overlap was indicated if a study relied on only one or two secondary DFp or DFm data sources. Interestingly, this did not lead to equal DFm estimates in all such cases.
The scenario information extracted from the studies was divided into three types: estimates of the current substitution impacts, projected baseline scenarios with assumed continuation of contemporary practices or past trends, and all other scenarios. The third category included various types, often activities related to climate change mitigation, such as altering the product portfolios (incl. wood-based innovations) or cascading regimes, increasing or decreasing the production of wood products by a certain growth rate or market share assumptions, increasing or decreasing the level of harvest (overall, or for a specific use) within the limits of sustained yield (i.e. that fellings do not exceed the net increment in the long-term), or influencing tree growth with silviculture measures. Some studies explicitly modelled minimum, maximum, and likely impacts by portraying different ambition levels. Besides separate sensitivity analysis, some studies reported scenarios with different but equally likely assumptions as a form of uncertainty assessment.
3.3. Market-level DFs
Observations were filtered according to the scenario type (current values, baseline scenarios, or other types of scenarios), the market coverage (all wood flows or a specific sub-sector), the denominator (calculated per unit C contained in wood products or per unit C in total harvest), and the overlap of DF data sources.
The DFm for all wood flows per scenario type are given in table 3, distinguishing all data versus those data that include no obvious overlap for the secondary DF data sources. The results indicated an average DFm of 0.55 tonnes of fossil C avoided per tonne of C contained in total harvest for baseline scenarios covering all wood flows, ranging from 0.27 to 1.16 tC/tC. This value depicts the average efficiency of avoided fossil emissions for a certain wood use structure, but is of limited practical use as it is context-specific and cannot be generalised from one region or sector to another. It is also important to realise that the positive substitution values are the results of emission reductions that occur over the entire life cycle of a product and these emission reductions may occur at different points in time. A single value summarising the DFm across all studies cannot be given because the contexts of individual values are too different to allow for a simple average.
Table 3. Mean and range of DFm (tC/tC) found in literature for current values, baseline scenarios, and other types of scenarios calculated for all wood flows in a region. No distinction is made in terms of the denominator due to the negligible difference in the estimates calculating the DFm per unit C contained in wood products or per unit C contained in total harvest when covering all wood flows.
| Number of observations | Mean | Minimum | Maximum | ||
|---|---|---|---|---|---|
| Including studies with overlapping DF data sources | Current value | 12 | 0.83 | 0.38 | 1.42 |
| Baseline scenario | 29 | 0.61 | 0.27 | 1.16 | |
| Other scenario | 86 | 0.81 | 0.19 | 2.22 | |
| Total | 127 | ||||
| Excluding studies with overlapping DF data sources | Current value | 6 | 0.69 | 0.38 | 1.23 |
| Baseline scenario | 13 | 0.55 | 0.27 | 1.16 | |
| Other scenario | 43 | 0.74 | 0.19 | 2.22 | |
| Total | 62 |
The reported DFms represent two types of estimates: (a) those derived from overall substitution impact estimates, mostly for current values and baseline scenarios, calculated either as a modelling artefact for mitigation analysis or for other purposes, and (b) marginal substitution impact estimates, i.e. the difference between a scenario and a baseline, representing around half of the observations in the 'other scenario' category. The first depicts overall avoided emissions per overall wood use compared to zero harvest, and the latter depicts the additional avoided emission per additional wood use, which can also be negative, i.e. a decline compared to baseline. Note that the difference in the average DFm between the different scenario categories in table 3 should not be interpreted as the marginal substitution impact, as the values are study-specific.
Based on summary statistics, the data indicated possible sources of variation related to the disaggregation of lifecycle stages and the end uses of wood products (figure 2). There was some tendency for higher DFm with less detailed assumptions. That is, the DFm were on average higher if the internal mill energy use of wood was not considered, if pulp and paper was not considered, if end-of-life energy recovery was not considered, or if the studies resorted to secondary DF data sources. However, such conclusions should only be considered as indicative, as the summary statistics indicated no or minor impact for most of the assumptions or system boundaries, such as whether the substitution cases were clearly defined or unclear (figure 2).
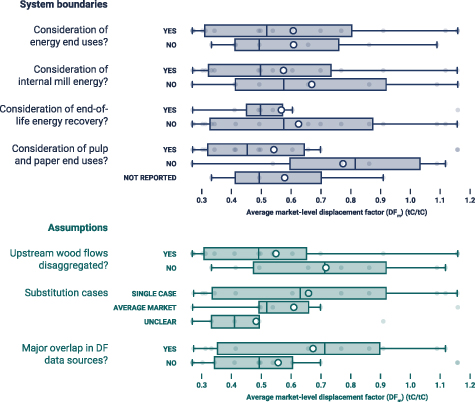
Figure 2. Means (circles), quartiles (boxes), ranges (whiskers) (excluding outliers outside the 1.5-fold interquartile range past the low and high quartiles), and individual observations (dots) of DFm split according to selected key assumptions and system boundaries. The figure includes only observations for all wood uses and for baseline scenarios with available average DFm (n = 23).
Download figure:
Standard image High-resolution image3.4. Sensitivity, uncertainties, and knowledge gaps
Most studies did not execute uncertainty assessment or sensitivity analysis on the substitution impact estimates. In the studies that did conduct an uncertainty assessment or sensitivity analysis, the results clearly suggested that the DFm is sensitive to assumptions (Baul et al 2017, Valade et al 2017, Kayo et al 2018, D'Amico et al 2020, Hurmekoski et al 2020), though not in all analyses (Höglmeier et al 2015). As expected, market-level substitution impacts were found to be particularly sensitive to the product-level DFps used in the analysis. Changes in the assumed substitution cases and corresponding DFps changed the DFm by more than 100% in some cases (e.g. Valade et al 2017).
Our compilation of the sources of uncertainty identified in the studies found that the DFm values remain uncertain due to the limited number of substitution cases assessed compared to the vast number of possible substitution cases. In addition, authors identified limited availability of life cycle assessment (LCA) and market data, particularly regarding the specific wood flows and end uses, and challenges in identifying the substitutability between wood products and non-wood products.
Various uncertainties were also identified for future projections, where most authors mentioned uncertainty related to the pace of development of technologies, and reference energy carriers. This is important because DFm is likely to decline due to the expected decarbonisation of the energy sector and the associated development of the emission profile of non-wood products. However, major innovation in production processes could occur in both the forest sector and the competing sectors. Also, it was suggested that the uptake of carbon capture and storage and recycling may plausibly influence the estimates. In studies modelling the overall net emissions of the forest sector, authors mentioned many other important uncertainties such as natural disturbances, biophysical impacts, the impacts of climate change on forests, other GHGs such as methane, and the dynamic response of forests to harvesting.
Very few studies conducted feasibility assessments of the estimated changes in demand and supply, we assume because of the additional level of effort required to do the complex socio-economic modelling of feedback effects between various processes. The studies that included market assessments indicated a lack of analysis of dynamic market responses, such as leakages, rebound and indirect effects, other price effects, production constraints, and returns to scale, which constitutes a major knowledge gap.
4. Discussion and conclusions
4.1. Evaluation of results
In this study we reviewed 44 scientific publications that estimated substitution impacts of wood use at a market level. We tracked the distribution of scopes, assumptions and system boundaries of studies quantifying the market-level substitution impacts to derive the average and range of market-level DFm estimates, and to indicate caveats and knowledge gaps.
The results indicate an average DFm of 0.55 tonnes of fossil C avoided per tonne of C contained in wood harvested across studies published in the literature, ranging from 0.27 to 1.16 tC/tC for baseline scenarios covering all wood flows. These figures contain estimates that calculate the substitution impacts per unit C contained in wood products as well as per unit C contained in total harvest, but the difference was found to be negligible in our sample when covering all wood flows. That is, the harvest contains roughly the same amount of C as the aggregate of the harvested wood products and side streams, except for minor losses and possible imbalances in national statistics, such as bark. The identified average DFm is lower than the average product-level DFp of 1.2 tC/tC (Leskinen et al 2018). A likely explanation is that DFm are weighted by the respective production or consumption volumes of wood-based products in each end use, and because some wood products are often assumed to provide limited to no substitution benefits (e.g. graphic papers, hygienic papers) or fall outside the scope of the analysis (e.g. textiles, chemicals).
Based on summary statistics, the DFm estimates varied from one study to another, due to assumptions or system boundaries. One important difference was whether the internal mill energy use of wood was considered—studies which did not make an explicit distinction between commercial and internal mill energy seemed to report higher DFm on average, possibly due to assigning a positive DFp value to internal mill energy. That is, the lower fossil emissions of wood-based products originate primarily from the combustion of by-products from sawmilling and pulp manufacturing to (partly) cover the energy demand of the mills that manufacture wood-based products, which leads to lower fossil fuel inputs (e.g. Rüter et al 2016). The emissions from wood burning are calculated as zero in the energy sector to avoid double counting in GHG inventories, as these emissions are fully accounted for in the land use, land use change and forestry sector. Thus, assigning a positive DFp value to internal mill energy in the same way as for commercial energy uses (production stage or end-of-life) would lead to double counting the substitution impact. However, separating mill energy wood flows from market energy wood flows may be difficult in practice, due to a lack of comprehensive statistics, and due to market fluctuations caused by, for example, fluctuations in prices for energy and wood, and availability of wood for energy. Moreover, some studies have assumed positive DFps for mill energy, if there has been a clear baseline with wood product mills using fossil fuels. More broadly, literature indicates that the substitution cases, i.e. the choice of reference fuel and technology, has decisive impact on the average DFm. For example, Sathre and Gustavsson (2012) found that using coal instead of natural gas as a reference fuel resulted in around 0.5 tC/tC higher average DFm. Also in product level LCA cases, the energy mix has been found to have a decisive impact on the avoided fossil emissions (Leskinen et al 2018).
While the largest relative impact would seem to arise from the production stage material uses (see supplementary data), the impacts of different lifecycle stages may be incomparable due to timing of C flows through production, usable lifetime which may be years to decades, and end-of-life. For example, the production stage DFm may be calculated per unit C contained in wood products produced in year t, while the end-of-life DFm is calculated per unit C contained in the outflow from wood product pool in year t. Thus, the average values should not be applied directly, as they only serve to illustrate the scale of market level substitution impacts across widely varying contexts and assumptions.
The relative convergence of DFm estimates may arise partly from the use of the same DFp or LCA data sources, as 30 out of 44 studies adopt the DFps directly from secondary sources, either from original LCA studies or meta-analyses. For example, some studies used directly average DFps from meta-analyses (Sathre and O'Connor 2010, Leskinen et al 2018) instead of, or in addition to, specifying the most likely substitution cases and conducting LCA based on them. In the studies that adopted the DFps from single sources, three primary studies could be distinguished as most influential, in that each was adopted by four other studies as the primary data source (Gustavsson et al 2006, Sathre and O'Connor 2010, Knauf et al 2015), although Knauf et al (2015) builds further on Sathre and O'Connor (2010) and Taverna et al (2007). Thus, while some studies have gained more influence, the secondary data sources appear somewhat dispersed.
The level of detail in the description of assumptions and system boundaries of the reviewed studies varied greatly, but was often insufficient for interpreting the results, or for assessing their validity and reliability. Importantly, for more than one-third of the articles reviewed, even the substitution cases, i.e. which wood product is assumed to replace which non-wood product in which end use, remained unspecified or unclear, leading to ambiguity and inconsistency.
If the DFps were strictly applied to the LCA cases from which they were originally derived, the functionalities of the compared products would be identical, and further assumptions, for example, on product service lives would be unnecessary. However, several studies extend DFps to cover a wider market, which leads to generalising a case study result. Due to the vast amount of substitution cases, the DFps are almost invariably generalised beyond the product level case studies. Thus, some studies apply additional assumptions to correct for some of the sources of error, such as assuming a coefficient to correct for differences in the expected product lifespan. Only a few studies try to avoid generalizing the market-level impacts from single cases by disaggregating the end uses and substitution cases in greater detail. In practice, this approach is only feasible for small and well-known market segments, such as a certain construction sub sector (e.g. Hafner and Rüter 2018).
4.2. Study limitations
The literature considered included only peer-reviewed studies (and excluded grey literature) from which it was possible to derive an estimate for DFm. Thus, the conclusions drawn do not portray the entire population of studies that calculate or discuss market-level substitution impacts. However, while there is a clear overrepresentation of European studies, for example, this is expected to reflect the overall distribution of the papers under this topic. No systematic bias in the data collection was recognised, which was supported by the relatively small amount of additional studies found by screening the references of the studies in the initial sample. However, several studies had to be excluded due to being unable to extract DFm, as the substitution impacts were either reported in a non-convertible unit or as aggregated to other GHG flows. Additionally, for many studies, it was possible to extract the required data for a subset of scenarios only.
One obvious source of systematic error in those DFm estimates that needed to be converted into C from another unit is the conversion factor for wood density. We assumed a generic basic wood density of 500 kg dry matter per m3 in the absence of sufficiently detailed original data to determine the amount of harvest in tonnes of carbon. However, basic densities can vary substantially between tree species and wood products. In the case of a harvest consisting of mostly boreal coniferous species, a density of 400–450 kg m−3 could be assumed (e.g. Repola 2009), which could lead to a systematic underestimate of DFm of more than 0.1 tC/tC. In contrast, the basic wood density of beech, common in temperate latitudes, is 650 kg m−3, which could lead to an opposite bias. However, compared to the overall range of comparable DFm estimates of 0.9 tC/tC, the impact of the single conversion factor was considered tolerable.
We identified important contexts in assessing substitution impacts in an effort to reduce the bias related to non-independent observations: the denominator of DFm (whether the DFm is calculated per unit C contained in wood products or per unit C contained in total harvest); scenario type (whether the extracted figure portrays an estimate of the current situation, a baseline scenario or another type of scenario); market coverage (whether the extracted figure covers all wood flows or a specific submarket); and the overlap of secondary data sources. Excluding scenarios other than baseline scenarios reduces the number of observations included from the same studies. However, we had to exclude many of the baseline scenarios as well, because studies focused on mitigation often calculate substitution impacts as the difference between a mitigation scenario and the baseline scenario, so that the overall substitution impacts of the baseline scenario are not reported even as interim results. Additionally, some studies included more than one baseline scenario, with different but equally justified assumptions, for example, regarding the reference energy mix, thus compromising the nonindependence of observations, despite a significantly reduced number of comparable cases. Thus, a full meta-analysis of the differences in means of the DFm estimates was considered infeasible with the current data.
The review documents the scale and range of DFms and the assumptions and system boundaries behind them. While the collection and editing of data to the review template required relatively little judgment and the process was explicitly documented, a chance of non-repeatability and human error remains for individual database entries. These should not affect the main conclusions drawn.
4.3. Research and policy implications
Despite its widespread use, the reliance on DFs as a sole indicator for substitution impacts may be an oversimplification. DFs have been criticised for their static nature, as markets, production technologies and efficiencies, as well as C flows, change dynamically over time (Harmon 2019). Indeed, most studies fix the DFs from decades up to a few centuries, although product portfolios and the emission profiles of the products are likely to change over time. Moreover, the use of product level DFs in upscaling the substitution impacts on market level requires considerable complexity in estimating end uses from multiple types of wood products, which is often overly simplified by using an aggregated value taken from literature. In what could be considered as the state-of-the-art as regards the consistency of combining LCA data and market data, Hafner and Rüter (2018) introduced an approach using standard compliant and representative country data to extrapolate absolute overall fossil emissions of a scenario against a baseline, which allows interpreting the substitution impacts directly as the difference between absolute overall fossil emissions, without the interim phase of calculating the DFs. In practice, however, research objectives and methodologies often coerce the use of DFs. Partial equilibrium models for the forest sector, for example, are advantageous in that they take biogenic carbon dynamics into account but operate at the level of intermediate products and not at the level of functional units. Thus, studies aim either at greater precision or greater coverage, but current tools and data may prevent targeting both at the same time.
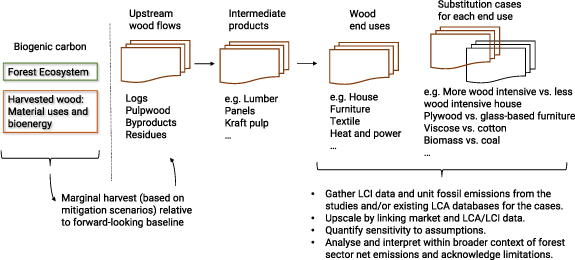
Figure 3 summarizes a generalised approach for calculating the substitution impacts of wood use at the market level. The differences in the current approaches mostly seem to concern the order of the different phases of the analysis and the level of complexity, whether or not using DFps. For example, some studies may apply material flow analysis and allocate a DFp for the appropriate wood flows, whereas other studies first define a single representative functional unit, comparing a more wood-intensive end product to a less wood-intensive end product, and weight the end use baskets with wood product consumption or production statistics.
Figure 3. Generalized workflow of procedures for upscaling the substitution impacts of wood use from product to market level.
Download figure:
Standard image High-resolution image
Using DFs, there is room to improve the substitution impact estimates by considering more detail for some of the key uncertainties, such as which wood product can be assumed to substitute for which non-wood product. One possible avenue is to make systematic assumptions on substitution cases, possibly guided by microeconomic theory or LCA principles and using empirical data e.g. on demand elasticities. Furthermore, there are still greater caveats, namely to what extent substitution can be assumed to occur in the first place. Harmon (2019) summarises three factors commonly ignored in literature (decarbonisation, leakage, wood for wood substitution), which are likely to result in lower market level substitution impacts than indicated. Firstly, if industries decarbonise, there will be significantly fewer fossil emissions to be avoided by 2050, which suggests that the forest industry could focus on products that are difficult to decarbonise. Secondly, the consumption of the alternative product may simply shift elsewhere in the economy within or between sectors, or the use of fossil feedstocks may be delayed for a certain period—leading to international, intersectoral, or intertemporal carbon leakage (see e.g. Kallio and Solberg 2018). Dynamic economic or systems modelling is required to potentially account for such indirect and rebound effects. Thirdly, the substitution assumptions invariably assume that wood-based products substitute for non-wood products, whereas substitution among wood-based products themselves has been ignored. If a typical assumption would be that a wood-based product substitutes for an average mix of materials based on their market shares, the high market share of wood-based products, e.g. in the detached single family home market in North America or the Nordic countries, would translate into allocating a zero DFp for the majority of domestic wood use, leading to significantly lower overall DFm estimates. This, however, does not concern the analysis of marginal impacts. We noted that, while decarbonisation and leakage issues were considered by a few studies and noted by many more, none of the studies in the sample made explicit assumptions regarding substituting wood itself.
As forest products are traded globally, substitution impacts of wood use can be relevant in large or emerging economies without vast forest resources. However, very few of the published studies so far have a global perspective that considered future global demands of wood products, which also affect leakage and additionality issues. For example, if the consumption of wood-based products in population-dense countries like India or China increased, it would likely lead to increased exports from Europe and North America, and increased global prices and also affect the production of other products. While wood resources are limited compared to the global fossil economy, major substitution could occur based on the available wood resources. For example, a 100% market share of new residential construction in the EU would require 40–400 Mm3 of roundwood per year, depending on the structure type (see Hurmekoski et al 2018), which compares to industrial roundwood production of 392 Mm3 in the EU in 2019 (FAOSTAT 2021). The consumption per capita of wood-based products varies globally, and not only due to differences in income but due to material availability and culture (Buongiorno 2009).
As a part of the portfolio of natural climate solutions, producing timber to substitute for fossil resources can be a successful strategy only if it is based on the principles of sustainable forest management, i.e. if the harvested sites are regenerated with species or provenances that perform equally well or better, management intensity does not change significantly (e.g. in case of conversion of a natural forest to a production forest), and that the level of annual fellings remain below the net annual increment in forests available for wood supply over the long-term. Importantly, substitution impacts alone do not correspond to the total mitigation potential of wood-based products, as the analysis of mitigation potential requires simultaneous consideration of all GHG flows (incl. those of forest ecosystems) against a realistic baseline. That is, without proper contextualisation and in isolation from other forest-related GHG flows, the substitution impact estimates provide only partial information for decision-making.
Furthermore, substitution impact is not an absolute but a relative measure, which needs to be interpreted in comparison to a baseline scenario or forward-looking baseline against which marginal changes are compared (Gunn and Buchholz 2018). Because of the need for a baseline, substitution impacts are not directly comparable to GHG inventories involving absolute C balances such as annual changes in emissions or biogenic carbon stocks (see, e.g. Soimakallio et al 2015). This makes the substitution impacts difficult to compare to other nature-based mitigation potentials across different studies and contexts but does not remove their utility in decision-making for mitigation analyses assessing the net impacts of a set of mitigation measures against a baseline.
National-level studies assessing the net emissions of the forest sector invariably conclude that strategies with increased harvest intensity lead to higher net emissions over a time frame of decades, up to a century (e.g. Werner et al 2010, Lundmark et al 2014, Matsumoto et al 2016, Chen et al 2018, Valade et al 2018, Seppälä et al 2019). In other words, these studies suggest that the avoided fossil emissions through substitution with current wood uses do not fully compensate for the temporary loss of biogenic carbon in forest ecosystems, if the level of harvest increases compared to a baseline. That is, there is a trade-off between short and long-term climate impacts, if the expanding bioeconomy leads to additional harvest. While such studies often lack crucial elements influencing the baselines, such as leakages and natural disturbances, they do point to the importance of focusing on products that provide large substitution benefits or are long-lived, to compensate for lower carbon storage in forest ecosystems (see Nabuurs et al 2007).
A few studies examine the threshold of DFm to achieve net negative impact on the climate in case of increased harvest. Köhl et al (2020) conclude that achieving carbon neutrality would require an average DFm of between 1.9 and 3.3 tC/tC in Germany, Seppälä et al (2019) and Kalliokoski et al (2020) conclude that a DFm of 1.7–2.4 tC/tC would be required to achieve net benefits in Finland in a timeframe of 50–100 years. For Europe, Valade et al (2017) conclude that a substitution factor of at least 1.68 tC/tC for long-lived timber and 1.02 tC/tC for energy are required for the forest sector to enhance its current sequestration efficiency in Europe over a 100 year time horizon, in the case that the forest ecosystem C sink becomes neutral. Altogether, these studies suggest that higher substitution benefits for material uses are needed to provide short-term benefits for climate change mitigation, compared to the reported substitution impacts identified in our review. Based on the DFms and the scenario descriptions in our database, this holds for most maximum benefit scenarios as well, with only a few exceptions that use extreme assumptions for the DFps and market share development of wood construction. In terms of decision-making, this would imply that, purely in terms of climate change mitigation, it would be preferable to increase the substitution impacts by aiming to influence product portfolios instead of increasing the level of harvest, to avoid the short-term trade-off between substitution impacts and forest carbon sinks. For example, Brunet-Navarro et al (2021) suggest that marginal changes in the product portfolios and end-of-life fates of wood product use could contribute to EU 2030 emission reduction targets by up to 3.3%, even taking into account the rapid decarbonisation of the energy sector.
Drawing more specific conclusions will necessitate more careful and holistic analysis of the key uncertainties that impact the development of net emissions over time, such as the impacts of climate change, including natural disturbances from wildfires and pests on forest ecosystems, or potential leakage effects. An analytical tool could be to assess the carbon parity period, i.e. the period between biomass harvest and when the overall GHG emission balance of the harvest scenario (including avoided fossil emissions through wood utilisation and carbon stock in wood products) offsets the loss of carbon stored in biomass and the accumulated ecosystem carbon that could have occurred had the harvest not taken place (e.g. Seppälä et al 2019). The length of the carbon parity period depends on the regional context, such as the latitude (boreal, temperate, or tropical), biomass feedstock source (stem-wood or residue), the type of fossil fuel replaced (coal, oil, or natural gas), energy usage (heating or power generation) (Geng et al 2017), as well as climate sensitivity, potential sink reversals, the industry structure and the forest management regime. As noted by (Geng et al 2017), assessing the carbon parity time has so far been more common in assessing the climate impacts of bioenergy exclusively (see e.g. Nabuurs et al 2017).
4.4. Concluding remarks
Overall, the upscaling approaches and the resulting DFm seem somewhat convergent across the studies, possibly due to using similar data sources, system boundaries and assumptions. The review points to the following best practices for upscaling the substitution impact estimates at market level:
- (a)Define the purpose of calculating market-level substitution impacts.
- (b)Define the sector, region, and time horizon for the analysis.
- (c)Disaggregate upstream wood flows, intermediate wood products, and end uses of wood products in appropriate detail.
- (d)Define the functional units and substitution cases, i.e. which wood products substitute for which functionally equivalent non-wood products in each end use in appropriate detail, and if applicable, how much bioenergy substitutes for fossil fuel energy.
- (e)Derive or collect product-level life cycle inventory and analysis (LCI/LCIA) data for all lifecycle stages for each relevant substitution case. If possible, gather representative and standard-compliant LCA data for the functional unit and connect it to national statistics. If these data are not available, assess the representativeness of the LCA and market data gathered from secondary sources. If converting the LCI/LCIA data into DFps, ensure the DFp denominator fits the objective of the analysis, for example, to properly address the allocation of byproducts.
- (f)Define the market scenarios and a forward-looking baseline.
- (g)Compare fossil emissions exclusively to avoid double counting the substitution benefits of biogenic emissions.
- (h)Upscale the substitution impacts from product level to market level by projecting the total absolute fossil emissions of a scenario against those of a baseline scenario. If using DFps, consider all appropriate end uses of wood and weight the DFps of each appropriate substitution case according to the market-level production or consumption volumes.
- (i)Interpret the substitution impacts against an appropriate reference, such as the marginal change in harvest levels.
- (j)Interpret or use the substitution impacts in a broader context of assessing climate change mitigation potential of the forest sector.
- (k)Conduct uncertainty assessment and sensitivity analysis on the key assumptions and uncertainties and acknowledge the limitations.
Due to the complexity of the market, it would be extremely difficult to reliably assess all combinations of wood products and substitute products in practice. An accurate estimate would require knowing precisely, which wood product replaces which non-wood product, where and when, while also considering the various direct and indirect market feedback effects. Thus, challenges remain in estimating the impact of the forest sector on the emission balance of other sectors. However, a growing number of studies focus on the marginal substitution impact, i.e. the additional avoided emissions per additional wood use, as compared to a baseline. This allows us to place less emphasis on the detailed definition of the baseline and instead focus on the impacts of marginal changes in wood use, which should reduce the risk of bias as well as increase the relevance to decision-making. On the other hand, this will necessitate the capture of the various direct and indirect market responses of changes in the wood product markets, which the current literature typically ignores. For example, it is not clear without careful modelling, to what extent a single end use of wood could increase, given the market constraints and how would it affect the production of other products, if a major change in a single end use occurred. Moreover, there is a need to make the assumptions in substitution cases more systematic and reliable by considering market data and economic theory. The scarcity of market analyses represents a significant knowledge gap and could constitute more variance in the results than the current literature indicates. Thus, besides considering the 'best practices' outlined above, one way to increase the policy relevancy of market-level substitution impact estimates could be to restrict the scope of the analysis to marginal changes in the use of wood to those end uses where increased substitution impacts could realistically be expected, while considering the various market dynamics and uncertainties to a greater degree.
Acknowledgments
The authors declare no conflict of interest. Dr Hurmekoski wishes to acknowledge financial support from the SubWood project (No. 321627) funded by the Academy of Finland. The views expressed in this study do not necessarily reflect the position of the Government of Canada.
Data availability statement
All data that support the findings of this study are included within the article (and any supplementary files).
: Appendix
Table A1. Template for extracting the data from the studies included in the review.
| Scopes, system boundaries and assumptions | Data types | Explanation |
|---|---|---|
| Study | - Publication details | |
| - Journal | ||
| - Year of publication | ||
| Region | - Text | |
| - Choice (sub-national, national, continental, global) | ||
| - Choice (Europe, North-America, Asia, Other, Global) | ||
| Sector | - Text | |
| - Choice (all wood flows, specific market) - Choice (all wood flows, construction, furniture, civil engineering, textiles, chemicals, transport Equipment, wood products industry) | ||
| Temporal horizon | - Range (text) | - base year and end year of projection |
| - Temporal horizon (years) | - length of projection period in years | |
| Scenario type and description | - Choice (current value, baseline scenario, other scenario) - Description | Scenarios altering any of the market or carbon flow related assumptions: Whether the reported weighted DF represents i) an estimate of the current situation, ii) a baseline projection, or iii) another type of scenario projection, often a mitigation scenario |
| Lifecycle stages considered | - Number (original unit) - Choice (Y/N/nr) | - Processing and manufacturing (from material extraction to factory gate) for material uses, energy uses, and internal mill energy (the energy produced from wood residues or byproducts used to cover the energy demand of wood product mills) - Product use (from factory gate to disposal) - Cascading (reuse, recycling or downcycling: Not including end-of-life energy recovery) - end-of-life (energy recovery from burning biomass contained in a discarded product) - For the choice, Y = considered, N = not considered, nr = considered in system boundaries, but value not reported. |
| Average DF (DFm) (tC/tC) | Number (tC/tC) | Average DF containing all of the lifecycle stages considered in the study |
| DF denominator | Choice (per unit C contained in wood products, per unit C contained in harvest) | Whether the DF is calculated per unit of carbon contained in the final product, or per unit of carbon contained in the amount of roundwood equivalents required for producing the final product, thus containing sidestreams allocated to the product. Irrelevant to interpretation if all wood flows are considered, as the harvest contains the same amount of C as the C in the aggregate of harvested products and sidestreams. |
| Overall substitution impact (MtCO2eq-yr) | - Number (original unit) - Number (MtCO2eq.) - Explanatory text | |
| Exclusion of biogenic emissions from DF | Choice (Y/N/nr) | Whether the displacement factor quantifies differences in fossil emissions only, or includes also biogenic emissions in the numerator |
| Disaggregation of upstream wood flows | - Choice (Y/N/nr) - Explanatory text | Disaggregation of upstream value chain (wood flows from forest to intermediate products): Whether different wood sources and assortments have been detailed, or the study only refers to an aggregate amount of wood used for an intermediate product. Such disaggregation facilitates distinguishing and tracking, e.g. the energy uses of byproducts for internal mill energy use vs. commercial CHP facility use. |
| Disaggregation of downstream value chain (from intermediate products to end uses) | - Number of end uses (number) - details of disaggregation (text) | Distinguishing the end uses of intermediate products to facilitate making assumptions on substitution cases. |
| Substitution cases (which wood products substitute for which non-wood products) | Choice (unclear, single case, average market) | Whether the study (a) leaves the substitute product pairs undefined (unclear), (b) compares a single case of a selected/typical wood product design against a selected/typical non-wood product design with the same functionality and expands the single case to cover an end use (Single case), (c) details an average non-wood product mix that one or more wood products substitute for (average market) |
| Wood products considered | - Text - Choice (Y/N for solid wood products, pulp and paper products, byproducts and sidestreams) | List of wood products considered when calculating DFm |
| Non-wood products considered | Text | List of non-wood products considered when calculating DFm |
| Assumptions on service life of products | - Comparison of service lives (Y/N) - Assumptions on service life (text) | Assumption on the service life of wood and non-wood products |
| Market data sources | - Choice (global vs. local) - explanatory text | Data sources for the market related data (wood flows, production/consumption of wood products, end uses, etc) |
| DFp and DFm data sources | - Choice (global vs. local) - Choice (Secondary sources, own calculation, mix of secondary sources and own calculations, unclear) - Choice (Y/N) on major overlap with DFp or DFm data sources with other studies in the sample - explanatory text | Sources for LCA data or secondary sources of DFs. For the choice on the level of overlap of DF data sources, major overlap was indicated, if there was only one or two secondary sources stated. |
| Sensitivity analysis | - Choice (Y/N) - Explanatory text | Whether the study includes sensitivity analysis/uncertainty assessment, and short description of the sensitivity analysis/uncertainty assessment carried out and main findings. |
| Regionalisation of impacts | Choice (Y/N/nr) | Analysis of where the avoided emissions take place |
| Broader system boundaries of the study | - Included elements (text) - Excluded elements (text) - Choice (Y/N: Study analyses net emissions of the forest sector) - Overall vs marginal substitution (choice) | - List of elements considered and not considered by the studies. - Whether the study focuses on substitution impacts only, or covers also biogenic emissions - Whether the study focuses on overall impacts or marginal impacts (difference between a scenario and a baseline). Note that it makes no difference whether the DFm is calculated for marginal or overall values. If a study reports both, only marginal is indicated. |
| Identified uncertainties or knowledge gaps | Text | List of uncertainties or knowledge gaps identified in the discussion section of the study |