

Abstract
Achieving an economy-wide net-zero greenhouse gas emissions goal by mid-century in the United States entails transforming the energy workforce. In this study, we focus on the influence of increased labor compensation and domestic manufacturing shares on (a) renewable energy technology costs, (b) the costs of transitioning the U.S. economy to net-zero emissions, and (c) labor outcomes, including total employment and wage benefits, associated with the deployment of utility-scale solar photovoltaics (PV) and land based and offshore wind power. We find that manufacturing and installation labor cost premiums as well as increases in domestic content shares across wind and utility-scale solar PV supply chains result in relatively modest increases in total capital and operating costs. These small increases in technology costs may be partially or fully offset by increases in labor productivity. We also show that solar and wind technology cost premiums associated with high road labor policies have a minimal effect on the pace and scale of renewable energy deployment and the total cost of transitioning to a net-zero emissions economy. Public policies such as tax credits, workforce development support, and other instruments can redistribute technology cost premiums associated with high road labor policies to support both firms and workers.
Export citation and abstract BibTeX RIS

Original content from this work may be used under the terms of the Creative Commons Attribution 4.0 license. Any further distribution of this work must maintain attribution to the author(s) and the title of the work, journal citation and DOI.
1. Introduction
Net greenhouse gas emissions must approach zero in order to stabilize the global mean temperature [1, 2]. In 2021, the Biden administration issued executive orders committing the U.S. to achieving an economy-wide net-zero emissions target by mid-century [3, 4]. Several states have similarly made net-zero commitments through statute or executive order [5]. Achieving a net-zero emissions goal entails transformational changes in the physical energy system [6–8], in addition to the energy workforce [9].
Increasingly, policy discourse has focused on embedding social, environmental justice, and equity goals into climate policy [10–12], including elements related to the distribution of societal costs, risks, and benefits, such as jobs and air pollution [13–15]. With respect to labor equity, taking the high road refers to a collection of practices and policies such as local hiring requirements, prevailing wage standards, unionization, gender and racial equity hiring requirements, workforce development and training, and domestic content share requirements [16]. These practices can increase and concentrate wages and other employment benefits, in addition to secure the requisite workforce and renewable supply chain needed to meet net-zero emissions goals and moderate both domestic and international socio-political influences [17]. However, the policy and political discourse around clean energy often operates under an assumption that there are inherent tradeoffs between addressing climate change or maintaining affordable electricity supplies and supporting jobs.
The aim of this to study is to quantify the relationship between high road labor practices and policies and the cost and pace of clean energy transitions. We focus on the influence of increased labor costs and domestic manufacturing shares on (a) renewable energy technology costs, (b) the costs of transitioning the U.S. economy to net-zero emissions, and (c) labor outcomes, including total employment and wage benefits, associated with the deployment of utility-scale solar photovoltaics (PV) and land-based and offshore wind power.
To evaluate the influence of high road labor policies, we first develop bottom-up capital and operations and maintenance (O&M) cost estimates for 2020, largely based on the National Renewable Energy Laboratory (NREL) benchmarking studies and market reports [18–31], which are indicative of U.S. costs but do not represent regional- or project-level variation. In this bottom-up cost estimation, we confine our scope to focus on domestic manufacturing and direct labor associated with the following segments of the wind and solar supply chains: production of wind blades, towers and nacelles and wind farm installation, and production of polysilicon, wafers, PV cells, modules and inverters and solar PV system installation. All other raw materials and subcomponent inputs into these specific supply chain steps (i.e. steel or aluminum for wind towers or PV racking, internal power electronics or other components for inverters, etc) are treated as non-labor cost inputs and we do not estimate domestic content or break out labor costs and compensation associated with these inputs. We modify the 2020 baseline cost estimates to reflect alternative labor cost premiums and increased domestic content share assumptions, and we project costs from 2020 to 2050. We then simulate the effects of high road labor policies and practices on least-cost pathways to achieve net-zero emissions in the U.S. by 2050. We model alternative techno-economic pathways using the modeling approach and specifications developed as part of the Net-Zero America (NZA) study [6]. The NZA study implements a macro-energy system modeling framework to select a least-cost techno-economic pathway to achieve net-zero emissions across the U.S. economy by 2050. We use EnergyPATHWAYS, a bottom-up model of future economy-wide electricity and fuel demand, coupled with Regional Investment and Operations (RIO) model, a linear programming model that combines capacity expansion with sequential hourly operations over a sampling of representative days to find the least‐cost solution for decarbonized energy supply to meet demand over time [7]. Finally, we use the Decarbonization Employment and Energy Systems (DEERS) model to estimate employment and wage outcomes associated with the techno-economic pathways modeled [9].
The following sections outline the findings, and the supplementary information (SI) (available online at stacks.iop.org/ERL/16/124012/mmedia) provides technical detail regarding the modeling approach.
1.1. Influence of high road labor practices and policies on baseline renewable energy technology costs
We estimate the following 2020 baseline capital cost estimates: $1.20 W−1-AC for utility-scale solar (without tariffs), $1.30 W−1 for land-based wind, $4.08 W−1 for fixed offshore wind, and $5.32 W−1 for floating offshore wind 3 . See SI section 1.1 for derivation of this baseline estimate. We then modify these baseline renewable energy technology costs to evaluate the influence of labor cost premiums and increased domestic content shares, in addition to the potential countervailing effect of productivity gains.
Labor cost premiums associated with manufacturing and installation may arise from prevailing wage standards, unionization, job training programs, and other high road policies and practices. Domestic labor costs represent a small to moderate share of solar and wind installed capital costs (17% for utility-scale solar, 22% for land-based wind, and 10% for offshore wind) and O&M costs (32% for utility-scale solar, 28% for land-based wind, and 16% for offshore wind). As a result, labor cost premiums associated with manufacturing and construction have a relatively small influence on technology costs (refer to SI figures 7 and 8). For example, a 20% increase in domestic labor costs increases installed capital costs for wind and solar power by 2%–4% and O&M costs by approximately 3%–6% across technologies.
Figure 1 (and SI figures 9–11) contextualize the sensitivity of capital and O&M costs to the wage distribution across the construction and manufacturing sectors. Wage heterogeneity is associated with, among other factors, occupation, geography, unionization rates, industry differentiation, and firm practices. For example, unionized workers are generally compensated at a higher wage rate than workers not represented by a union, with average wage premiums of 48% and 9% in the construction and manufacturing sectors, respectively; the wage premium associated with unionized workers also varies by occupation and geography [32]. Even large changes in annual wages have a relatively small influence on installed wind and solar project costs. For example, increasing annual wages from the 25th to 75th percentile wage rate for jobs in the construction sector (from $35 870 to $68 690) reported by the U.S. Bureau of Labor Statistics (BLS) increases utility-scale solar installed capital costs by 10%; similarly, increasing wages from the non-union to the union median wage rate ($45 136–$65 364) increases installed capital costs by 6%.
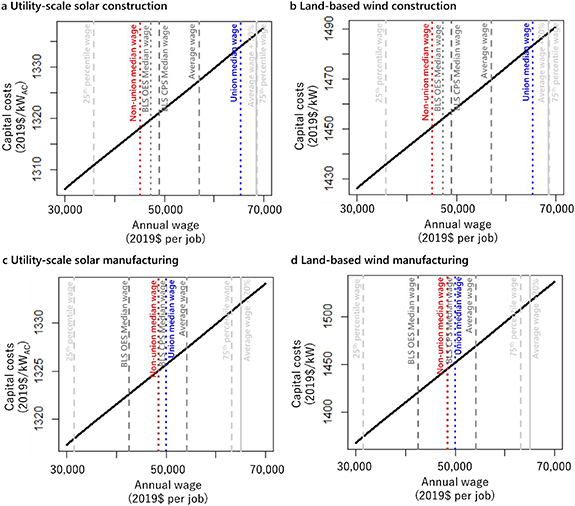
Figure 1. Sensitivity of 2018 capital costs to changes in annual wages for construction and manufacturing sector jobs for utility-scale solar and land-based wind. For comparison, 2019 annual wage estimates for the construction and manufacturing sector, including 25th percentile, median, average, and 75th percentile wages reported in the U.S. BLS Community Population Survey (CPS) (dotted lines), median, union median, and non-union median wages reported in the U.S. BLS Occupational Employment Statistics (OES) (dashed lines), and U.S. BLS OES average wage plus 20% (solid lines).
Download figure:
Standard image High-resolution imageLabor policies may also be designed to induce domestic manufacturing along wind and solar PV supply chains. With respect to products along the crystalline silicon PV supply chain, there is virtually no domestic manufacturing of polysilicon, ingots, and wafers, whereas 15% of cells, 11% of modules, and 37% of inverters are produced domestically [20, 21, 33]. Almost all cell and module imports (as of 2020) are from Asia [22]. Increasing domestic content shares by ten percentage points (e.g. increasing the domestic content share of cells to 25%) across the PV supply chain (excluding upstream materials and products such as steel and aluminum) results in a 1% increase in average installed solar PV capital costs, as shown in figure 2. Solar projects sourcing 100% domestic content from across the full polysilicon PV supply chain would have installed costs just 7% higher than current average costs (figure 3).

Figure 2. Sensitivity of baseline capital costs to changes in domestic manufacturing shares and labor costs. Percent increases in labor costs and percentage point increases in domestic manufacturing shares are relative to baseline estimates for average labor cost and current domestic content circa 2020.
Download figure:
Standard image High-resolution image
Figure 3. Utility-scale solar capital costs based on alternative labor cost premium and domestic manufacturing share assumptions. Costs are in units of $ W−1-ac. Green bars indicate the total capital cost premium above the baseline scenario. All estimates are for circa 2020 and exclude tariffs for imported products.
Download figure:
Standard image High-resolution imageThe U.S. has substantial domestic manufacturing of many land-based wind products with a domestic manufacturing share of approximately 79% (as of 2019), which is a capital cost-weighted average across the multiple segments of the wind product supply chain including nacelle assembly (90%–100%), blades (40%–70%), and towers (65%–85%) [31, 34–36]. There is no current domestic manufacturing for offshore wind products. High domestic content shares partially stem from high international shipping costs for large wind turbine components, making domestic products more competitive. Imports of wind products (as of 2019) come from several different regions, with generating set imports largely from Europe, tower imports largely from Asia, and blades and hubs from North America, South America, Europe, and Asia [36]. We estimate that increasing the domestic manufacturing share does not have a discernible influence on wind power capital costs, which in part is because the price spread between domestically-produced and imported wind products is not well established based on available data.
Increases in both labor costs and domestic manufacturing shares may have a compounding effect, which is most evident in utility-scale solar. However, even in a relatively extreme case in which compensation for all workers is increased 20% and 100% of manufacturing is performed domestically, baseline capital costs increase by no more than 11% for utility-scale solar, 5% for land-based wind, and 4% for offshore wind, as shown in figures 3 and 4.
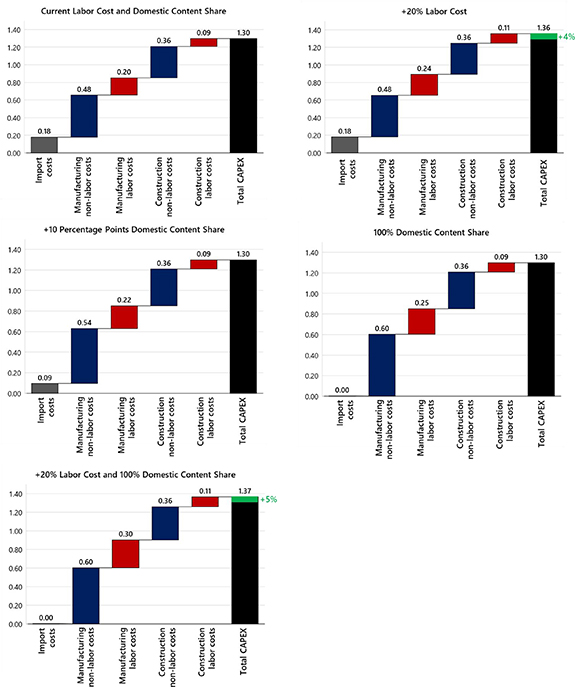
Figure 4. Land-based wind capital costs based on alternative labor cost premium and domestic manufacturing share assumptions. Costs are in units of $ W−1. Green bars indicate the total capital cost premium above the baseline scenario. All estimates are for circa 2020 and exclude tariffs for imported products.
Download figure:
Standard image High-resolution imageIncreases in labor productivity have the potential to offset the impact of higher labor costs and domestic manufacturing shares. For example, a 20% increase in domestic labor costs can be offset by a countervailing increase in domestic labor productivity by 20%. Labor productivity increases can be induced by a variety of factors. Higher labor compensation may increase worker retention and contribute to associated productivity improvements. There is historical evidence that unionized labor is more productive [37]. Heterogeneity in firm-level productivity is also observed. As such, while prevailing wage requirements may increase wages, total labor costs may not increase; in states with prevailing wage laws, worksite productivity is 14%–33% higher [38, 39].
Increasing labor productivity through automation and learning has historically contributed to declining technology costs, making low-carbon technologies significantly more cost competitive over the past decade. There have been historical short- and long-term trends of increasing labor productivity in the manufacturing sector, in addition to rapid increases in productivity in the construction sector associated with solar installation as well as in other historic energy transitions such as the shale gas boom [9, 40].
Future trends of declining renewable technology costs entail, in part, that industries continue to economize on labor; increasing labor productivity (in addition to increasing technological efficiency and changing material costs) is an underlying assumption of declining technology cost projections such as the NREL Annual Technology Baseline (ATB) that is commonly used by policy-makers, planners, and analysts to evaluate decarbonization policies and pathways. In addition, solar and wind industries and associated workforces must rapidly expand to meet a net-zero goal by 2050 [6], and given the relatively small size and nascence of the existing solar and wind sectors, it is anticipated that labor productivity will continue to increase, although the extent and pace of productivity changes are uncertain. Technology costs are projected to decrease over time by a much greater magnitude (e.g. 20%–37% for utility-scale solar PV, land-based wind 18%–25%, and 23%–32% offshore wind from 2020 to 2030 [41]) than the potential premium in installed project costs related to adopting high road labor practices.
1.2. Influence of high road labor practices and policies on economy-wide net-zero transitions
We examine the influence of high road labor practices and policies on the cost and technology mix associated with techno-economic pathways to achieve net-zero emissions in the U.S. by mid-century. Specifically, we determine how solar and wind technology capital and O&M cost increases associated with labor cost premiums and increased domestic manufacturing shares influence the deployment of renewables and the total investment cost of transitioning the economy.
This work builds from the bottom-up cost break-downs that isolate the role of labor and domestic manufacturing in installed solar and wind project costs outlined in the previous sections as well projections of future cost decreases. We also leverage the techno-economic modeling framework used in the Princeton NZA study to determine cost-optimized energy supply pathways [6]. Here, we focus on a cost-optimal pathway in this study, although there are many alternative techno-economic pathways to achieve net-zero emissions each with varying degrees of renewables deployment and electrification rates. We employ the same suite of modeling assumptions used in the NZA project, with the exception of solar and wind technology capital and O&M cost projections, which are modified to reflect alternative assumptions regarding labor costs and domestic manufacturing shares. Specifically, we model two bounding scenarios that reflect a range of assumptions: (a) labor costs and domestic manufacturing share are consistent with 2019 NREL ATB mid-range cost projections, as a baseline case, and (b) labor costs reflect the 75th percentile of construction and manufacturing sector wages and the domestic manufacturing share of products is 100%. This second scenario reflects a likely upper bound on the impact of high road labor policies.
Through modeling alternative techno-economic pathways, we show that increasing labor costs and/or domestic manufacturing shares has minimal impact on the deployment of solar and wind capacity. As shown in figure 5, the pace and scale of utility-scale solar, land-based wind, and offshore wind capacity additions are approximately equivalent between the two net-zero transition scenarios, with a 4-fold increase by 2030 and 18-fold increase by 2050 (relative to 2020). As depicted in figure 6, solar and wind comprise an increasing share of electric power generation over time across both scenarios (12% in 2020, 86% in 2050), while fossil fuels represent a declining share (61% in 2020, <5% in 2050). The pace of the transition will be further influenced by social and political constraints and accelerants, including potential labor shortages; there is already evidence of hiring difficulties in solar and wind [42, 43], portending continued employment bottlenecks in future decarbonization absent effective labor organization, planning, and federal support [9].

Figure 5. Average annual solar and wind capacity additions associated with alternative U.S. decarbonization pathways to achieve a net-zero emissions goal by mid-century. Baseline decarbonization scenario at left assumes current domestic manufacturing shares of utility-scale solar and wind and average wages across sectors. The alternative high road scenario at right assumes that all workers associated with utility-scale solar and wind manufacturing, installation, and O&M are paid 75th percentile wages for a given economic sector and that 100% of the manufacturing supply chain is domestic.
Download figure:
Standard image High-resolution image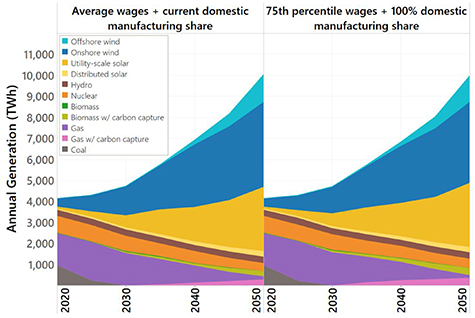
Figure 6. Annual electric power generation by resource as the U.S. energy system decarbonizes to achieve a net-zero emissions goal by mid-century. Baseline decarbonization scenario at left assumes current domestic manufacturing shares of utility-scale solar and wind and average wages across sectors. The alternative high road scenario at right assumes that all workers associated with utility-scale solar and wind manufacturing, installation, and O&M are paid 75th percentile wages for a given economic sector and that 100% of the manufacturing supply chain is domestic.
Download figure:
Standard image High-resolution imageEven with higher labor costs, solar and wind technologies remain a pillar of decarbonization and cost competitive relative to other technologies. The modeled changes in labor costs are minimal compared to other production factors contributing to uncertainty and heterogeneity in technology cost projections and total system costs, such as labor productivity trends, improving system controls, and declining material costs.
High road labor practices in the solar and wind sectors have a small impact on the cost of transitioning to a net-zero energy system. Figure 7 shows that there is a small difference in energy supply-related investment costs from adopting high road labor policies and practices in the wind and solar sectors. The total net-present value of supply-side investment cost over the entire transition period from 2020 to 2050 is $3.9 T, assuming a 2% social discount rate and average wage rates and the current domestic manufacturing shares. As a bounding scenario, if wages increase to the 75th percentile rate and all solar and wind products are produced domestically, the total supply-side investment costs are $4.0 T from 2020 to 2050, an increase of approximately 3%. Cumulative cost increases through 2040 are almost imperceptible, with most of the cost increase accruing in the 2040s (see figure 7). This scenario represents a relative upper bound on the impact of a high road labor pathway on net-zero energy system transition costs. More moderate increases in domestic content share or lower wage premiums would have correspondingly smaller cost impacts.
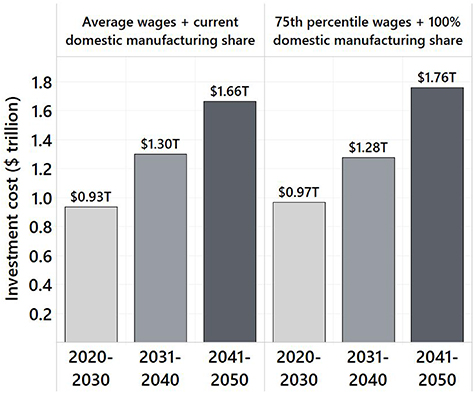
Figure 7. Supply-side investment costs by decade associated with alternative U.S. decarbonization pathways to achieve a net-zero emissions goal by mid-century. Investment costs include all supply-side capital costs across the energy system (including solar and wind capital costs). Baseline decarbonization scenario at left assumes current domestic manufacturing shares of utility-scale solar and wind and average wages across sectors. The alternative high road scenario at right assumes that all workers associated with utility-scale solar and wind manufacturing, installation, and O&M are paid 75th percentile wages for a given economic sector and that 100% of the manufacturing supply chain is domestic.
Download figure:
Standard image High-resolution image1.3. Influence of high road labor practices and policies on labor outcomes under net-zero transition scenarios
We examine the influence of high road practices and policies on labor outcomes associated with transitioning to a net-zero emissions energy system in the U.S. by mid-century. We use the DEERS model [9], adopting the cost optimal techno-economic pathways described in the previous section as input. We model direct employment and wages associated with solar and wind manufacturing, installation, and O&M under different wage rate and domestic manufacturing share assumptions 4 .
We show that increasing the domestic manufacturing share of solar and wind products has the potential to substantially increase domestic manufacturing employment as the U.S. transitions to a net-zero energy system. Estimates reflect labor demand, and domestic labor supply constraints may influence the employment outcomes of implementing high road labor policies. At current domestic manufacturing shares, utility-scale solar and wind sectors support an annual average of approximately 450 000 jobs in the 2020s, as shown in figure 8. Increasing the domestic manufacturing share of solar and wind products by ten percentage points across the supply chains has the potential to support an additional 45 000 jobs annually in the 2020s. Over the long-term, as the U.S. energy system continues to decarbonize, an additional 95 000 jobs are supported in the 2040s, an increase of 5% in total wind and utility-scale solar sector employment.
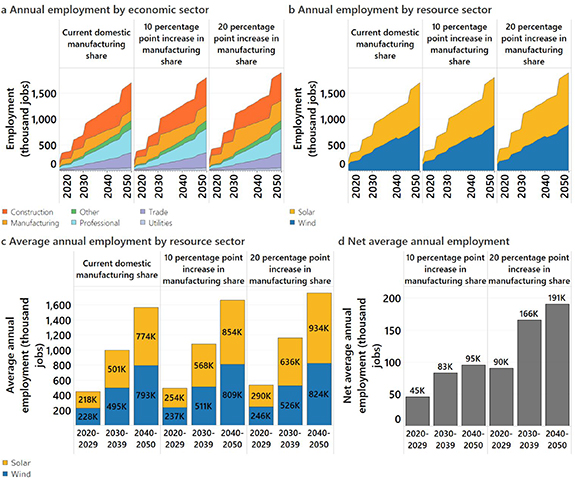
Figure 8. Impact of a 10 or 20 percentage point increase relative to current domestic manufacturing share on utility-scale solar, land-based wind, and offshore wind employment for the U.S. as the energy system decarbonizes to achieve a net-zero emissions goal by mid-century. (a) Annual employment by economic sector, (b) annual employment by resource sector, (c) average annual employment by resource sector and decade, and (d) net increase in average annual employment by decade.
Download figure:
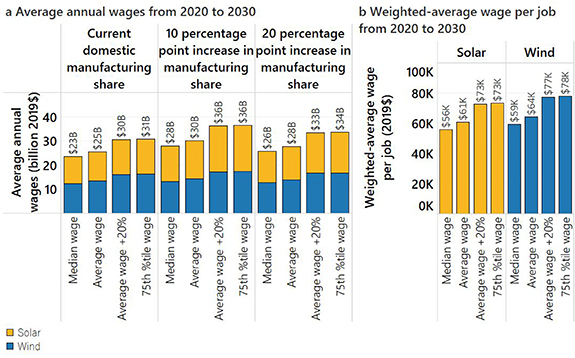
Standard image High-resolution imageWe further evaluate the impact of increasing wage rates. As shown in figure 9(a), approximately $25 billion in aggregate annual worker wages are generated in the 2020s from expanding solar and wind manufacturing and electric power capacity, assuming average occupational wage rates. Increasing the occupational wages (or equivalent compensation) for all workers across domestic wind and solar supply chains by 20% has the potential to generate an additional $5 billion in aggregate annual wages in the 2020s. An increase in wages by 20% is equivalent to a $12 000 and $13 000 increase in average annual wages per worker for the solar and wind sectors, respectively, as depicted in figure 8(b). Aggregate wages paid to workers in the wind and solar sectors increase over time as capacity expands, and wages are further augmented if a higher share of manufactured products are produced domestically.
Figure 9. Impact of domestic manufacturing share and wage premiums on wind and solar wages for the U.S. as the energy system decarbonizes to achieve a net-zero emissions goal by mid-century. (a) Annual total wages paid by economic sector and (b) weighted-average annual wages per job by resource sector.
Download figure:
Standard image High-resolution image
1.4. Policy implications
Analysis in the previous sections, including the sensitivity of wind and solar technology costs to increased labor costs and domestic manufacturing shares, are neutral to the policy and market mechanisms that may generate these changes. Prevailing wage or minimum wage standards in government contracting, private sector hiring practices, unionization, business cycles, unemployment levels, labor supply shortages, and the relative competitiveness of domestic manufacturing can all influence labor costs and domestic manufacturing shares in the wind and solar sectors.
Additionally, various public policies such as tax credits, workforce development funding, and other instruments can redistribute the costs of implementing high road labor practices and support both firms and workers. For example, tax credits and similar public policy instruments may support higher domestic content shares across the utility-scale solar supply chain or minimum compensation standards in the solar sector. Based on 2020 capital costs (assuming there are no tariffs on PV modules and cells), a 7% investment tax credit or equivalent subsidy of similar magnitude for installed solar PV systems would fully offset the cost of using 100% domestic content across the full supply chain. A subsidy tied to a requirement to use only domestic cells, modules, and inverters would need to be 4% of the cost of installed solar PV systems to fully offset the increase in average project costs. Similarly, a 20% increase in installation and construction labor costs would increase the installed cost of solar PV and wind projects by only 3% and 1%, respectively, meaning that a nominal subsidy could fully offset the impact of high road labor practices on the cost of installing renewable energy. Wind and solar resources have generally enjoyed public policy support at both state and federal levels. Any tax incentives or policy support to offset the costs of high road labor practices or greater domestic manufacturing could be additive to other policies and contingent upon minimum compensation standards or specific domestic content share, giving flexibility to firms. The level of a future tax credit may be adjusted to account for the changing price spread between domestically and globally manufactured renewable energy products, in addition to interactions with other policies such as tariffs on solar modules that have historically had a large influence on imports and domestic supply. Furthermore, the durability of a tax credit to support domestic manufacturing, as well as the temporal lag in growing domestic manufacturing capacity, must be considered in the policy design.
Tax incentives and other subsidies alone are not necessarily sufficient to induce high road labor practices, however, given that manufacturing and development decisions are idiosyncratic, influenced by other cost signals and non-cost factors, and vary across product supply chains. Moreover, this study does not model market interactions, and thus, further investigation of the impact of policy on high road practices and net cost impacts for wind and solar installations is needed.
In performing this analysis, there were some notable gaps in availability of data relevant to assessing labor costs and domestic content within the solar and wind supply chains. Our work takes advantage of the best available and most recent public data, but faces limitations and uncertainties. In particular, there were a lack of robust data regarding the price spread between domestic and globally sourced wind products, in addition to labor shares associated with balance of system costs for wind and solar. Absent robust data for several key parameters, we selectively conducted bounding analyses. As the socioeconomic impacts of energy transitions are highly salient to policy makers and stakeholders and can potentially act as accelerants or bottlenecks for the pace of net-zero transitions, additional effort from government statistical agencies and researchers to regularly and accurately quantify and report data on labor costs, employment levels, domestic supply chains, and other pertinent data would facilitate improved decision support and policy design.
Overall, this study demonstrates that high road labor practices and policies have a small influence on wind and solar PV costs as well as the cost and pace of net-zero transitions. Such practices are thus unlikely to impede the pursuit of least-cost decarbonization strategies, while generating substantial benefits for U.S. workers and communities. Tradeoffs and synergies between climate and social equity objectives can be real, but they are context specific and the magnitude of such tradeoffs requires quantification. Within the scope and limitations of this study, we find minimal evidence that climate and high road labor objectives in the wind power and solar PV sectors are in conflict.
Data availability statement
The data that support the findings of this study are available upon reasonable request from the authors.
Acknowledgment
The authors appreciate comments on earlier drafts from Ryan Wiser, David Feldman, and R Brent Alderfer. Any errors or omissions are the responsibility of the authors alone.
Funding
This project was sponsored by the BlueGreen Alliance.
Footnotes
- 3
The following baseline technology specifications, consistent with NREL benchmark studies [23, 24], are assumed: one-axis tracker, 100 MW, Tier 1 mono-crystalline-silicon PV modules; 200 MW land-based wind plant comprised of 2.6 MW land-based wind turbines with a 121 meter (m) rotor diameter and 90 m hub height; 600 MW offshore wind plant comprise of 6.1 MW turbines with fixed or floating bottom, 151 m rotor diameter, and 102 m hub height.
- 4
We evaluate the following four scenarios in which we modify occupation-level wages: (a) median wages reported by the U.S. BLS, (b) average wages reported by the U.S. BLS, (c) average wages plus 20%, and (d) 75th percentile wages reported by the U.S. BLS. In addition, we evaluate the following two domestic manufacturing scenarios in which we modify the domestic manufacturing shares of solar and wind products: (a) current domestic manufacturing shares, and (b) ten percentage point increase in domestic manufacturing share across all segments of the supply chain. We model labor outcomes for the entire U.S. as well as for each state to reflect geographic wage variation.