

Abstract
Human-induced fires play a crucial role in transforming landscapes and contributing to greenhouse gas emissions. Russia is a country where human-induced fires are widespread and form distinctive spring and summer burning cycles. However, spring fires are not well documented and it is unclear which land-cover types are associated with the spread of spring fires. Using Sentinel-2 optical satellite imagery, a wall-to-wall spring burned area data set for 1 January to 15 May 2020 was created for Russia (excluding the Arctic) using a participatory crowdsourcing digitizing approach on an online platform developed specifically for this application. The 2020 spring fire product had a producer accuracy of 85% and user accuracy of 92%. Approximately 13.38 million ha, comprising 1.8% of the study area, were mapped as burned, with the majority of the 2020 spring burned areas in Siberia. Our spring-fire product revealed five times more burned area estimates compared to the burned area estimates from the moderate resolution imaging spectroradiometer (MODIS) MCD64 product. We also found high variability of burned area per active fire pixel across regions of Russia, when compared to MODIS and visible infrared imaging radiometer suite active fire data. Spring fires started to increase from the end of February and reached their maximum by the end of March through the middle of April. Spring fires were associated with arable lands and grasslands as land-cover types, except Siberia, where spring fires were most common in deciduous and needle-leaved forests, followed by arable lands. While spring fires were associated with croplands and grasslands, an estimate for Central Russia showed approximately 75% of spring fires occurred on abandoned agricultural lands. Our study demonstrated the suitability of optical Sentinel-2 imagery for spring fire mapping and the great utility of a participatory mapping approach for fast and accurate mapping as well as engagement of the community.
Export citation and abstract BibTeX RIS

Original content from this work may be used under the terms of the Creative Commons Attribution 4.0 license. Any further distribution of this work must maintain attribution to the author(s) and the title of the work, journal citation and DOI.
1. Introduction
Human-induced fires play a crucial role in transforming landscapes, impacting biodiversity, and as sources of greenhouse gas (GHG) and other non-GHG emissions that negatively affect human health (Syphard et al 2007, van der Werf et al 2010, McCarty et al 2012, Archibald et al 2013). Climate change may increase the likelihood of wildfires in the future (Jolly et al 2015) that will emit more GHGs and subsequently contribute to a warming climate (Warneke et al 2009). Russia, which is the largest country in the world in terms of surface area, where wildfires are responsible for 20% of global black carbon emissions (Department of the Interior, Environment, and Related Agencies Appropriations Act 2012), which as a short-lived climate forcer contributes to sea ice melt in the Arctic (Quinn 2011). Russia was the source for 6% of the CO2 emissions from biomass burning globally from 2015 to 2019 (Pan et al 2020). Wildfires also negatively impact local air quality.
Previous research using coarse-resolution satellite products found that between 2002 and 2012, 77% of all fire detections across all land cover types (including forest fires) occurred in agricultural lands throughout European Russia (McCarty et al 2017), with fires in shrublands, grasslands, and forests common throughout Russia during the months of March through October (Hall and Loboda 2017). While climate change-driven shifts in the fire regime contribute to the spread of wildfires throughout Russia (Shvidenko and Schepaschenko 2013, Schaphoff et al 2016), the fires in temperate and southern Russia are predominantly human-induced (Mollicone et al 2006, Frolov et al 2014). Therefore, timely observation of fires and attribution to the proximate causes are essential to guide fire management and climate change policies.
Annual statistics derived from moderate resolution imaging spectroradiometer (MODIS) thermal anomalies (Giglio et al 2016) showed distinct annual peaks of fire activity in Russia, with 'spring' seasonal burning in April and May and 'summer' burning of crop residues and forest fires in July and August (McCarty et al 2017, Kirillina et al 2020). Though summer forest fires were well documented in previous studies (Krylov et al 2014, Ivanova et al 2017, Duncan et al 2020, Kirillina et al 2020), the patterns of spring fires remain elusive for a variety of reasons (Hall and Loboda 2018, Hayasaka et al 2020). Crop residue burning is prohibited in Russia, thus official federal and regional statistics are not collected. Spring fires are less intense compared to summer wildfires, and therefore, it is more difficult to document them accurately with satellites that depend on thermal signatures for detection, such as 1 km MODIS hotspots and the 375 m visible infrared imaging radiometer suite (VIIRS) active fire products. This underscores the need for a detailed evaluation of spring fires with finer spatial resolution than MODIS.
As early as the 1980s, 1.1 km advanced very high-resolution radiometer data allowed for the reconstruction of wildfire dynamics (Dubinin et al 2010, Otón et al 2019). Starting from 2000, MODIS on both Terra and Aqua satellites detected daily global fires, with an omission error as high as 40% due to cloud cover, the mismatch between the wildfires and overpass time, and smoke (Giglio et al 2003). Launched in 2011, VIIRS active fires are mapped at a 375 m spatial resolution (Schroeder et al 2014). While 30 m Landsat imagery, such as the current Landsat-8 operational land imager and thermal infrared sensor instruments, are used to map fire patterns at greater spatial resolution, the revisit time of 16 d dramatically reduces the ability to capture short-lived fire dynamics (Dara et al 2020). The European Space Agency's Copernicus satellite program provides unprecedented free access to 10–20 m optical data starting in 2015 from the Sentinel-2 MultiSpectral Instrument (MSI), with revisits up to 4 d and is suitable for mapping burned areas (Roy et al 2019).
Satellite remote sensing plays a fundamental role in obtaining information on the patterns and dynamics of fires in Russia (McCarty et al 2012, Evans et al 2017, Hall and Loboda 2017). In situ data on the burning of crop residues as well as old grasses and abandoned fields are not captured in the official statistical reports (FBI 'Avialesokhrana' 2020) or addressed in federal law (Federal Fire Safety Law of the Russian Federation 1994, Forest Code of Russian Federation 2006). Also, ground and aerial surveys performed by the Forestry Service and the Ministry of the Emergency of the Russian Federation are infrequent and severely underestimate the patterns and rates of wildfires (Ministry of Natural Resources and Environment of the Russian Federation 2016). Until the end of 2018, the Ministry of Emergency Situations of Russia prescribed that fires resulting from burning of dry grass, crop residues, and stubble that did not cause fires in surrounding landscapes or buildings would not be subject to statistical accounting (EMERCOM of Russia 2008). See the details on fire monitoring and federal statistics approach in supplemental materials 1 (available online at stacks.iop.org/ERL/16/125005/mmedia).
There has been strong evidence of widespread agricultural land abandonment in Russia which may contribute to the spread of wildfires at local to regional levels (Dubinin et al 2011, McCarty et al 2017, Dara et al 2020). Following the breakup of the Soviet Union, Russia underwent the transition from a state-command to a market-driven economy, including restructuring of the agricultural sector (Rozelle and Swinnen 2004) and land privatization (Shagaida 2005). As a result of this transition, many agricultural areas ceased to be actively managed and became abandoned (Prishchepov et al 2012, Alcantara et al 2013, Schierhorn et al 2013). Official estimates indicate that from 1990 to 2010, approximately 50 million hectares (Mha) of cropland were abandoned (Swinnen et al 2017, Lesiv et al 2018). The recent all-Russia Agricultural Census in 2016 suggested that up to 90 Mha of formerly managed agricultural lands (both croplands and grasslands) could be abandoned by 2016 (Uzun and Lerman 2017). Similar to burning, the land abandonment extent and patterns remain elusive due to differences in the definition of abandonment, resolution and revisit of employed satellite sensors and reliability of the official statistics (Schierhorn et al 2013). At the same time, the dead, dried grasses and herbaceous biomass present on abandoned fields in the springtime can serve as an ideal fuel for fires (Dubinin et al 2010, Dara et al 2020). Hence, knowledge of the contribution of abandoned lands to the spread of spring fires is crucial.
Crowdsourced participatory mapping can be a solution for rapid land-change assessment, including natural disasters and emergencies (Zook et al 2010, Hicks et al 2019, Hunt and Specht 2019). Participatory mapping can be defined as a common or shared spatial platform to integrate knowledge about complex landscapes and geographic phenomena from multiple users (Alhamwi et al 2017), often from a shared physical or virtual community (Brown and Kyttä 2018). Crowdsourced efforts have been successful in mapping rapidly changing land-use dynamics in an urban area (Vaz and Jokar Arsanjani 2015). Simplified categorization for the participants in participatory mapping tends to produce more accurate results (Jokar Arsanjani et al 2015), while the spatiotemporal resolution of imagery can limit the accuracy of crowdsourced maps when the targeted features are smaller than the pixel size of the available imagery (Westrope et al 2014). Participatory mapping can expand reference data sets needed for future products (Fritz et al 2017), while also producing a more detailed analysis of surface characteristics (Schultz et al 2017). Given the challenges of using remote sensing data to characterize early-season burning in Russia (Hall et al 2016), large-scale participatory mapping could potentially provide the necessary burned area data to document fine spatiotemporal dynamics of springtime burning.
The aim of this study was to produce the first comprehensive high-resolution (<30 m) spring burned area map for the Russian Federation for 2020 from the participatory mapping of 10–20 m Sentinel-2 products. Using the 2020 spring season burned area product, we evaluated whether spring fire patterns coincided with widespread land abandonment (Khanina et al 2018), fires in natural areas, or burning of agricultural fields, which is an annual fire event well documented in the literature (McCarty et al 2012, Liu et al 2021).
2. Data and methods
2.1. Study area
This analysis focused on spring burning from 1 January until 15 May 2020 across much of Russia. For the convenience of data handling, we subdivided Russia into a grid of 50 × 50 km squares (figure 1). Due to high snow cover, we excluded from our analysis the northernmost Artic and sub-Artic regions that were deemed too cold for fire conditions before the middle of May (i.e. likely to be covered in snow, ground frozen), like the Sakha Republic. We also excluded the northern parts of the Republic of Karelia, Krasnoyarsk and Khabarovsk Krais, and Irkutsk, Tomsk, and Arkhangelsk Oblasts because of relatively colder climatic conditions compared to the rest of the study area. In total, an area of 747 Mha, or 44% of the Russian Federation, was designated for mapping spring burning.
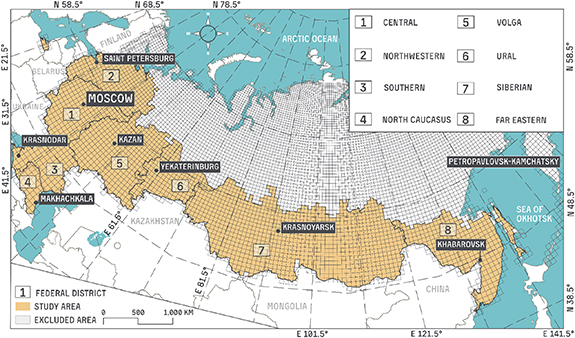
Figure 1. Study area (light brown) with major cities is the study area, while grey is the excluded area. Numerical labels indicate Federal Districts. The grid overlay shows the 50 × 50 km sectors used to assign and monitor participatory mapping of spring burned areas.
Download figure:
Standard image High-resolution image2.2. Participatory mapping to produce spring burned area product
The spring burned area product was derived from 10 m true-color and 20 m false-color Sentinel-2 MSI images. The trained volunteers manually digitized the perimeter of burned areas of a minimum area of 1 ha at 1:20 000 scale on an online platform, specifically designed and developed to map fires (see supplemental materials 2). The Sentinel-2 MSI true-color and a false-color combination of short wave infrared (SWIR; band 11 at ∼1610 nm), near-infrared (VNIR; band 8 at 832 nm), and blue (band 2 at ∼492 nm) were used to assist in digitizing burned areas (Roteta et al 2019). Optical Sentinel-2 images were chosen due to high temporal resolution (5–7 d revisits) and higher spatial resolution of 10–20 m compared to 16 d 30 m Landsat imagery. We specifically selected open-access satellite imagery because of the large study area.
The volunteers who contributed to participatory mapping were recruited by Greenpeace Russia (https://greenpeace.ru) from the wildland firefighting community, GIS practitioners, and Russian-speaking citizens concerned with environmental issues. In total, 352 volunteers manually digitized spring burned area polygons on Sentinel-2 MSI satellite imagery inclusive of the dates of 1 January to 15 May 2020, followed by a quality check of the spring burned area product by several GIS experts at Greenpeace Russia.
2.3. Validation of spring burned area product
According to good practice recommendations, accuracy and land cover change area estimates should be derived from a probability sample of reference data, where reference data are defined as the best practically available assessment of ground condition (Olofsson et al 2014). The present study uses a stratified sampling approach (Olofsson et al 2013, 2020, Stehman 2014) to estimate the accuracy of the burned area product and the total burned area that occurred in the Russian Federation during spring of 2020.
2.3.1. Stratification of study area
The purpose for stratifying the study area was to improve the precision of the estimates of accuracy and burned area by delineating regions (strata) associated with different fire probability reference values. For each of the eight Federal Districts (figure 1), we partitioned the area into three strata. Stratum 1, representing 2% of the study area, consisted of the area mapped as burned in spring 2020. Stratum 2, representing 30% of the study area, was defined as area with likely high probability of fire, but not detected as burned by the participatory mappers. To create this stratum, all 1 km MODIS active fire pixels (not included in stratum 1) from 2002 to 2020 were buffered by a 0.015 decimal degrees distance (∼2 km or two MODIS pixels) to include areas which were likely to represent map fire omission (Tyukavina et al 2013). Stratum 3 was comprised of area with a low probability of fire and represented 68% of the study area. Stratum 3 included all other area not included in strata 1 and 2. Then, a simple random sample was selected from each of these three strata: 'burned area stratum' (spring burned area product); 'high probability fire stratum' (within the associated MODIS active fire buffer); and 'low probability fire stratum' (the rest of study area). Area and sample size allocation for each stratum are presented in table 1. Additional details of the strata definitions are provided in supplemental materials 3.
Table 1. Sample size allocation to strata of the 435 sample points selected for each federal district (sample size in stratum h is denoted as nh).
| Federal districts | Stratum 1 area (Mha) | Stratum 2 area (Mha) | Stratum 3 area (Mha) | n1 | n2 | n3 |
|---|---|---|---|---|---|---|
| Total | 13.38 | 228.1 | 505.1 | 1000 | 1209 | 1271 |
| Siberian | 7.12 | 85.0 | 207.5 | 125 | 139 | 171 |
| Far Eastern | 2.78 | 28.6 | 69.5 | 125 | 139 | 171 |
| Central | 1.73 | 34.5 | 28.5 | 125 | 219 | 91 |
| Southern | 0.58 | 14.7 | 26.4 | 125 | 163 | 147 |
| Volga | 0.44 | 32.5 | 69.7 | 125 | 149 | 161 |
| Northwestern | 0.34 | 8.2 | 60.7 | 125 | 65 | 245 |
| North Caucasian | 0.20 | 6.4 | 10.3 | 125 | 171 | 139 |
| Ural | 0.16 | 18.2 | 32.3 | 125 | 164 | 146 |
2.3.2. Sample size allocation within study area
A total of 3480 points were sampled, distributed equally across all federal districts (435 points for each) from the study area (figure 1) via stratified random sampling. The sample size and allocation decisions within districts were based on the expected proportion of the stratum area that was actually burned. We specified a minimum sample size of 125 for stratum 1 to ensure an adequate sample size for the key objective of estimating user's accuracy (UA) of the fire map. For example, if UA is truly 70%, a sample size of 125 would yield an expected standard error of 3.6% for estimated UA. The remaining two strata sample sizes were calculated based on the optimal allocation formula for the objective of minimizing the variance of the estimated burned area from the reference classification (table 1). Details of the sample allocation planning process are provided in supplemental materials 3.
2.3.3. Interpretation protocol and validation analysis
We involved two groups of geospatial and fire experts during the validation, including Russian-speaking experts with extensive field experience in monitoring the Russian environment. First, geospatial experts with substantive field experience in the identification of wildfires and human-caused fires in Russia, independently interpreted the 3480 sample points and determined if these locations had been burned or not. Then, several external experts from Greenpeace Russia and the authors interpreted a subset of the sample points selected based on the burn probability, with the final reference label decided based on consensus. The reference class interpretation was conducted, with some modification, on the same platform and data that were used for crowdsource mapping where experts labeled each sample point as 'burned' or 'not burned' using a series of Sentinel images and active fires datasets. Details of the interpretation protocol and steps of analysis are provided in supplemental materials 3.
2.3.4. Accuracy assessment and sample-based area estimates
The sample data were used to estimate error matrices summarizing agreement and disagreement between classified fires and expert interpreter burned area interpretations. Because the three sampling design strata ('burned', 'likely burned', 'not burned') differ from the map classes ('burned' and 'no burned'), overall, UAs, and producer's accuracies (PAs) and their accompanying standard errors were estimated using formulas from Stehman (2014) as implemented in the GLAD Toolbox v.1.1 (Potapov et al 2020). The 95% confidence interval (CI) was obtained by multiplying the standard error by 1.96 and adding and subtracting the resulting margin of error to the estimate. Error matrices and example calculations of the overall, UAs, and PAs are provided in supplemental materials 5.
2.4. Analysis of temporal and spatial distribution of spring fires
We complemented crowdsourced burned area data with analysis of coarse resolution active fire and burned area products to determine spatial-temporal patterns of spring fires. The 1 km MODIS Collection 6 product (MCD14; Giglio et al 2003, 2016) and 500 m resolution burned area product (Giglio et al 2018, Boschetti et al 2019) were combined with 375 m VIIRS active fire detections (Schroeder et al 2014), from both Suomi-NPP and NOAA-20. These data were downloaded from NASA FIRMS (NASA Earthdata 2020). A spatial intersection of active fire data and the Sentinel-2 spring burned area products was used to determine timing of a single fire (including fire duration) for each mapped polygon. If MODIS or VIIRS active fire data did not coincide with the crowdsourced burned area, the first Sentinel-2 imagery date that a burned area was detected became the default 'approximate' day of the burn. Given that likely cloud cover obscured both the Sentinel-2 burned area mapping and the active fire products during the study period, some fire timing and fire duration uncertainties persist.
Land cover of each burned area polygon was determined from several data sets: the European Space Agency's 300 m Global Landcover Maps for 2015 (CCI-LC; Bontemps et al 2013) and the European Space Agency 100 m Global Landcover Map for 2019 (Buchhorn et al 2020) which employs the United Nations Land Cover Classification System land cover schema (Ahlqvist 2008), and 30 m Global land cover and land use 2019 dataset (Hansen et al 2021) with focus on terrestrial and wetland tree height classes. We used a generalized seven class scheme for distribution patterns analysis (supplemental materials 4, supplemental tables 5 and 6). The 300 m dataset allowed us to separate arable and arable mosaic classes and different forest classes. However, it overestimated arable lands likely due to its coarse spatial resolution, although it better retained the overall geographic distribution. The 100 m dataset allowed us to identify arable (not simply an arable mosaic) at a higher spatial scale, and different types of closed/open forest cover. The 30 m dataset represented fewer classes, when all abandoned/natural meadows /shrublands were merged into a short dense vegetation class, and also forests types only as closed/open. However, this 30 m data set helped us to determine where spring fires occurred on treeless or afforested lands (supplemental materials 4, supplemental table 7). We also used the Russia-specific 30 m Landsat-based map, which included actively cultivated and abandoned agricultural lands (Glushkov et al 2019). We compared the spring burned area product created with Sentinel-2 and 30 m Landsat-based land abandonment patterns. Additional details describing the data for this analysis are presented in supplemental materials 4.
3. Results
Manually mapped spring burned area patterns produced more than 120 000 unique polygons (figure 2(a)), with a total spring fire mapped area of approximately 13.4 Mha (table 1). The estimated spring burned area based on the reference sample of expert interpretations was 14.19 ± 1.37Mha (± denoting 95% CI), or approximately 1.9% of the total study area (table 1). The Siberian Federal District had the largest extent of spring burned area, with an estimated 7.49 ± 1.22 Mha of burned area. However, the Central Federal District of Russia had the highest percentage of spring burned area, with around 3% of the total region burning between 1 January and 15 May 2020. All results are publicly available on the interactive map and in dataset archive (Greenpeace Russia 2020, Drozdovskaya et al 2021) and presented in infographics on the Greenpeace website (Yagodina and Allakhverdov 2020).
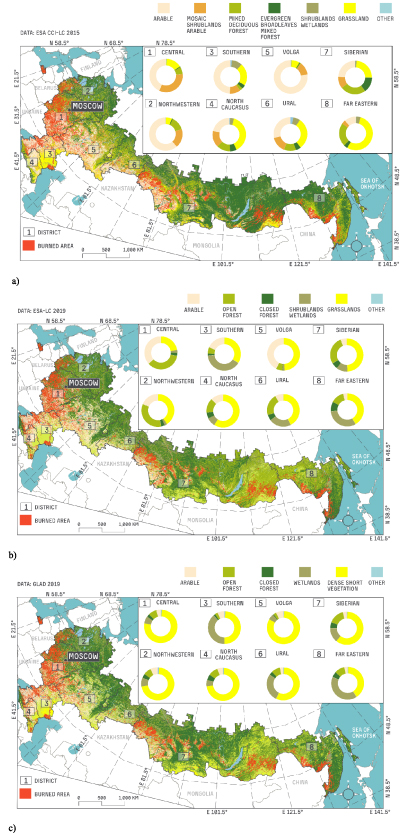
Figure 2. (a) 2020 spring burned-area overlay on 2015 300 m ESA land cover product; (b) 2020 spring burned-area overlay on 2019 100 m ESA land cover product; (c) 2020 spring burned-area overlay on 2019 30 m GLAD land cover product; note the percent of spring burned area by land cover type is provided by Federal District in the upper right.
Download figure:
Standard image High-resolution image3.1. Accuracy and sample-estimated area of the participatory map of spring burned area for 2020
The overall accuracy of the spring burned area product was 99.6%, with burned area UA of 91.9% and PA of 85.4%. For the unburned class, UA was 99.7% and PA was 99.8%. The burned area PA and UA varied among the Federal Districts. Omission errors exceeded commission errors in the Southern, North Caucasian, and Northwestern Federal Districts (figure 3) resulting in the map underestimating burned area (see 'Map Bias' of table 2). For the Far Eastern, the Volga, and the Ural Federal Districts, commission errors of the burned area were more common than omission errors, resulting in an overestimation in these Districts. Even so, the mapped and sample estimated area showed good agreement in most regions (table 2). Sample counts (raw data) for each Federal District and details of the accuracy and sample-based area estimates are provided in supplemental materials 5.
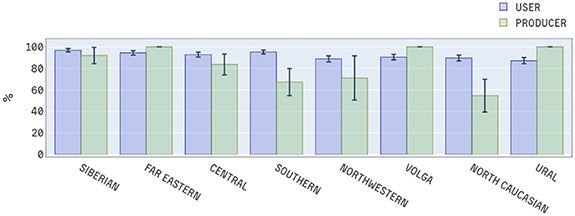
Figure 3. Comparison of UA and PA of 2020 spring burned area product for Russian Federal Districts; black bars represent 95% CIs.
Download figure:
Standard image High-resolution imageTable 2. 2020 Spring burned area estimates for Russian Federal Districts.
| Federal districts | Mapped spring burned area (Mha) | Percent of study area burned (%) | Sample estimate, (Mha), with 95% CI | Percent of study area burned, estimated (%) | Map bias, (Mha) |
|---|---|---|---|---|---|
| Russia | 13.38 | 1.79 | 14.19 ± 1.37 | 1.90 | −0.81 |
| Siberian | 7.12 | 2.37 | 7.50 ± 1.22 | 2.50 | −0.37 |
| Far Eastern | 2.78 | 2.76 | 2.63 ± 0.11 | 2.61 | 0.15 |
| Central | 1.73 | 2.67 | 1.93 ± 0.44 | 2.97 | −0.20 |
| Southern | 0.58 | 1.39 | 0.83 ± 0.31 | 1.98 | −0.25 |
| Volga | 0.44 | 0.43 | 0.40 ± 0.01 | 0.39 | 0.04 |
| Northwestern | 0.34 | 0.50 | 0.44 ± 0.25 | 0.63 | −0.10 |
| North Caucasian | 0.20 | 1.19 | 0.33 ± 0.18 | 1.95 | −0.13 |
| Ural | 0.16 | 0.32 | 0.15 ± 0.01 | 0.29 | 0.01 |
3.1.1. Comparison with coarse resolution burned area and active fire data
The 2020 Sentinel-2-based spring burned area estimates were compared with active fire datasets as well as with the 500 m MCD64A1 burned area product (Giglio et al 2018; table 3). In general, spring burning was underestimated by as much as four times by the MCD64A1 burned area product. Active fire products can be used as a proxy for area burned estimation using the proportion of fire pixels A(i,t) = aNf (i,t), where A is the area burned within some region (i) during fixed time period (t) and Nf is the number of fire pixels (Giglio et al 2006). Here, a is constant (or regression slope coefficient for multiple observation) representing the effective burned area per pixel (Giglio et al 2006). We provide a for area estimation with active fire products for each of the Federal Districts. Our results show that a strongly varied between districts and matches with value (a = 1.3 for MODIS MCD14 hotspots) provided by Giglio et al (2006) for Boreal Asia (this region include Russia completely) only for the Central District. This approach did not take into account the year-to-year variation of clouds during the spring, which affects detection of fires, fire growth rates, and fire distribution in different regions, but even this simple analysis shows an underestimation of fires across Siberia, Far East, and Northwestern Districts with active fire data.
Table 3. Comparison of mapped spring burned area and the 500 m MCD64A1 burned area for the Federal Districts of Russia and coefficients for burned area estimation using active fire data.
| a | |||||
|---|---|---|---|---|---|
| Federal districts | Mapped spring burned area (Mha) | MCD64 burned area, (Mha) | VIIRS + MODIS, (km2 pixel−1) | MODIS active fires, (km2 pixel−1) | VIIRS active fires, (km2 pixel−1) |
| Russia | 13.38 | 3.29 | — | — | — |
| Siberian | 7.12 | 2.18 | 0.8 | 1.8 | 1.5 |
| Far Eastern | 2.78 | 0.54 | 0.8 | 2.5 | 1.2 |
| Central | 1.73 | 0.14 | 0.4 | 1.3 | 0.5 |
| Southern | 0.58 | 0.23 | 0.2 | 0.8 | 0.3 |
| Volga | 0.44 | 0.02 | 0.2 | 1.0 | 0.3 |
| Northwestern | 0.34 | 0.05 | 0.5 | 1.7 | 0.6 |
| North Caucasian | 0.20 | 0.06 | 0.2 | 0.9 | 0.3 |
| Ural | 0.16 | 0.06 | 0.1 | 1.1 | 0.1 |
3.2. Spatial and temporal patterns of 2020 spring fires
3.2.1. Timing of 2020 spring fires
In 2020, spring fires in Russia started to increase by early March (∼Julian Day of the Year, or DOY, 70–80) and reached their maximum from the end of March (DOY 90–100) to the middle of April (DOY 105–115). Spring fires started in late February (DOY 60) in the Southern Federal District and the North Caucasus, and then progressed towards the north, i.e. the Central and Northwestern Federal Districts of European Russia (figure 4). The median fire duration in the middle part of Russia was approximately 1–2 d in the Central, Volga, and Ural Federal Districts, while in the Siberian, Northwestern, and North-Caucasian Federal Districts, individual spring fires lasted 2–3 d. The longest fire durations, upwards of 5–7 d, occurred in the Far Eastern and Southern Federal Districts of Russia (figure 4).
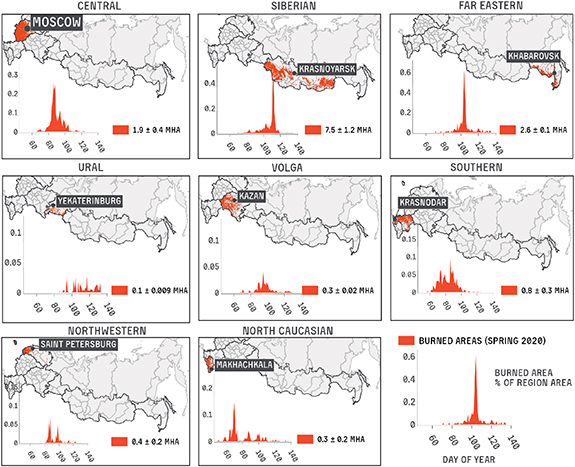
Figure 4. Comparison of 2020 spring burned area temporal dynamic across Russia and each Federal District.
Download figure:
Standard image High-resolution imageThere were several distinctive temporal trends of spring burned areas (figure 4). For Siberia and the Far East, a short-lived single peak of the burned area was observed in April (DOY 100 −110). In general, a constant spring burning season was observed in Southern and Volga Federal Districts, while in the Central Federal Districts, spring burning represented a peak at the beginning of the season, followed by a uniform rate of decrease of burning. In the North Caucasus, a multimodal temporal distribution of fires was observed during the spring burning season. The Northwestern Federal District showed a bimodal distribution of burned areas. The Ural demonstrated the lowest fire activity with a uniform rate of burned areas over the spring season.
3.2.2. Attribution of burned land cover classes
For all three of the land-cover datasets used in the analysis, more than 75% of the area of 2020 spring fires was associated with arable and grassland land-cover classes (figures 2(a)–(c) and table 4). Open forests (15%–30%) and wetlands (3%–30%) were the next most common classes in which 2020 spring burned area occurred. The distribution of spring burned area among classes varied among districts. For example, for land cover from the 300 m ESA CCI-LC product, approximately two-thirds of spring fires occurred on arable lands in the Volga District, whereas in the Siberian District, spring burned areas were most common in deciduous and needle leaf forests, followed by arable lands (figure 2(a), supplemental table 11). Fires predominantly occurred in forest classes in Asian Russia (Siberian and Far Eastern Federal Districts), while in European Russia (e.g. Central, Northwestern, and Volga Federal Districts), spring fires predominantly occurred across arable and arable mosaic land-cover classes.
Table 4. Area (thousand km2) of aggregated ESA CCI-LC 2015 (300 m), ESA CCI-LC 2019 (100 m) and GLAD LC 2019 (30 m) land cover classes overlaid with 2020 spring burned areas.
| Aggregated ESA CCI-LC land-cover 2015 map (300 m) | ||||||
|---|---|---|---|---|---|---|
| Country | Arable | Mosaic arable | Deciduous and mosaic forest | Evergreen/broadleaved/mixed with deciduous forest | Grasslands | Shrublands/wetlands |
| Russia | 37.7 | 17.4 | 26.1 | 12.3 | 37.8 | 2.8 |
| Aggregated ESA CCI-LC land-cover 2019 map (100 m) | ||||||
| Arable | Open forest | Closed forest | Grasslands | Shrublands/wetlands | ||
| Russia | 15.9 | 32.0 | 7.9 | 58.3 | 20.4 | |
| Aggregated GLAD land-cover 2019 map (30 m) | ||||||
| Arable | Open forest | Closed forest | Short dense vegetation | Wetlands | ||
| Russia | 5.6 | 15.9 | 6.5 | 79.3 | 26.4 | |
Similar results were found when using the aggregated 100 m ESA CCI-LC (Buchhorn et al 2020) and 30 m GLAD LC (Hansen et al 2021) maps, with an increasing burned area on shrublands/wetlands class (figures 2(b), (c) and table 4). However, for 100 m ESA CCI-LC product, fires in arable lands represented only half as much area compared to the 300 m ESA CCI-LC map. The differences observed between the 300 and 100 m ESA CCI-LC products and the GLAD LC 30 m product were substantial, as less than 10% of spring fires in all Federal Districts fell into arable land according to the 30 m GLAD attribution.
Spatial resolution of the land-cover data clearly affects the analysis of the association between burned area and land cover class. The area of spring fires occurring in arable lands and in closed forests decreased substantially with increasing spatial resolution (2–6 times across the products) due to more fires occurring in the grassland class. As resolution increases, more complexity of the landscape is taken into account: spring fires fall into mosaic of different classes—natural or unused arable grasslands located between fields and pastures, edges of forest, etc (supplemental materials 6, suplemental figure 6). But differences in the distribution of fires among land cover classes using the three land cover datasets could be due to factors other than resolution. The 30 m GLAD LC product uses a more restrictive definition of arable land, such that only actively managed arable land (i.e. bare/tilled ground) was included in their classification (Hansen et al 2021), and a broader definition of short-dense vegetation class which includes fallow/unused/abandoned arable lands and natural grasslands. More details about spring fire distribution between districts for three LC datasets is provided in supplemental materials 6, supplemental table 11.
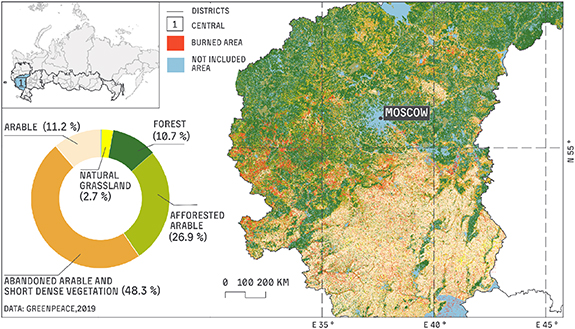
Using the 2017 Landsat-based 30 m agricultural and abandoned lands product, we found that in the Central Federal District approximately 75% of the burned area occurred on abandoned agricultural lands, of which 27% were afforested, and only 11% of fires occurred on lands whose status in 2017 was active arable lands (figure 5), compared to an estimate of 75.7% spring burned areas in arable and mosaic arable land-cover classes from the 300 m ESA CCI-LC product (table 4). Given the temporal mismatch among 2015 land cover, 2017 agricultural land abandonment maps and 2020 spring burned area product, uncertainty in exact land-cover and land-use may affect estimated patterns of burning.
Figure 5. Distribution of 2020 spring burned area over Greenpeace Russia's 2017 agricultural and abandoned land map (Glushkov et al 2019) for the Central Federal District of Russia.
Download figure:
Standard image High-resolution image
For example, uncertainty in our Russia-specific 30 m agricultural land abandonment product occurs where natural grasslands (meadows, treeless lands) mix with long-term abandoned arable lands. Although there is a separate grasslands class that includes steppes and dry meadows, some pastures, meadows, and grasslands in western Russia were classified as 'abandoned arable and treeless lands' (figures 5, 48.3%). It is difficult to separate these non-woody classes using spectral data and therefore our analysis is affected by this source of uncertainty. Some of the burning occurred on abandoned agricultural lands, much of it were recently afforested, yet some burning was also common for grasslands. We should note, while overall accuracy of the agricultural land abandonment product for the Central region had overall accuracy of 86–88, it might also present additional uncertainties in exact land-change patterns affected by burning (Glushkov et al 2019).
4. Discussion
Our study revealed widespread spring burning in Russia for 2020 with an estimated 14.19 Mha burned (±1.37Mha). The largest estimated burned area was in Siberia (7.49 ± 1.22 Mha) and the largest estimated proportion of burned area was in the Central Federal District (2.97%). Our spring-fire product revealed five times more burned area compared to the burned area estimated from the MODIS MCD64 product. We also found high variability of effective burned area per active fire pixel (comparison of our product with MODIS/VIIRS active fire data) between Russia regions. Validation results showed UA of 91.9% and PA of 85.4% for the burned class. The commission and omission errors of the burned area were likely connected to the size of spring fires (i.e. smaller burned area than summer wildland fires), with large fires more favorable for accurate mapping using volunteer mappers on the crowdsourced mapping platform. Fire recognition is further complicated in the Southern, North Caucasus, and Northwestern Districts where burned areas are often confused with dark soils of bare and/or tilled agricultural/arable land (called the 'chernozem' in the Southern Federal District), as well as difficult to differentiate from hill shade in the North Caucasus Federal District. Burned area from previous fire seasons in steppe and taiga regions also led to confusion, resulting in the need to include imagery from 2019 in the platform for interpretation. Inundated soils, particularly in and near wetlands, could appear to be burned, so an emphasis was placed on identifying active fire fronts or fire spread in the imagery.
Though outside the scope of this study, which relied on training dozens of volunteers to visually interpret easy-to-understand multispectral satellite imagery, the inclusion of Sentinel-1 synthetic aperture radar imagery in future deployments of this platform could improve fire progression and detection on cloudy days (Ban et al 2020) as well as for forests (Belenguer-Plomer et al 2019), wet versus burned soils, and even in agricultural landscapes (Lasko 2021). Further, the Southern, North Caucasus, and Northwestern Federal Districts have smaller fires, potentially with a greater likelihood of being missed in the participatory mapping. Arctic and sub-arctic regions were excluded from this study (figure 1), though current research suggests that fires may be occurring in these northern regions as early as May (McCarty et al 2020). Thus, this remains an uncertainty and direction for future work.
We compared the crowdsourced spring burned area product with published estimates of wildland fires in forests, grasslands, wetlands (Bondur et al 2019), and cropland areas (Hall et al 2016) in Russia. Bondur et al (2019) calculated an average annual burned area of wildland fires of 123 313 km2 for 2002 through 2017. The upper estimate of springtime burned area in cropland for 2012 for all of Russia was estimated to be 1310 000 km2, with an estimate of 1400 km2 for fires with greater than 60% confidence (Hall et al 2016). Our study estimated a total of 141 900km2 for spring burned area—1.15 times more (15% more) than the average annual burned area of wildland fires for Bondur et al (2019) estimates, but only 10% of the Hall et al (2016) estimate of all cropland burning and approximately 100 times more than the 60% confidence estimate (1400 km2 compared to 141 900km2). The areas of forest fires according to ISDM-Rosleskhoz data (FBI 'Avialesokhrana' 2021) for the spring of 2020 exceeded the average long-term values (by 47% for the nearly two decade period of 2001–2019), but these reported fires were far from record-breaking. Overall, 2020 was the fifth highest year since the beginning of the 21st century after (in descending order of the area of fires and not yet including the 2021 fire season): 2008, 2018, 2003 and 2019.
Spring fires were common across various land-cover types, including forests, wetlands (including drained wetlands), shrublands, and both cultivated and abandoned croplands. Our study showed the dominance of grasslands (natural or transformed) and arable lands during spring burning in most Federal Districts, likely connected to the typical agricultural practice of prescribed burning on the territory of the former Soviet Union (McCarty et al 2017). Russia has many different bioclimatic zones resulting in various forest, shrubland, and grassland landscapes, including regions with several types of land covers where human-caused fires, and potential for these fires toescape, is prevalent. Our study found spring forest fires in Siberia and grassland fires in the Far East, reflecting these land cover differences between regions.
Our study showed 57% of spring fires in the Central Federal District of Russia occurred on abandoned lands (48.3% of spring fires occurred on the mosaic of abandoned arable lands in post-Soviet periods with no afforestation and natural treeless lands, 26% with ongoing afforestation) and only 11.2% on actively cultivated croplands. After the collapse of the Soviet Union, Russia turned into a global abandonment hotspot due to the restructuring of the economy (Rozelle and Swinnen 2004, Næss et al 2021). Abandoned arable lands without afforestation in Central (temperate) Russia are often occupied with pioneer vegetation, such as perennial grasses, and can serve as an ideal source for the spread of fires due to the accumulation of dry biomass (McCarty et al 2017). Also, the local dwellers often clear such areas from old grass by intentionally setting the burning (Khanina et al 2018) to avoid potential government penalties for not properly maintaining agricultural landscapes (McCarty et al 2017). Our findings of the contribution of abandoned lands to the spread of fires are consistent with findings in the Mediterranean region (Lloret et al 2002, Krawchuk et al 2009) and in the steppe belt of Eurasia (Dubinin et al 2010, Dara et al 2020). If abandoned agricultural lands are viewed as a potential source for carbon offsets via natural restoration, then our findings indicate the need for land management practices that will control the spread of devastating wildfires.
In European Russia, spring burning can destroy young productive forests emerging on abandoned agricultural lands (Glushkov et al 2019) in areas of high suitability for forests and seed dispersal. Potentially, these lands could become part of forest cultivation, leading to the creation of up to 100 000 permanent jobs, and growth of up to 300 million cubic meters of timber annually that would diminish the need to allow cutting of the most valuable wild forests (Yaroshenko 2019). This practice of spring burning also makes natural areas more fire hazardous because it destroys trees and bushes and creates conditions where the territory becomes more overgrown with grass and weeds leading to increasing large-scale fire disasters. Spring fires also greatly reduce the ability of Russia's natural areas to absorb carbon from the atmosphere (Schierhorn et al 2013).
It was beyond the scope of this study to determine the exact timing of fire from the Sentinel-2 burned area, which is why active fire data were included in the analysis and used by the crowdsourced mappers to help identify and delineate burned area polygons. Our product is best used as a monthly or seasonal assessment of fire activity and potential fire emissions. The spring burned area data could also be used, as demonstrated here, for a better understanding of the fire regimes of Russia, moving beyond previous work that relied on active fire detections (McCarty et al 2012), coarse resolution burned area (Hall et al 2016), or ground-based data (Romanenkov et al 2014).
Participatory mapping has both advantages and disadvantages. The design of the platform was parsimonious—only what was required to fulfill the task. The training materials included a text manual and a video-guide through the platform explaining the workflow and functionality, both hosted on Google Workspace that allowed a constant inflow of volunteers without additional time spent on meetings. However, quick communication between volunteers and experts was necessary to resolve technical issues and to provide advice in difficult cases (e.g. to understand the difference between tilled agricultural fields and burn scars that look similar in Sentinel-2 true color and false-color imagery). This required a designated coordinator tasked to oversee the entire process and the authority to change it when necessary, invite new volunteers, provide and adjust materials, answer non-expert questions, support chats, provide feedback to the volunteers to improve quality, and assign mapping sectors based on the level of expertise and calculated accuracy of volunteers. Automation of the coordination process (using spreadsheets, bulk message emails/chats /texts, Google Docs, etc) was necessary to increase the speed of the overall process. Although there were hundreds of volunteers, the project still required experts to perform quality control of the completed burned area digitization. This step was crucial as many volunteers had never worked with satellite imagery before and correcting both false positives (delineated as fires but had not burned) and false negatives (a burned area that was not digitized) required a significant amount of time. Especially at the final stages of the project, time constraints made it impractical to check every polygon. Consequently, experts were scanning small sub-regions to correct mistakes, giving special attention to the sectors assigned to those volunteers who had previously made mistakes. We acknowledge that although these crowdsourced data contain some uncertainty, they provide a good starting point to quantify a landscape-scale estimate of spring burning throughout Russia.
5. Conclusion
For the first five months of 2020, an area equal to Tajikistan was burned in Russia. Approximately a 1/3 of the total 2020 spring burned area occurred on fallow agricultural lands slowly reforesting, with the remaining in croplands, wetlands, and grasslands. In European Russia, this was the majority of fires, with 52% of all total spring burned area in abandoned lands. Greenpeace's land abandonment data confirmed that lands that do not have a clear legal status and for which the protection from fire is the responsibility of no one, are under the greatest risk of spring fires. The current Russian legislation does not protect these wooded regions in any way and does not allow proper forestry to be implemented, but instead forces the landowners to destroy these forests to avoid fines or land seizure by the state. The owners remove the forest in the simplest way—by burning. The fire can spread from these abandoned agricultural lands transitioning to young forests to other areas, including 'official' forests, peat bogs, infrastructure, and settlements. The temporal analysis gives an estimation of the probable timing of fires in different regions. Late February is usually the starting month of fires in North Caucasus, with maximum fire activity in mid-March and April in Central Russia and in Siberia and late April in the Far East. Knowing the beginning of the spring fire season, as well as where the burning is occurring, could be used for firefighting response, air quality modeling, and climate impacts for potential smoke transport to the Arctic.
Participatory mapping can be a solution for large-scale fire monitoring projects. It requires careful preparation of training materials, development of an easy-to-use online platform, support for the volunteer mappers, quality control of the crowdsourced product, and feedback plus a validation process conducted by smaller groups of geospatial experts. This new 2020 spring fire data not only shows the magnitude of spring burned area for Russia, but also creates the basis for organizing more semi-automated and automated monitoring of these fires in the future.
Acknowledgments
The authors express their gratitude to the ESA Sentinel Hub www.sentinel-hub.com (owned and operated by Synergies Ltd) for providing satellite images WMS service for the crowdsourcing platform.
We thank Grigory Kuksin for his invaluable contribution to firefighting work organization in Greenpeace Russia, Andrey Allakhverdov and Vasilisa Yagodina for communication material after the project was completed, Ksenia Maximova for designing infographics, Nadezhda Vladimirova, Julia Zenkevich, Dmitry Koltsov, Natalia Barakova, Maria Vasilieva for double-check of mapping quality during the project and Peter Potapov for validation process suggestions.
We thank the volunteers who participated in digitizing burned area polygons during April–May 2020 (named as written in a form of registration): Vladislav, Lina, Maria Pokoeva, Kandei, Ekaterina Emelianenko, Daria, Julia Rossomakhina, Irina Efimova, Maria Dorofeeva, Veronika, Nikolay Sobolev, Egor, Andrey Varganov, Andrey Foster, Vladimir Malinin, Lyudmila, Roman Boyko, Polina Kulba, Penzina Julia, Nastya Sergienko, Anastasia, Love, Anna, Osina Natalia Dmitrievna, Irina K, Maria, Elena, Sergey Kudryashov, Anastasiia Molko, Sasha Drebezova, Vladislav Kirillov, Julia Sokolova, Kultynina Margarita, Kuznetsova Anastasia, Olga Kartashova Gennadova, Natalia Sibirtseva, Maria, Julia Chigareva, Artyom, Olesya, Olga Denisova, Lisa, Sharikov Maxim, Julia Kazmerchuk, Nadezhda Lukanovskaya, Sonya Dagargulia, Fayzieva Kamila Alisherovna, Elvira Kuryanovich, Natalya, Daria, Tanya Boykova, Anna Yegorova Pavlyuk, Borisova Ksenia Alekseevna, Aya, Olesya, Anna, Maria, Lesha Kuprienko, Polina Chervonaia, Ksenia Belkina, Artyom Rybin, Olga, Leonid, Mikhail Voitekhov, Daria Lunina, Pavel Bogachev, Olga Rozanova, Ekaterina, Rock Sana, Masha, Derbak, Larisa Shuvaeva, Olesya, Marina Bukia, Anna, Andrey Naumkin, Maria Chukhno, Maxim Koren, Amulanga, Irina, Telegina Sofya Mikhailovna, Valeria, Diana, Andrey Melnikov, Nadezhda Rebik, Kurilenko Regina, Elena Makarova, Natalya Markova, Akbulat, operator_sphinx !, Polina Sievert, Vladimir Volnin, Elizabeth Kalinina, Dvoeglazova Darina, Irina Udalova, Irina, Anastasia, Utsin Maxim, Marina, Petukhova Anya, Gennady Gennadyevich Troitsky, Angelina, Victoria Gallyamova, Inna, Ekaterina Anna, Anna, Varvara, Eva Amelkina, Jacob, Barbara, Olga Inzhechik, Tatyana, Antonov Anton, Olga Pronenko, Ivanova Tamara, Vadim Boytsov, Adelia, Marina Abdulina, Zhanna, Ekaterina, Sveta Zolotareva, Maxim from Astrakhan, Anna Zhivalova, Olga, Vera Soldatova, Dmitry Ivanov, Farida, Elena, Olga, Daria Zaritskaya, Erzhena, Polina Osina, Joseph, Vlad, Veronika, Svetlana Vorobyova, Vasily Dudin, Galya, Evgeny Getts, Tatyana, Nataliya Mologina, Alyona, Olga, Anna Kukleva, Lera, Elizabeth Sidorovskaya, Natalia, Alexandra, Moshref Mohammad Reza, Anya, Oksana, Marina, Egor Borisovich Morozov, Dmitry, Irina, Ksenia Vorontsova, Natalya, Elena, Yuri, Anna, Maria, Anna, Anna, Anna, Oleg Zhelezny, Irina, Knyazkina Julia, Ekaterina, Valeria Nemchinova, Ekaterina Tsybikova, Tatyana Odaryuk, Anna, Bobrova Daria, Anastasia, Twin, Oksana, Alexandra Krivopalova, Ekaterina Omerda, Ekaterina, Mikhail, Anna Andreeva, Dmitry, Maria Petrenko, Maria Lovin-Lovich, Ettari, Manyurova Adelina, Elena Kosharnaya, Aleksandra_Happy, Ekaterina, Ekaterina Borodina, Anna Isakova, Tatyana, difurka, Olga Ilina, Alyona Grebenshchikova, Egor Volodin, Evgenia, Tatyana Stepanova, Olga (boniffaciy) Vedernikova, Fam Thuy An, IrinaKio, Ksenia, Olga, Anna Kirienkova, Elena Terenina, Evgenia Gavrikova, Vladislav Vecherov, Kira Kira Andreevna, Victor Voloshin, Victoria Vasilieva, Elizaveta Pyatkovskaya, Ekaterina Vladimirovna Shekhorina, Anastasia Silaenkova, Elena, Julia M, Daria Aliluyeva, Taya Yazrikova.
We also thank Miami University undergraduate students Stephanie Lubanovic, Billy Somers, and CJ Mescher, as well as staff researcher Justin Fain, for contributing to the point validation.
We acknowledge funding of EU FP7 ERA.Net Russia Plus: 449 CLIMASTEPPE, DFF-Danish ERC Support Program (Grant Numbers: 116491, 9127-00001B). The project is also supported by the European Space Agency's Network of Support Grant 65377.
Data availability statement
The data that support the findings of this study are openly available at the following URL/DOI: https://maps.greenpeace.org/maps/spring_fires_2020.