

Abstract
The accelerating climatic changes and new infrastructure development across the Arctic require more robust risk and environmental assessment, but thus far there is no consistent record of human impact. We provide a first panarctic satellite-based record of expanding infrastructure and anthropogenic impacts along all permafrost affected coasts (100 km buffer, ≈6.2 Mio km2), named the Sentinel-1/2 derived Arctic Coastal Human Impact (SACHI) dataset. The completeness and thematic content goes beyond traditional satellite based approaches as well as other publicly accessible data sources. Three classes are considered: linear transport infrastructure (roads and railways), buildings, and other impacted area. C-band synthetic aperture radar and multi-spectral information (2016–2020) is exploited within a machine learning framework (gradient boosting machines and deep learning) and combined for retrieval with 10 m nominal resolution. In total, an area of 1243 km2 constitutes human-built infrastructure as of 2016–2020. Depending on region, SACHI contains 8%–48% more information (human presence) than in OpenStreetMap. 221 (78%) more settlements are identified than in a recently published dataset for this region. 47% is not covered in a global night-time light dataset from 2016. At least 15% (180 km2) correspond to new or increased detectable human impact since 2000 according to a Landsat-based normalized difference vegetation index trend comparison within the analysis extent. Most of the expanded presence occurred in Russia, but also some in Canada and US. 31% and 5% of impacted area associated predominantly with oil/gas and mining industry respectively has appeared after 2000. 55% of the identified human impacted area will be shifting to above 0 ∘C ground temperature at two meter depth by 2050 if current permafrost warming trends continue at the pace of the last two decades, highlighting the critical importance to better understand how much and where Arctic infrastructure may become threatened by permafrost thaw.
Export citation and abstract BibTeX RIS

Original content from this work may be used under the terms of the Creative Commons Attribution 4.0 license. Any further distribution of this work must maintain attribution to the author(s) and the title of the work, journal citation and DOI.
1. Introduction
Global warming is driving wide spread degradation of the Earth's cryosphere and warming in the Arctic is more pronounced than the global average (IPCC 2021). About 3.3 Million people are living in permafrost regions in the Arctic according to Ramage et al (2021). Warming of the Arctic results in widespread increase of ground temperatures (Biskaborn et al 2019) and permafrost degradation is occurring in many regions (e.g. Hjort et al 2018, IPCC 2019). Expansion of thermokarst features has been also documented related to expanding infrastructure (Raynolds et al 2014). The length of the open water season has been increasing over the Arctic leading to increased capacity for coastal erosion (Barnhart et al 2014). Arctic coastal communities are seen as specifically vulnerable to climate change due to the combined effects of sea ice loss and permafrost thaw (Irrgang et al 2019) which add to the non-climatic factors that require communities to adapt (Ford et al 2015). The latter affects the vulnerability of local and indigenous populations, increasing sensitivity to climate change impacts and constraining adaptive capacity (Ford et al 2015). The impact with respect to the economic value of ecosystem services, minerals and oil needs to be considered (O'Garra 2017). A wide range of geospatial data can be used to support vulnerability mapping including information on infrastructure such as roads (Preston et al 2011). Risk assessment frameworks which have been recently in focus for the Arctic (Larsen et al 2021) include physical exposure as one crucial element. The operability of such frameworks presuppose that, for example, the location and extent of infrastructure objects (settlements as well as transport infrastructure) under risk is known.
Ramage et al (2021) considered the locations of settlements for which population data have been available. Other risk assessment frameworks consider a much broader definition of the human footprint. Also, roads, railways, buildings, and airport strips are included (Suter et al 2019). Hjort et al (2018) for example utilize OpenStreetMap (OSM) data to represent built infrastructure on permafrost within a risk assessment framework. This allows for the consideration of infrastructure such as roads. However, the nature of this type of database results in inconsistencies. To account for such inconsistencies, specifically regarding minor roads, Hjort et al (2018) included only roads of a certain importance. In addition, as in similar studies, only roads and buildings excluding the surrounding grounds were considered part of the infrastructure. The infrastructure footprint in Arctic regions includes, however, also gravel pads and mines (excavation sites) as surface types (Raynolds et al 2014). In addition, large parts of the Arctic and specifically recent industrial development is not reflected in OSM (Bartsch et al 2020a). A consistent record which considers all relevant features is still lacking across the Arctic. The increasing human impact due to industrial development (e.g. Kumpula et al 2012) and military activities also remains to be quantified.
Satellite data can potentially be used to improve detection of infrastructure indicating human activities and also to categorize affected areas in Arctic environments. This includes high resolution optical satellite data (Kumpula et al 2012), the combination with synthetic aperture radar observations (Bartsch et al 2020a) as well as night-time light radiance records (Bennett and Smith 2017). There are, however, clear limitations. Impacts to natural assets that provide ecosystem services that are critical for survival and well-being of Arctic residents cannot be addressed and are beyond the scope of this paper. Here, it deserves to be mentioned that infrastructures and other human impacts on the environment are not inventions of settler colonists. Limiting ourselves to transport infrastructure, indigenous networks of trails (Aporta 2009), the seasonal use of rivers, etc needs to be mentioned. The specific consideration of settler infrastructures in this paper is prompted by their size and quantity, which makes them detectable through remote sensing.
The aims of this study are (1) to quantify change of recent human impact in the panarctic coastal zone, specifically new infrastructure since 2000, (2) identify built infrastructure potentially impacted by recent climate change through combination with permafrost time series (Obu et al 2021a, 2021b, 2021c), and (3) to document the added value of satellite-derived built infrastructure maps along the Arctic coasts compared to datasets by OSM (Ramm 2020), night-time lights information (Elvidge et al 2021), and a recently published settlement dataset for the Arctic (Ramage et al 2021, Wang et al 2021). As a basis (aim #1), the algorithms of Bartsch et al (2020a) and Nitze et al (2018) are applied across the entire Arctic and a fusion and post-processing scheme is developed.
2. Study area and data
2.1. Arctic coasts
The extent of our analysis domain is defined by the spatial distance from the Arctic coast and by the presence of at least partially discontinuous permafrost (based on Obu et al 2021b). We chose a 100 km buffer from the coast to also include communities upstream from estuaries across the Arctic, which to some extent depend on sea access downstream (e.g. Cherskii in northern Yakutia). Compared to the socio-ecological system definition approach by Ramage et al (2021) and Wang et al (2021) (consideration of coastal dependence of settlements as defined by expert assessment), our approach excludes settlements located along the southern Alaskan coast, most of Scandinavia, the southern Newfoundland coast at the Atlantic Ocean, and several Russian settlements south of the treeline. The analyses extent covers approximately 6.2 Mio km2. Figure 1 shows the extent and boundaries for our study area and location of settlements.

Figure 1. Overview of analyses area (100 km buffer zone), settlements of Wang et al (2021) and newly in this study identified settlements (red circles). Background: average permafrost extent derived from Obu et al (2021b).
Download figure:
Standard image High-resolution image2.2. Data
A combination of Sentinel-1 (Synthetic Aperture Radar—SAR) and Sentinel-2 (multispectral-optical) was recommended by Bartsch et al (2020a) for human footprint identification in Arctic environments using the gradient boosting machines method, a machine learning approach applicable in data sparse regions (Chen and Guestrin 2016, Georganos et al
2018). An approach using Sentinel-2 only was suggested by the same authors for the use of the Keras deep learning framework. For our study of panarctic coastal infrastructure mapping we therefore used both Sentinel sensor types (for details see appendix
Sentinel-1 data for winter time (exclusion of moisture impact on backscatter; December and early January) were assembled for winters 2017/2018 in 90% of all processed scenes, but also for 2018/2019 and 2019/2020 in some cases.
Sentinel-2 is provided in granules of a size of 100 km. More than 1200 granules overlaped with our 100 km buffer area along the coast, but less than 300 did overlap with inhabited areas. In total 2424 granules from years 2016 to 2020 were used in our study.
We used Landsat data for the quantification of normalized difference vegetation index (NDVI) trends in association with infrastructure change since 2000. The combined archive of Landsat-7 and -8 datasets formed the basis for trend analyses using multispectral indices as described in Nitze and Grosse (2016).
Auxiliary datasets included OSM (Ramm 2020), ground temperature data from the European Space Agency's (ESA) climate change initiative (CCI) permafrost project (Obu et al
2021a, 2021b, 2021c), a global night-time lights dataset (Elvidge et al
2021) and an Arctic settlements dataset (Wang et al
2021) (for details see appendix
To validate the Sentinel-1 and Sentinel-2 infrastructure classifications, Bartsch et al (2020a) used vectorized data on infrastructure based on high resolution observations of Prudhoe Bay and for several settlements with built infrastructure on Greenland and Longyearbyen. The Prudhoe Bay and Longyearbyen datasets (for sources see table A1) are used in this study to assess the quality of the post-processing scheme, specifically the impact of different editors.
3. Methods
3.1. Pre-processing and classification
An existing processing chain (Bartsch et al 2020a) was used as a first step to obtain results from two different classification approaches. It includes a pixel-based classification using a Gradient Boosting Machine (Chen and Guestrin 2016) and a windowed semantic segmentation approach (U-Net convolutional neural network architecture) using the deep learning framework Keras (Chollet 2017) with the Tensorflow backend. The approaches will be referred to as GBM and DL, respectively, in the following. The GBM is pixel based and the selected scheme provided three classes for human-affected areas and two classes for other features (vegetated tundra and open water). In contrast, the Keras DL framework allows for a more contextual approach and three classes only covering the target object types (human-affected area) were produced.
3.2. Post-processing and fusion of infrastructure datasets
As demonstrated by Bartsch et al (2020a), misclassifications frequently occur for bare areas in case of the GBM approach. This includes lake and sea shores, river banks and exposed bedrock. Using, for example, Google hybrid maps such obvious misclassifications can be manually removed. The raster information was therefore converted to vector to allow object-specific editing. GBM results also included the classes 'other/tundra' and 'water bodies'. Both were excluded from further analyses. All single pixel objects were removed automatically before manual removal involving several editors. The latter was carried out by four editors independently for selected sites to test the impact of possible performance differences. The same validation data as considered in Bartsch et al (2020a) was then used to assess the quality of the manual post-processing for Prudhoe Bay and Longyearbyen (Walker et al 2014, Lu et al 2018).
After clean-up, the outputs from DL and the GMB were fused. DL was given priority in the fusion process due to its better performance. In case of presence of an object identified with DL, the objects from GBM are dropped. Automatic fusion was carried out using the Python package 'geopandas' (Jordahl et al 2021). In the following step, polygons were dissolved by human impact class. Since there are overlaps between adjacent Sentinel-2 granules, polygons of different classes could still overlap after the dissolve step. Where there was still overlap, differences were calculated using polygon sets for each class to allow only one polygon of a certain class at a single location. During this step, highest priority was given to the building class, followed by the road class.
3.3. Preparation of auxiliary datasets and combination
A Theil-Sen regression (Sen 1968, Theil 1992) was used for trend retrievals from 2 m ground temperature, active layer thickness (ALT), and permafrost fraction. In case of Landsat derived NDVI, the trends have been obtained with Ordinary Least Square regression. For NDVI, changes per decade, and for all other parameters, changes per year were extracted. For each object the average change was derived. This was carried out for all classes together as well as separately. The analyses were made on different levels: the entire Arctic and by country/region (in both cases subset with the 100 km buffer).
NDVI change occurs due to climate change (greening, rapid permafrost thaw) and hydrologic processes as well as human impacts. A certain magnitude of abrupt negative change can be expected in the latter case. A value of 0.6 is a common NDVI for Tundra in case of high shrub cover, but it can also be lower; less than 0.3 is typical for bare ground (Bartsch et al 2020b). An NDVI trend of smaller than −0.1 per decade was therefore chosen as threshold for identification of impacted areas.
All objects were assigned settlement names and further attributes where available. In a first step the settlement database of Wang et al (2021) was used. A 40 km search radius was applied. Clusters of objects which remained unassigned were manually reviewed in a second step. Missing settlements were identified and added, guided by information from the Google Hybrid data layer. The updated settlement database was then extended for name and economic use/function based on information accessible on the internet. The following general categories were considered: fishing, agriculture (mostly reindeer herding), gas/oil industry, mining, other use (e.g. transport hub), abandoned, and unknown (sub-categories are provided in table B1). It should be noted that this approach does not allow for distinction between, for example, subsistence-harvest and commercial fisheries or extractive industries overlapping with subsistence land use.
Eventually a 40 km maximum search radius (benchmark Bovanenkovo, Yamal) was applied to all objects again in order to attribute the mapped features to a certain settlement and to assign the economic use/function to them. This is of relevance for the comparison to the NDVI trends in order to analyze differences across different settlement and use types.
3.4. Comparison with OSM
OSM data contain a wide range of features. But specifically the road class comprises a diversity of transport routes. This includes also winter routes which do not rely on permanent constructions and therefore are mostly not visible in summer acquisitions of multispectral images. This needs to be considered for the comparison. Therefore, based on the mapped features, all relevant OSM objects (buildings, traffic, transport, railways, roads) were extracted to identify how much of our dataset is represented in OSM, but only buildings were analyzed for the extraction of satellite derived features based on the OSM. In order to account for positional inaccuracies in both datasets, buffers of 30, 50 and 100 m were used for the overlay analyses.
4. Results
4.1. Post-processing of infrastructure classifications
Three-hundred and sixty-six granules contained identifiable infrastructure. 99.5% of GBM results and 35.0% of DL results were manually removed. Deviations between different editors were less than ±2.5% (differences largest for roads, tables 1 and 2). The merged dataset provides a better producers accuracy for roads (60%) while keeping the values for natural areas high (95%; see table 3). The results from Prudhoe Bay (producers accuracy) for 'impacted' areas demonstrated the added value of merging DL and GBM. While DL provided very good results for roads it had low performance for other 'impacted' areas. The producers accuracy for Longyearbyen suggests better performance of DL alone, but the users accuracy could not be derived in this case (table 4). The manual editing specifically improved the GBM results (both sites) and allowed for an enhancement through the merging.
Table 1. Users and producers accuracy of post-processed results (by four different editors A–D) of DL (deep learning) and GBM (gradient boosting machines) for Prudhoe Bay. Reference dataset: Walker et al (2014) with separation of non-impacted (56.41 km2), impacted (4.16 km2), roads (1.44 km2).
| Producer accuracy | User accuracy | ||||||||
|---|---|---|---|---|---|---|---|---|---|
| Building as | Other as | 'Impacted' as | 'Impacted' as | ||||||
| Method | Editor | Road | 'impacted' | 'impacted' | Natural | Road | building | other | Natural |
| DL | A | 54% | 95% | 77% | 93% | 35% | 5% | 11% | 99% |
| B | 54% | 95% | 77% | 93% | 35% | 5% | 11% | 99% | |
| C | 54% | 95% | 77% | 93% | 35% | 5% | 11% | 99% | |
| D | 54% | 95% | 77% | 93% | 35% | 5% | 11% | 99% | |
| GBM | A | 28% | 80% | 56% | 98% | 44% | 33% | 30% | 97% |
| B | 28% | 80% | 57% | 98% | 45% | 33% | 30% | 97% | |
| C | 28% | 80% | 58% | 98% | 44% | 33% | 30% | 97% | |
| D | 28% | 80% | 57% | 98% | 45% | 33% | 30% | 97% | |
Table 2. Producers (per reference class) accuracy of post-processed results (by four different editors A–D) of DL (deep learning) and GBM (gradient boosting machines) for Longyearbyen. Reference dataset: Lu et al (2018) with 0.13 km2 for roads and buildings and 0.42 km2 for natural areas.
| Method | Editor | Road | Building | Natural |
|---|---|---|---|---|
| DL | A | 98.10% | 96.51% | 100.00% |
| B | 98.10% | 96.51% | 100.00% | |
| C | 98.10% | 96.51% | 100.00% | |
| D | 98.10% | 96.51% | 100.00% | |
| GBM | A | 46.65% | 85.27% | 100.00% |
| B | 48.52% | 85.27% | 99.98% | |
| C | 44.96% | 85.40% | 100.00% | |
| D | 49.71% | 85.27% | 100.00% |
Table 3. Users and producers accuracy of the merged product, original and post-processed results (average of four different editors, see table 1) of DL (deep learning) and GBM (gradient boosting machines) for Prudhoe Bay. DL-original refers to results of Bartsch et al (2020a). Reference dataset: Walker et al (2014) with separation of non-impacted (56.41 km2), impacted (4.16 km2), roads (1.44 km2).
| Producers accuracy | Users accuracy | |||||||
|---|---|---|---|---|---|---|---|---|
| Building as | Other as | 'Impacted' | 'Impacted' | |||||
| Product | Road | 'impacted' | 'impacted' | Natural | Road | as building | as other | Natural |
| DL-original | 54.00% | 95.00% | 77.00% | 93.00% | 35.46% | 5.09% | 11.10% | 97.85% |
| DL postprocessed (average) | 53.87% | 94.81% | 76.88% | 92.96% | 35.36% | 5.01% | 10.96% | 99.28% |
| GBM-original | 24.00% | 78.00% | 38.00% | 99.00% | 46.46% | 33.87% | 31.52% | 76.77% |
| GBM postprocessed (average) | 28.20% | 80.07% | 57.03% | 97.95% | 44.75% | 33.15% | 30.37% | 96.89% |
| Final product | 26.04% | 79.50% | 64.68% | 98.46% | 69.37% | 28.29% | 31.21% | 95.46% |
Table 4. Producers accuracy of the merged product, original and post-processed results (average of four different editors, see table 1) of DL (deep learning) and GBM (gradient boosting machines) for Longyearbyen, Svalbard. DL-original refers to results of Bartsch et al (2020a). Reference dataset: Lu et al (2018).
| Product | Road | Building | Other |
|---|---|---|---|
| DL-original | 65% | 75% | 100% |
| DL-postprocessed (averaged) | 98% | 97% | 100% |
| GBM-original | 55% | 36% | 61% |
| GBM-postprocessed (averaged) | 47% | 85% | 100% |
| Final product | 57% | 95% | 100% |
4.2. Post-processed settlements data base
The settlement dataset of Wang et al (2021) contained 285 settlements within our analyses extent. 47% of all objects could be directly assigned to them. After the semi-automatic extension (addition of 221 settlements based on identified clusters within our results, figure 1), 87 % could be attributed. Remaining objects correspond mostly to roads and railways connecting the remote locations.
4.3. Human-impacted area across the Arctic
In total, 0.02% of the land area within the 100 km buffer was identified as human-impacted (sum of all target classes). The overall sum is 1243 km2. More than 50% occurs over continuous permafrost and more than 30% over discontinuous permafrost (figure 2). Most identified areas in Canada and US are located on continuous permafrost. For Russia this applies to less than half of them. The majority of the human-impacted area was assigned to the 'Road' class and least to 'Buildings' (table 5). Most of the human impacted areas that we identified relate to oil/gas industry and mining activities (figure 3). It needs to be noted that there might also be subsistence land use in the surroundings. On average, 31% of area associated with oil/gas (overall occurrence 38%) is new since 2000 and 5% in case of mining (overall occurrence 21%) (figure 5).
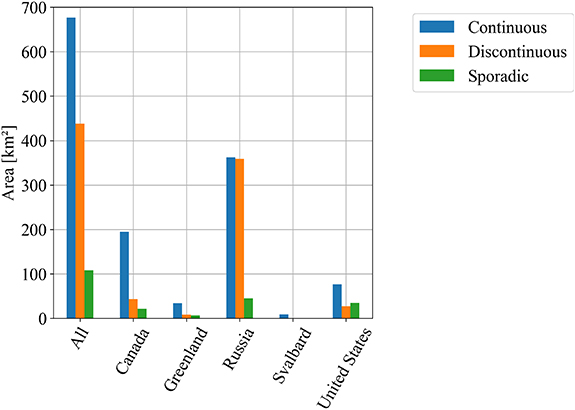
Figure 2. Distribution of human-impacted area as mapped with Sentinel-1 and -2 within the analysis extent across different permafrost zones by country/region (year 2019, permafrost zone source: Obu et al (2021b)). For analyses extent see figure 1.
Download figure:
Standard image High-resolution image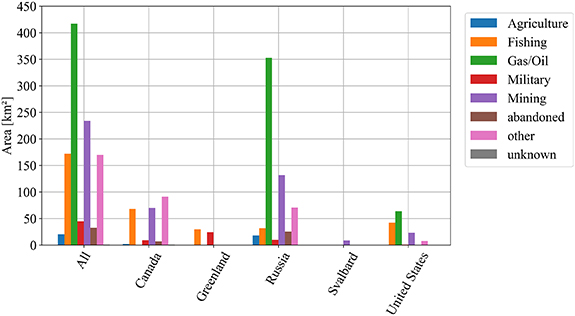
Figure 3. General use type for human-impacted area as mapped with Sentinel-1 and -2 within the analysis extent by country/region. For analyses extent see figure 1. See table B1 for details on categories.
Download figure:
Standard image High-resolution imageTable 5. Distribution of human-impacted areas in absolute and relative values (with respect to sum of identified areas within the 100 km Arctic coastal zone) and proportion of NDVI reduction of more than 0.1 per decade by country/region for 2000–2018.
| Type | Roads | Buildings | Other impacted areas |
|---|---|---|---|
| Area in km2 | 661 | 204 | 378 |
| Proportion in % | 54 | 16 | 30 |
| NDVI decline in % | |||
| Canada | 5.7 | 8.7 | 8.7 |
| Greenland | 0.9 | 1.9 | 1.0 |
| Russia | 15.4 | 14.4 | 28.8 |
| Svalbard | 18.2 | 7.6 | 26.1 |
| United States | 3.4 | 6.1 | 11.7 |
The NDVI trend with the maximum frequency is positive (figure 4(a)) and the total area with a positive trend is also larger than with a negative trend (789 km2 versus 454 km2, respectively). The average is, however, close to zero (−0.006 per decade). Larger changes (greater than 0.1) are less common and differ between regions (figures 5 and C1, table 5). As an example, greening seems to occur for Svalbard settlements with at the same time a decline at the same magnitude due to extension of infrastructure. Greening dominates around Longyearbyen, Ny Alesund and Pyramiden and a decline around the mining towns of Svea and Barentsburg (figure 6). A notable partial NDVI decline can be observed for all regions except Greenland (figures 5 and C1). The affected area and proportion is largest for Russia. Most relates to infrastructure expansion in Western Siberia (figure 7) and in general to gas and oil industry (figure 8). In total, 159 km2 are affected in Russia, compared to 19 km2 for Canada and 9 km2 for US. Most falls into the categories 'roads' and 'other' (figure C1).

Figure 4. Histograms for selected trends and states within the human-impacted area as mapped with Sentinel-1 and -2: (a) normalized difference vegetation index (NDVI) trends 2000–2018  ), (b) ground temperature (GTD) trend at 2 m depth 1997–2019 (
 C yr−1), (c) active layer thickness (ALT) trend 1997–2019 (
 cm yr−1), (d) permafrost fraction (PFR) trend 1997–2019 (
 ), (e) Ground temperature at 2 m depth in 2019 (
 C), (f) active layer thickness 2019 (
 ), (g) Permafrost fraction 2019 (
 ), (h) Night-time light radiance 2016 (Elvidge et al
2021) for the mapped areas (
), (h) Night-time light radiance 2016 (Elvidge et al
2021) for the mapped areas ( nW cm−2 sr−1). Sources of permafrost values (b)–(g): Obu et al (2021a, 2021b, 2021c).
Download figure:
Standard image High-resolution image
Figure 5. Fraction of Landsat-based normalized difference vegetation index (NDVI) change trends 2000–2018 for each class of human impacted area as mapped with Sentinel-1 and -2 by country/region.
Download figure:
Standard image High-resolution image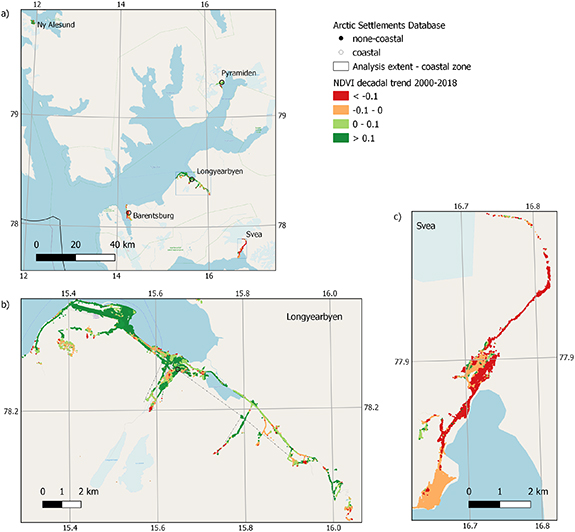
Figure 6. Landsat-based normalized difference vegetation index (NDVI) change 2000–2018 within human impacted areas as mapped with Sentinel-1 and -2 (averages for distinct objects) for (a) central Svalbard, (b) subset for Longyearbyen and (c) Svea (background: OpenStreetMap). Values less than −0.1 indicate new human impacts after 2000. Source of settlement locations: Wang et al (2021).
Download figure:
Standard image High-resolution image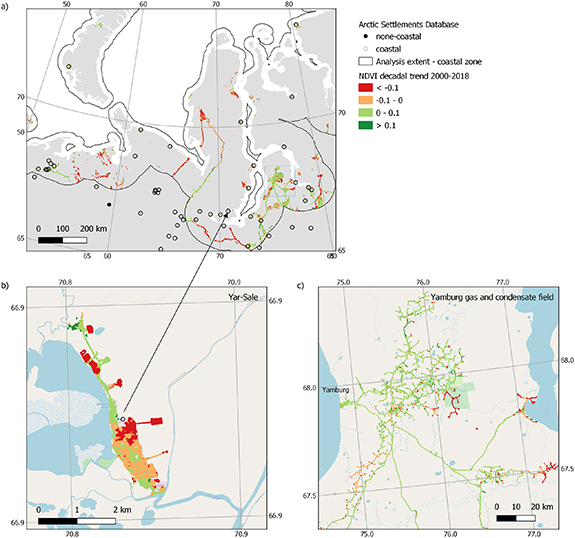
Figure 7. Landsat-based normalized difference vegetation index (NDVI) change 2000–2018 within human impacted areas as mapped with Sentinel-1 and -2 (averages for distinct objects) for (a) Western Siberia, (b) subset for Yar-Sale on the southern Yamal peninsula and (c) the Yamburg gas and condensate field (background of (b) and (c): OpenStreetMap). Values less than −0.1 indicate new human impacts after 2000. Source of settlement locations: Wang et al (2021).
Download figure:
Standard image High-resolution image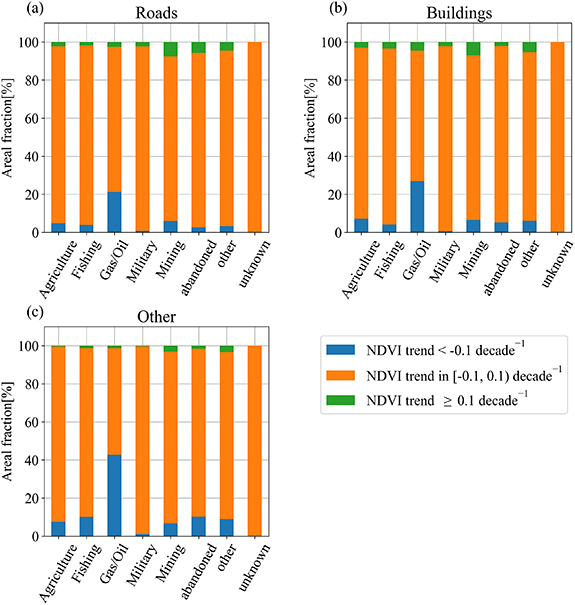
Figure 8. Landsat-based normalized difference vegetation index (NDVI) change 2000–2018 within human impacted areas as mapped with Sentinel-1 and -2 by general use type. Values less than −0.1 indicate new human impacts after 2000.
Download figure:
Standard image High-resolution imageAlmost 97% of all mapped areas showed a positive trend in ground temperature and 93% for ALT (figures 4(b) and (c)). Temperatures were increasing by 0.8 ∘C per decade on average over the human-impacted area identified within the analysis extent. The ALT increase was 11 cm per decade (average ALT in 2019 was 84 cm). About 8% changed from a permafrost fraction of 100% to a lower value between 1997 and 2019.
The changes in ground temperature during the last two decades tend to be larger in colder permafrost than for ground with temperatures near zero degree C (as determined for the year 2019, figure 9), which agrees with prior findings (Romanovsky et al 2017, Biskaborn et al 2019, Box et al 2019). As the magnitude for the latter is still on the order of one degree C for this time period, the expected impact during the upcoming decades is large if the trend continues. 55% and 67% of human-impacted areas will be located on ground with larger than zero degree C mean annual ground temperature down to 2 m depth in 2050 and 2060 respectively. Most affected is Russia and some areas in the US (Alaska) (figures 11 and C2).
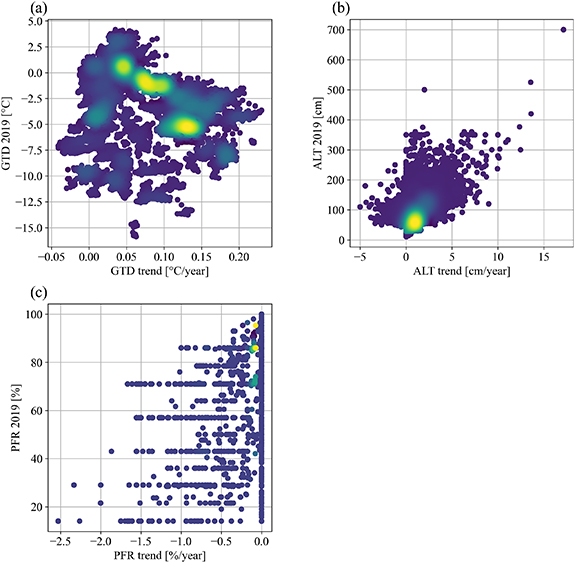
Figure 9. Scatterplots of trend versus 2019 status for (a) ground temperature at 2 m depth, (b) active layer thickness and (c) permafrost fraction. Each point represents the average for a distinct object (human impacted area) as mapped with Sentinel-1 and -2 (Bartsch et al 2021). Calculations are based on Obu et al (2021a, 2021b, 2021c) respectively.
Download figure:
Standard image High-resolution image4.4. Night-time lights comparison
Approximately 53% of the overall identified human-impacted area was represented in the night-time light dataset (3% had no data, 44% had a radiance value of 0 nW cm−2 sr−1). This overlap was similar across all considered classes, with only a slightly lower fraction for buildings. The uncovered areas included 48% of the roads or rail tracks, 47% of the other human impacted areas, and 42% of the buildings class. The latter were often constructions in association with pipelines and railroads. It also included misclassifications of road segments.
The most frequent night-time light radiance was around 10 nW cm−2 sr−1 (figure 4). It was derived from all regions where data is available (figure 10; Svalbard is not included in Elvidge et al 2021). It was higher for Greenland (about 20 nW cm−2 sr−1) and lower for Russia and US (around 6–7 nW cm−2 sr−1). The maximum for Greenland was 40, for Canada 90, and for the US about 700 nW cm−2 sr−1. A value of 1000 nW cm−2 sr−1 per object was only exceeded for Russia. Such a high radiance occurred over 0.7 km2. The overall average radiance for objects with data was 26 nW cm−2 sr−1.
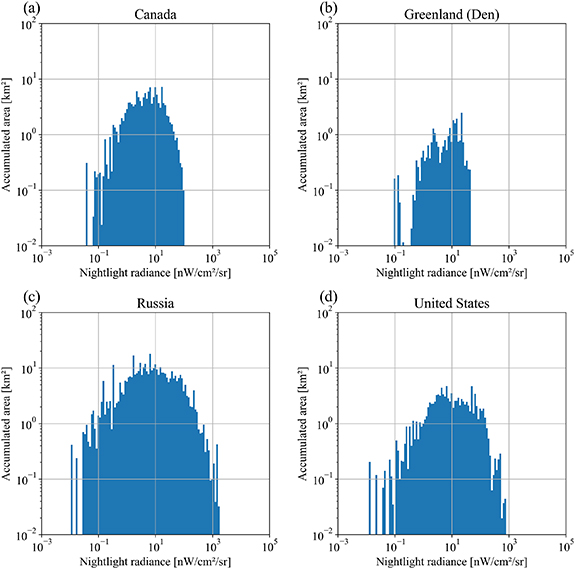
Figure 10. Night-time light radiance (source: Elvidge et al 2021) value occurrence for all classes of human impacted area as mapped with Sentinel-1 and -2 by country/region (analysis extent only).
Download figure:
Standard image High-resolution image4.5. OSM comparison
In total, 40% of human-impacted area identified in SACHI was not yet included in OSM. This value is lowest for Svalbard (8%) and highest for Russia (48%) considering a 100 m buffer (table 6). About 18% of buildings contained in the OSM have not been identified as human-impacted considering a radius of 100 m.
Table 6. Percentage of human impacted area not included in OpenStreetMap considering buffers of 30, 50 and 100 m.
| Region | 30 m | 50 m | 100 m |
|---|---|---|---|
| Canada | 63 % | 48 % | 34 % |
| Greenland | 53 % | 38 % | 26 % |
| Russia | 68 % | 58 % | 48 % |
| Svalbard | 43 % | 22 % | 8 % |
| Alaska | 48 % | 32 % | 20 % |
5. Discussion
The combination of Sentinel-1 and Sentinel-2 as well as the GBM and DL approach provides a means for quantification of human-impacted areas in the permafrost affected Arctic coastal zone. But a range of limitations needs to be considered when using the resulting SACHI dataset for further analyses. Many smaller unpaved tracks which are very common in the Arctic (Kumpula et al 2012, Ehrich et al 2018) cannot be captured due to the spatial resolution limits. The same applies to winter roads (seasonal ice roads) which play an important role in the Arctic, but cannot be readily detected with summer season imagery. In general, the 'road' class which encompasses linear infrastructure also including rail tracks has a rather low accuracy based on the chosen validation datasets (tables 3 and 4). The 10 m resolution is very limiting but still provides a step forward for infrastructure mapping in Arctic environments. Further, Bartsch et al (2020a) noted that the performance of HH versus VV polarization for the Gradient Boosting Machines approach differs. This may affect results from Greenland. However, our approach to fuse GBM with the Deep Learning results helps to limit the impact of some of the differences. If only linear infrastructure is of interest, then the application of Deep Learning might be sufficient (tables 3 and 4). Other impacted areas such as open pit mines are irregularly shaped and can not yet be well captured with DL (users accuracy table 3). A revision of the training of the algorithm and extension of target classes to reflect different possible 'other impacted' areas might allow for improvements.
Three issues need to be considered when interpreting the NDVI trends: (1) the retrieval of zonal statistics by object may cause object size-dependent effects, (2) the mismatch of spatial resolution between Sentinel-1/2 and Landsat, and (3) the range of NDVI levels across different Arctic landscapes. As NDVI is derived for specific objects, smaller features such as buildings have fewer pixels and thus are more likely to be assigned extreme changes while larger objects may be less represented through extreme changes because a larger number of pixels averages out strong change. This is especially relevant for road networks (also connecting to runways, as e.g. in Longyearbyen, figure 6(b)). But due to the fact that NDVI change is derived from a coarser resolution dataset which does not resolve roads, also a pixel based retrieval is not expected to provide more locally representative values in most cases. The mixed pixel effect likely has a larger effect on roads than on square gravel pads. Hence, variations between objects may not in all cases reflect an actual degree of vegetation removal. It is therefore suggested to derive change/no change only from the SACHI dataset (as done in this study). The general background NDVI may also differ between regions and this should be considered. Extensions of built infrastructures on bedrock or other barren ground, for example in the High Arctic, might not reflect well in the NDVI trend values. Including other multi-spectral indices sensitive to soil moisture, such as the normalized different moisture index, may enhance such detection in future upgrades of the workflow. The focus for this study was on vegetation decline, but greening is also a common feature in Arctic settlements (see Svalbard example figure 6). Settlements with built infrastructure are in cases partially abandoned or vegetation recovers after disturbance due to construction works.
The magnitude of ground temperature change (figure 11) is similar to previous findings which focus on larger parts of the Arctic. Ramage et al (2021) estimate that about 42% of settlements currently on permafrost will experience widespread permafrost thaw by 2050. Hjort et al (2018) estimate based on statistical modelling of mean annual ground temperature that 70% of all Arctic infrastructure will be affected by thaw by 2050 (RCP4.5 for 2041–2060). These estimates are, however, not directly comparable due to the different extent, less considered human-impacted areas, and differences in the retrieval for ground temperature projections for 2050 (2 m depth versus unspecified depth). The simple trend interpolation results specifically deviate in Western and Far Eastern Siberia (figure 11).

Figure 11. Distribution of Sentinel-1/2 derived human-impacted areas (SACHI objects) within the 100 km coastal zone. Background: Permafrost presence at 2 m depth (mean annual ground temperature  0 ∘C) in 2050 based on extrapolated trends (1997–2019; input: Obu et al (2021c), ground thermal modelling based on satellite derived landsurface temperature in combination with reanalyses data) and a statistical modelling result for a RCP 4.5 scenario for 2050 (source: Karjalainen et al
2018; mean annual ground temperature
0 ∘C) in 2050 based on extrapolated trends (1997–2019; input: Obu et al (2021c), ground thermal modelling based on satellite derived landsurface temperature in combination with reanalyses data) and a statistical modelling result for a RCP 4.5 scenario for 2050 (source: Karjalainen et al
2018; mean annual ground temperature  0 ∘C, unspecified depth).
Download figure:
Standard image High-resolution imageThe permafrost temperature dataset used in this study is based on a modelling approach (Westermann et al 2015, Obu et al 2021c). Adequate soil parameterization is needed to represent heat transfer. Many artificial surfaces are currently not considered in such models. In case of larger areas with built infrastructure (with respect to the 1 km gridding of the permafrost data), temperatures and ALT might therefore deviate.
15% of identified objects could not be assigned to a specific settlement. This, on the one hand reflects remoteness of some infrastructures for this region but might also be caused by the fact that a name could not be found for all object clusters, especially in Russia. Some of these settlements are not historically grown public places but they result from mining industry. Constructions related to mining, oil and gas industry typically extend over larger regions with a network of roads and pipelines which connect gravel pads or mines with industrial facilities (e.g. figure 7(c)). Use categories depend on availability of information. No category could be assigned in 47 cases. Those are most likely indigenous communities. It can also be assumed that not all landuse and economic activities are captured. Some settlements in Canada and Alaska have been assigned Tourism as the only category (figure B1) but subsistence land use such as hunting and fishing can be most likely also expected. Mining and Gas/Oil industry use can be, however, clearly identified and thus features associated with indigenous communities outside these regions potentially separated. Such settlements are characterized by slightly increasing NDVI and low night-time light radiance values (table B1).
Owing to the OSM data model, there can theoretically be an infinite number of mappings from OSM data to discrete GIS layers. Here, we used the thematic layers extracted by Geofabrik. The mapping they used is described in detail by Ramm (2019). Certain layers, such as 'points of interest' or 'places' were available as point geometries, that could not be used in our analyses. Road data were available as linestring geometries only, which might potentially affect the comparisons to our results.
Elvidge et al (2017) note a background radiation of about 1 nW cm−2 sr−1 in high latitudes. This reduces the features with night-time light information further, to 44.9%. Large cities such as Seoul can have areas with radiance of larger than 100 nW cm−2 sr−1 according to Elvidge et al (2021). About 3% of the human impacted area along the Arctic coasts has values higher than this. It occurs for example on the Prudhoe Bay Oil field in Alaska, Churchill in Canada and in many oil/gas industry settlements in Western Siberia. Bennett and Smith (2017) discuss the detection of gas flaring for Bovanenkovo (Yamal, Western Siberia). They exemplify the derivation of fixed capital investment (oil as well as non-oil producing) from night-time light properties for Russia. Future studies may therefore also consider the inclusion of night-time light trends for monitoring of industrial developments across the Arctic.
The identifiable features cover only a proportion of assets which are of relevance to local communities, providing limited insight for vulnerability studies (Fritz et al 2017, Brady and Leichenko 2020). The possibility to identify built infrastructure and population centers does nevertheless contribute to assessing Arctic exposures to global warming impacts. First, the pan-arctic scale allows comparisons between different regions and landuse types. Second, the extension of the features with resource use categories provides a first step for enhanced insight into regions with limited socio-economic diversity and proximity of indigenous communities to industrial developments. Natural assets (Brady and Leichenko 2020), symbolic values (Adger et al 2011) and societal limits to adaptation (Adger et al 2009, Ford et al 2015) are critical aspects of global warming impacts in the Arctic that are not captured in this study. It therefore provides only limited insight into what is at risk for local communities. Satellite derived information, however, may aid identification of natural assets but implementation at the Arctic scale (what would require a high degree of automatizing) is challenging. For example, while built infrastructure was the focus here, satellite information using other techniques can be used to detect coastal change, including barrier islands and other coastal features that are rich in well-mapped subsistence and related traditional land use in the Arctic.
The actual interpretation regarding the impacts on local communities cannot be uniformly handled for the Arctic. Country specific developments need to be considered. Some mining and hydrocarbon infrastructures are led by Native Corporations in Alaska (Brady and Leichenko 2020) whereas such involvement is not documented for Russia. Overall, expanding infrastructure can be only observed for settlements with mining and gas/oil industry related use. While we can monitor the extent of impact, the quality of local impacts can only be assessed through in-situ fieldwork. It also needs to be considered that the development of the often externally controlled extractive infrastructure adds to the vulnerability for local residents, in addition to climate change, leading to 'double exposure' (O'Brien and Leichenko 2000).
6. Conclusions
Positive ground temperature trends during the last two decades were observed for the vast majority of identified infrastructure objects. More than half of it will shift from permafrost to non-permafrost at 2 m depth by 2050 considering a simple ground temperature trend extrapolation.
The inclusion of natural assets which are of high relevance for local communities remains open and requires future research with respect to the utility of satellite data analyses. Nevertheless, the identification of infrastructure and population centers across the Arctic provides a step forward for human impact monitoring in Arctic environments. Sentinel-1/2 derived impacts on natural assets provide more detail than any other currently available records for this region. Conventional satellite derived information is confined to densely populated regions with built-up areas and therefore the Far North, such as Svalbard, is often not included and small Arctic settlements as typical for the Arctic are not being considered. The combination with satellite derived vegetation index (NDVI) trends allows for identification of recently build infrastructure. Our results suggest that the detectable human-impacted area in the Arctic coastal region increased by 15% since 2000. The majority can be attributed to the oil/gas industry. These findings highlight continued industrial development, which also shows up in night-time lights observations. Further developments of monitoring schemes may combine classifications with NDVI and night-time light trends. Databases on coastal dynamics currently only document coastline change (Lantuit et al 2012). Such information should be combined with information on settlements and built infrastructure in order to facilitate advanced vulnerability assessment at circumpolar scale.
Data availability statement
The data that support the findings of this study will be openly available following an embargo at the following URL/DOI: https://zenodo.org/record/4925911. Data will be available from 31 October 2023.
Acknowledgments
This publication is part of the Nunataryuk and CHARTER projects. The projects have received funding under the European Union's Horizon 2020 Research and Innovation Programme under Grant Agreement Nos. 773421 and 869471. Further support was received by ESA CCI+ Permafrost, HGF AI-CORE, European Research Council project No. 885646, FFG FemTech projects CoastSAR (874213) and CoastAIMap (880182), and NSF Permafrost Discovery Gateway.
The processing scheme was developed on a highly performant virtual machine (VM) provided by the Copernicus Research and User Support (RUS). Results are based on modified Copernicus data from 2016 to 2020. The training and validation processes in this work are partially based on cadastral data of Lokalstyret in Longyearbyen, Svalbard. We also would like to acknowledge the voluntary contributors to OpenStreetMap and the anonymous reviewers for their valuable comments on the manuscript.
Appendix A.: Used datasets
Table A1. Overview of used datasets for input, comparison and evaluation.
| Dataset name | Source | Type | Used layers/ bands | Spatial coverage | Temporal coverage | Use |
|---|---|---|---|---|---|---|
| Sentinel-1 | Copernicus Data Hub | Synthetic aperture radar | C-band, Interferometric Wide swath mode (IW), Polarizations VV/VH (most areas) or HH/HV (Greenland) | Full analyses extent, spatial resolution of 5 × 20 m | 2017–2020 | Input for GBM classification |
| Sentinel-2 | Copernicus Data Hub | Multispectral | Level 1C, orthorectified images of top of atmosphere reflectance; all 10 and 20 m bands | Full analyses extent, 10 and 20 m resolution | 2016–2020 | Input for GBM and DL classification |
| Landsat | Landsat-7 and -8 archive | Multispectral | Red and Near Infrared | Full analyses extent, 30 m resolution | 2000–2018 | Input for NDVI trend retrieval |
| OpenStreetMap | Geofabrik GmbH, Karlsruhe, Germany, www.geofabrik.de/ | Streets and building information in vector format | Relevant OSM objects categories: buildings, traffic, transport, railways and roads | inconsistent coverage of analyses extent | unknown | Comparison with results |
| Permafrost_cci | Obu et al (2021a, 2021b, 2021c) | Derived from a ground thermal model using landsurface temperature | Ground temperature at 2 m depth, permafrost extent, active layer thickness | Full analyses extent, 1 km resolution | 1997–2019 | Combination with results |
| Night-time lights global dataset (VNL V2) | Elvidge et al (2021) | Derived from the visible and infrared imaging suite (VIIRS) day night band (DNB) on board of JPSS satellites (joint polar-orbiting satellite system) | Radiances in nW cm−2 sr−1 | Full analyses extent, 15 arc seconds resolution | 2016 | Combination with results |
| Arctic circumpolar settlements | Wang et al (2021) | Inhabited communities with known population | Point coordinates, names | Full analyses extent | 2017 | Comparison with results, initial input for improved settlement database |
| Cumulative impact map | Walker et al (2014) | Aerial photographs derived boundaries | Shapefiles with human impact as attributes | Three sites (each 20 km2) at the Prudhoe Bay oil extraction site, US | 1949–2011 | Evaluation of results |
| Calibration data for infrastructure mapping | Lu et al (2018) | Annotated catastral information | Shapefiles of buildings and roads | Partial coverage of Longyearbyen, Svalbard | 2018 | Evaluation of results |
Appendix B.: Considered categories for use attributes
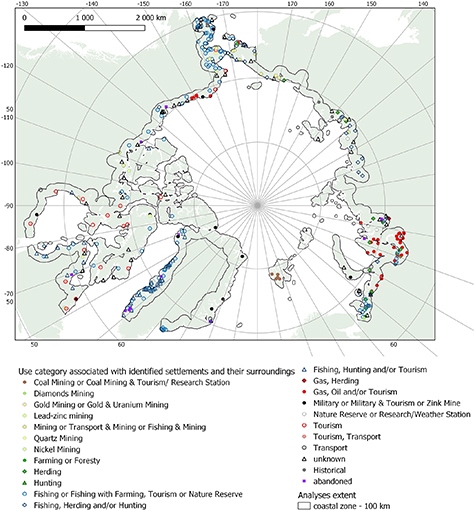
Figure B1. Assigned use categories for settlement centers with identified built infrastructure (coordinates for 285 settlements extracted from Wang et al (2021); 221 added using Bartsch et al (2021), see figure 1) based on publicly available information (analysis extent only; partially summarized, see table B1). Note, the actual extent of land use is not reflected in this representation.
Download figure:
Standard image High-resolution imageTable B1. Considered categories for use attributes at different levels. Main economic activities (use) and most relevant (general use) as well as areal extent as identified with the Sentinel-1/2 data and selected properties (average night-time light radiance in nW cm−2 sr−1 (NR) and normalized difference vegetation index (NDVI) trend are provided.
| Use | General use | Area (km2) | NR | NDVI trend |
|---|---|---|---|---|
| Coal mining | Mining | 4.19 | No data | −0.16 |
| Coal mining, tourism | Mining | 4.51 | No data | 0.09 |
| Diamonds mining | Mining | 0.25 | 1.88 | 0.05 |
| Farming | Agriculture | 2.55 | 3.73 | 0.02 |
| Fishing | Fishing | 88.90 | 5.36 | 0.01 |
| Fishing, education | Fishing | 0.56 | 10.05 | −0.02 |
| Fishing, farming | Fishing | 0.77 | 9.75 | 0.01 |
| Fishing, gold mining | Mining | 34.32 | 3.23 | 0.03 |
| Fishing, herding | Fishing | 1.91 | 4.39 | 0.04 |
| Fishing, herding, hunting | Fishing | 10.57 | 5.03 | 0.01 |
| Fishing, hunting | Fishing | 36.35 | 4.35 | 0.02 |
| Fishing, hunting, tourism | Fishing | 0.86 | 9.73 | 0.04 |
| Fishing, tourism | Fishing | 32.12 | 8.47 | 0.01 |
| Forest | Other | 1.28 | 1.94 | 0.07 |
| Gas, herding | Gas/oil | 1.00 | 9.84 | 0.01 |
| Gas/oil | Gas/oil | 410.56 | 31.48 | −0.03 |
| Gas/oil, tourism | Gas/oil | 5.29 | 33.77 | 0.02 |
| Gold mining | Mining | 64.06 | 1.25 | 0.03 |
| Gold & uranium mining | Mining | 4.07 | 1.67 | 0.01 |
| Herding | Agriculture | 17.62 | 7.52 | 0.01 |
| Historical | Other | 1.84 | 1.60 | 0.03 |
| Hunting | Other | 2.82 | 0.11 | 0.04 |
| Lead−zinc mining | Mining | 11.22 | 0.00 | 0.02 |
| Military | Military | 39.52 | 3.21 | 0.04 |
| Military, tourism | Military | 5.12 | 1.80 | 0.01 |
| Mining | Mining | 58.20 | 0.48 | 0.04 |
| Nature reserve | Other | 0.95 | 7.52 | −0.04 |
| Nickel mining | Mining | 51.96 | 3.85 | −0.02 |
| Quartz mining | Mining | 0.93 | 0.00 | 0.00 |
| Research station | Other | 0.01 | 5.18 | −0.08 |
| Research station, coal mining | Other | 0.46 | No data | 0.13 |
| Tourism | Other | 71.01 | 6.64 | 0.00 |
| Transport | Other | 4.83 | 2.46 | 0.03 |
| Transport, mining | Other | 16.84 | 2.07 | 0.06 |
| Abandoned | Abandoned | 32.50 | 0.96 | 0.02 |
| Unknown | Other | 67.19 | 2.96 | 0.02 |
Appendix C.: Additional regional results plots

Figure C1. Area extent of Landsat-based normalized difference vegetation index (NDVI) change trends 2000–2018 for each class of human impacted areas as mapped with Sentinel-1 and -2 by country/region (analysis extent only).
Download figure:
Standard image High-resolution image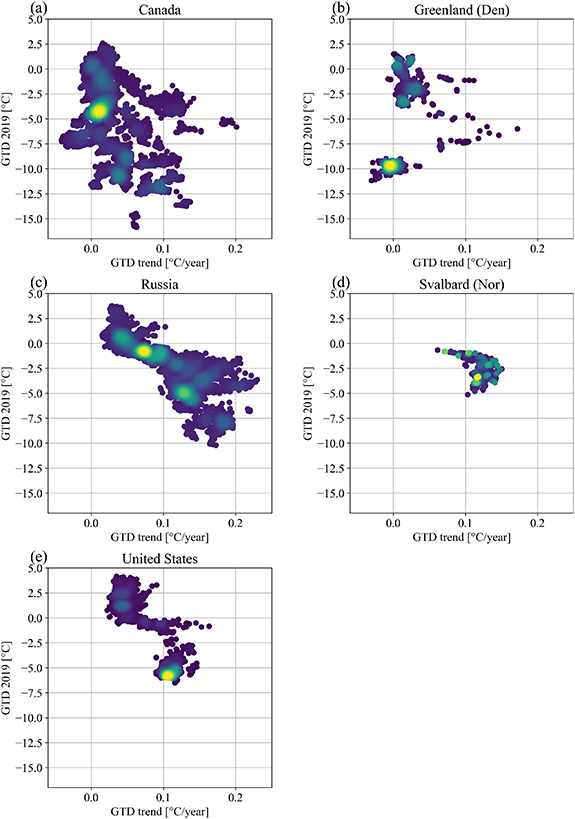
Figure C2. Scatterplots of ground temperature (GTD; 2 m depth) trend versus 2019 status for different countries/regions (analysis extent only). Each point represents the average for a distinct object (human impacted area) as mapped with Sentinel-1 and -2 (Bartsch et al 2021).
Download figure:
Standard image High-resolution image