

Abstract
Understanding climate change impacts on wildland fire activity has been constrained by the high uncertainty embedded in the prediction of fire size (FS), annual number of fires (ANF), and annual area burned (AAB). While there has been a sustained effort to make connections between fire weather and fire activity, most studies have focused on individual parameters instead of treating them as a connected group. This study explores the intrinsic relationships among the major parameters of fire activity and how they relate to fire-conducive weather conditions to determine optimal prediction models. We found maximum number of fire spread days and maximum FS best predict ANF and AAB, respectively. Assessing the robustness of these relationships across Canada's ecozones showed they are stronger in the Cordillera than in the Shields and Plains and more universal for AAB than for ANF. We also found skewness of FS distributions may play an important role in relationship strength. These relationships provide a unique way to model future fire activities under changing climate conditions.
Export citation and abstract BibTeX RIS

Original content from this work may be used under the terms of the Creative Commons Attribution 4.0 license. Any further distribution of this work must maintain attribution to the author(s) and the title of the work, journal citation and DOI.
1. Introduction
Wildland fire is a natural process that has shaped Canadian forests for thousands of years (Richard 1993, Price et al 2013). Coupled with the changing climate, it is projected to reshape Canada's temperate and boreal biomes in terms of vegetation structure, pattern, and species composition (Stralberg et al 2018). These changes in vegetation will in turn redefine Canada's fire regimes over the 21st century (Flannigan and van Wagner 1991, Boulanger et al 2014). In the last 50 years, fires burned an average of 2 Mha yr−1 in Canada (Stocks et al 2002, Hanes et al 2019). Although large fires (>200 ha) represent only 3.2% of wildland fires, they are responsible for 96.8% of the total area burned (Hanes et al 2019). The majority of this area is burned over a few severe fire-conducive weather days (termed 'spread days'; Podur and Wotton 2011, Wang et al 2014). Accordingly, large fire events play a major role in determining the scale and extent of fire impacts. It is therefore significant that the frequency of these large fires has been increasing in Canada in recent years (Hanes et al 2019). Understanding the intricate interactions among fire weather potential and major fire activity parameters can enhance our comprehension of current and future fire regimes.
Fire regimes characterize an area's dominant wildfire frequency, size, seasonality, cause, intensity, severity, type (surface, crown, or ground), and total area burned (e.g. Weber and Flannigan 1997, Stocks et al 2002, Hanes et al 2019). Typified by their respective topography, fuel composition, and weather or climate patterns, some of these fire regime parameters are concurrent. For example, alongside continuously warming climates, North America has seen increasing annual number of fires (ANF), fire size (FS), and annual area burned (AAB; e.g. Kasischke and Turetsky 2006, Dennison et al 2014, Abatzoglou and Williams 2016, Hanes et al 2019, Coogan et al 2020). These increases conform with the increasing fire season length (Jolly et al 2015, Jain et al 2017, Hanes et al 2019) and the escalating severity of fire-conducive weather conditions (e.g. Jain et al 2017, Schoennagel et al 2017, Holden et al 2018). When fuel is not a limiting factor, ANF, FS, and AAB are all controlled by fire-conducive weather (e.g. Flannigan et al 2005, Wotton et al 2010, Wang et al 2020) and thus intrinsically linked. However, these relationships are not easily quantifiable due to their nonlinear nature (Wang et al 2020).
Although ANF, FS, and AAB are the most commonly reported fire regime parameters for characterizing fire activity (e.g. Stocks et al 2002, Miller and Ager 2013, Hanes et al 2019), predicting these parameters has presented a major challenge (e.g. Flannigan et al 2005, Wotton et al 2010, Wang et al 2020). The difficulty is due to both inherent uncertainties in fire environments (e.g. Boulanger et al 2018) and complex interactions among factors affecting fire ignition and spread (e.g. fire weather, fuel conditions, topographical features, and fire suppression; Erni et al 2018). In addition, these parameters are typically studied individually, with great efforts made in modeling FS distributions (e.g. Cumming 2001, Reed and McKelvey 2002, Schoenberg et al 2003, Cui and Perera 2008, O'Donnell et al 2014, Hantson et al 2016, Westerling 2016, Marchal et al 2017), predicting AAB (e.g. Flannigan et al 2005, Abatzoglou and Kolden 2013, Boulanger et al 2014, 2018, Kitzberger et al 2017), and projecting ANF (e.g. Krawchuk et al 2009, Wotton et al 2010, Bar Massada et al 2013). However, because few studies have explored these parameters together (but see Venevsky et al 2002, Westerling et al 2011, Veraverbeke et al 2017, Wang et al 2020), there is limited understanding of the interactions that may exist among them and whether these relationships may be leveraged to improve the accuracy of future fire activity predictions.
Given the control fire-conducive weather (i.e. number of spread days (NSD)) has over FS, ANF, and AAB, it provides a potential entry point for connecting fire weather to these fire activity measures. A fire's NSD strongly relates to its size because it characterizes the duration of burning (Podur and Wotton 2011, Wang et al 2020). An extension of this linkage allows projecting future AAB (Wang et al 2020), however, it relies on ANF—a very challenging parameter to predict (e.g. Wotton et al 2010). Assuming a consistent fire frequency over time is a major limitation to a more insightful understanding of climate change impacts on fire activity. This constraint may be overcome by either: (a) determining a single parameter of fire activity that is representative of all the others since they are all related; or (b) modeling the direct connections between fire weather potential (i.e. NSD), AAB, and ANF to provide a more accurate projection of future fire activities. It is known that FS distribution can be projected into the future (Wang et al 2020), however, the relationship between mean FS and AAB or ANF is neither consistent nor robust. In addition, the direct relationship between fire weather potential and AAB or ANF has not yet been explored.
In this study, we conduct an exhaustive investigation of the relationships between NSD, FS, ANF, and AAB. We selected statistics (e.g. percentiles) of both NSD and FS to model these relationships; this was necessary because NSD and FS are individual fire-based features, while AAB and ANF summarize all fires in a given year. The objectives of this study were to: (a) find the optimal prediction models for ANF and AAB based on the daily fire spread potential (NSD) and FS, (b) assess the robustness of these relationships, and (c) discuss potential applications of these models. Specifically, we explore the implications of extreme fire events on overall fire activity.
2. Methods
2.1. Study area
The study area encompasses the predominantly forested landmass of Canada, bounded by the shrub tundra in the north and the extensive cultivated and developed urban areas in the south. The Western Cordillera system rises in the west and the rest of the country is relatively flat. Three major biomes, the temperate coniferous forests (west coast), the temperate broadleaf and mixed forests (east coast and Great Lakes area), and the boreal forests (central Canada and north of the two other biomes) constitute the main body of Canadian forests. In this study, the Canadian Ecozones (Ecological Stratification Working Group 1995; figure 1) were used as the primary analysis units to assess model strength in ecologically distinct regions within the vast study area. Fire regime type (FRT; Erni et al 2020) was included as a secondary zonation unit to further exhibit model robustness.
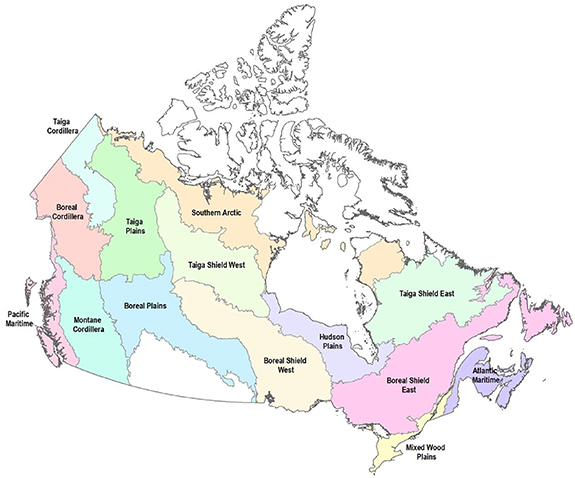
Figure 1. The Canadian Ecozones (Ecological Stratification Working Group 1995). Three ecozone groups were identified including Cordillera (Taiga, Boreal, and Montane), Plains (Taiga, Boreal, and Hudson), and Shield (Taiga (east and west) and Boreal (east and west)).
Download figure:
Standard image High-resolution image2.2. Data used in the analysis
Datasets of two separate date ranges were used in this study, 1986–2019 for the fire dataset and 2001–2019 for the spread days of historical fires.
2.2.1. Fire data
The National Burned Area Composite (NBAC) dataset (Hall et al 2020) was used in this study. NBAC is a geographic information system (GIS) database and system that detects and vectorizes the burned forest area across the country for each year between 1986 and 2019. This dataset is considered the most consistent and accurate in terms of mapping the true burned area of wildfires in Canada.
2.2.2. NSD
The spread days of historical fires were generated using three data sources: (a) NBAC data from 2001 to 2019 for fires ⩾50 ha, (b) Moderate Resolution Imaging Spectroradiometer (MODIS 4 ) fire detection data (hotspots) for fires from 2001 to 2012, and (c) Visible Infrared Imaging Radiometer Suite (VIIRS) hotspots for 2013–2019. Daily fire spread was assessed following Parks (2014) using both the perimeter of fires from NBAC and the MODIS or VIIRS hotspots. Fire progression was mapped for every burning day at a 30 m resolution by spatially interpolating the hotspots data (1 km resolution). Spread days were determined following Wang et al (2014). These are days in which the spread distance exceeds 240 m following a circular fire growth model. This definition corresponds to daily fire progressions calculated for a nominal rate of spread of at least 1 m min−1, assuming a 4 h burning period each day and circular growth (see Hirsch 1996). In the study area, NSD for each fire from 2001 to 2019 was tallied.
2.3. Predicting AAB and ANF based on NSD
Long-lasting droughts are responsible for tree mortality (e.g. Michaelian et al 2011) and an increased flammability of fuels (van Wagner 1987); these effects become more severe the longer a drought lasts. Because the NSD is a surrogate for the duration of a hot-dry period (Wang et al 2014, 2017), the maximum NSD (NSDmax) usually represents the longest hot-dry period of the fire season. With the accumulated effect of drought on fuel moisture, fine fuel moisture code (FFMC) and duff moisture code (DMC) may become higher over time without reset, which makes both human-caused and lightning-caused ignitions more likely to occur. Based on the NBAC data for fires (⩾50 ha) from 2001 to 2019, we systematically tested the relationship between NSD and AAB and between NSD and ANF by both ecozone and FRT. Using the mean, median, 95th percentile, 99th percentile, and NSDmax for fires each year, we fitted the log–log regression model between NSD and AAB, and NSD and ANF, to determine the measure of NSD that has the best predictive power. This model maintains the power-law relationship between x and y, while log transforming the variables to correct for skewness:

The adjusted r2 was used to measure goodness of fit.
To test the predictive power robustness, we performed a bootstrapping simulation procedure. These simulations were performed for all data (NBAC ⩾ 50 ha from 2001 to 2019) and by topographical features including Cordillera, Plains, and Shields. For each subset of the fire data, we randomly selected 500 fires and performed the log–log regression model between NSD, AAB, and ANF. The adjusted r2 was extracted as the measure of the goodness of fit. This was repeated 5000 times and the distribution of the adjusted r2 was summarized.
2.4. Size of fire event and AAB and ANF
Using equation (1) and NBAC data, we modeled the relationship between FS and AAB, and FS and ANF by the aforementioned zonation systems. We tested whether the median, 95th percentile, 99th percentile, or maximum FS (FSmax) was the best predictor of AAB and ANF. We also tested whether the minimum size threshold for fires to be included in the analysis would have any impacts on the strength of the relationship. We chose minimum FS thresholds of 1 ha, 5 ha, 10 ha, 50 ha, 100 ha, and 200 ha to investigate how the modeled relationship changes. The relationship between ANF and AAB was also modeled using this procedure.
We performed bootstrapping simulations to test the robustness of correlations among FS, ANF, and AAB. These simulations were conducted with various minimum FS thresholds to determine if minimum FS had any influence on the robustness of the relationships. For each NBAC FS threshold subset, 500 fires were randomly selected from the dataset and the log–log regression models were fitted between each pair of the three variables (FS, ANF, and AAB). The FS statistic used in the simulations has the best predictive power for both ANF and AAB. This procedure was repeated 5000 times for each NBAC FS threshold subset and the adjusted r2 values were summarized to determine whether the relationship is consistent with the changing minimum FS threshold. We performed the same simulations for each region dominated by different topographical features (figure 1).
Changing the minimum FS in the analysis may also change overall FS distributions, which in turn may affect the relationship between the pairs among FS, AAB, and ANF. To address this, we calculated the skewness (Zar 2010) of FS distribution at various minimum FS thresholds to show the changing trend. All analyses in this study were performed using R software (R Core Team 2020).
3. Results
3.1. Predicting AAB and ANF based on NSD
Although mean NSD showed strong predictive power for certain units (tables S1 and S2 (available online at stacks.iop.org/ERL/16/114031/mmedia)), the NSDmax and 99th percentile of NSD are equally the strongest predictors of both AAB and ANF. The results showed consistently strong predictive power for AAB across all ecozones (tables 1 and S1) and FRT units (table S2); however, the goodness of fit varies for ANF. Similarly, the relationship between AAB and ANF varies by zonation unit but is consistently stronger than the relationship between NSDmax and ANF (table 1). Interestingly, at the ecozone level (figure 1) the Boreal Plains showed a significantly weaker relationship than all other zones (table 1).
Table 1. Adjusted r2 of log–log linear regression model between pairs among NSDmax, AAB, and ANF by Canadian Ecozone (Ecological Stratification Working Group 1995) based on fires ⩾50 ha for 2001–2019 where remote sensed fire records are available. All models are significant (p < 0.01).
| NSDmax | |||
|---|---|---|---|
| Ecozone a | AAB | ANF | AAB/ANF |
| Boreal Cordillera | 0.61 | 0.36 | 0.86 |
| Boreal Plains | 0.61 | 0.12 | 0.28 |
| Boreal Shield East | 0.88 | 0.75 | 0.87 |
| Boreal Shield West | 0.77 | 0.56 | 0.67 |
| Hudson Plains | 0.83 | 0.74 | 0.72 |
| Montane Cordillera | 0.86 | 0.71 | 0.87 |
| Pacific Maritime | 0.87 | 0.72 | 0.63 |
| Taiga Cordillera | 0.85 | 0.45 | 0.59 |
| Taiga Plains | 0.94 | 0.79 | 0.87 |
| Taiga Shield East | 0.86 | 0.73 | 0.83 |
| Taiga Shield West | 0.69 | 0.60 | 0.59 |
a Atlantic Maritime and Mixed Wood Plains were excluded from the table due to the lack of data for 2001–2019.
Our simulation showed that the relationship between NSDmax and AAB is consistently high (figure 3), however, it is more pronounced in the Cordillera than in the Plains or Shield. For ANF, the predictive power is strongest in the Cordillera and weakest in the Plains. The relationship between ANF and AAB is more consistent in the Cordillera, which is similar to that between NSDmax and AAB (figure 2). This relationship is also weakest in the Plains.
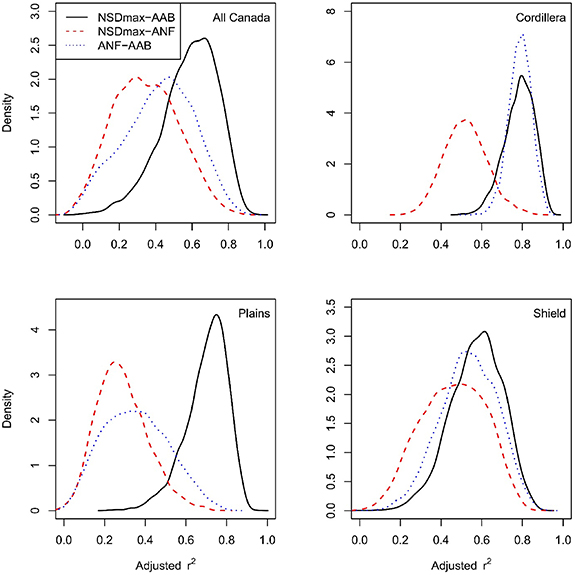
Figure 2. Distribution of adjusted r2 from the simulated log–log linear regression models between pairs of NSDmax, AAB, and ANF by the whole study area and Canadian ecozone groups including Cordillera, Plains, and Shield (figure 1) based on fires ⩾50 ha for 2001–2019 where remote sensed fire records are available.
Download figure:
Standard image High-resolution image
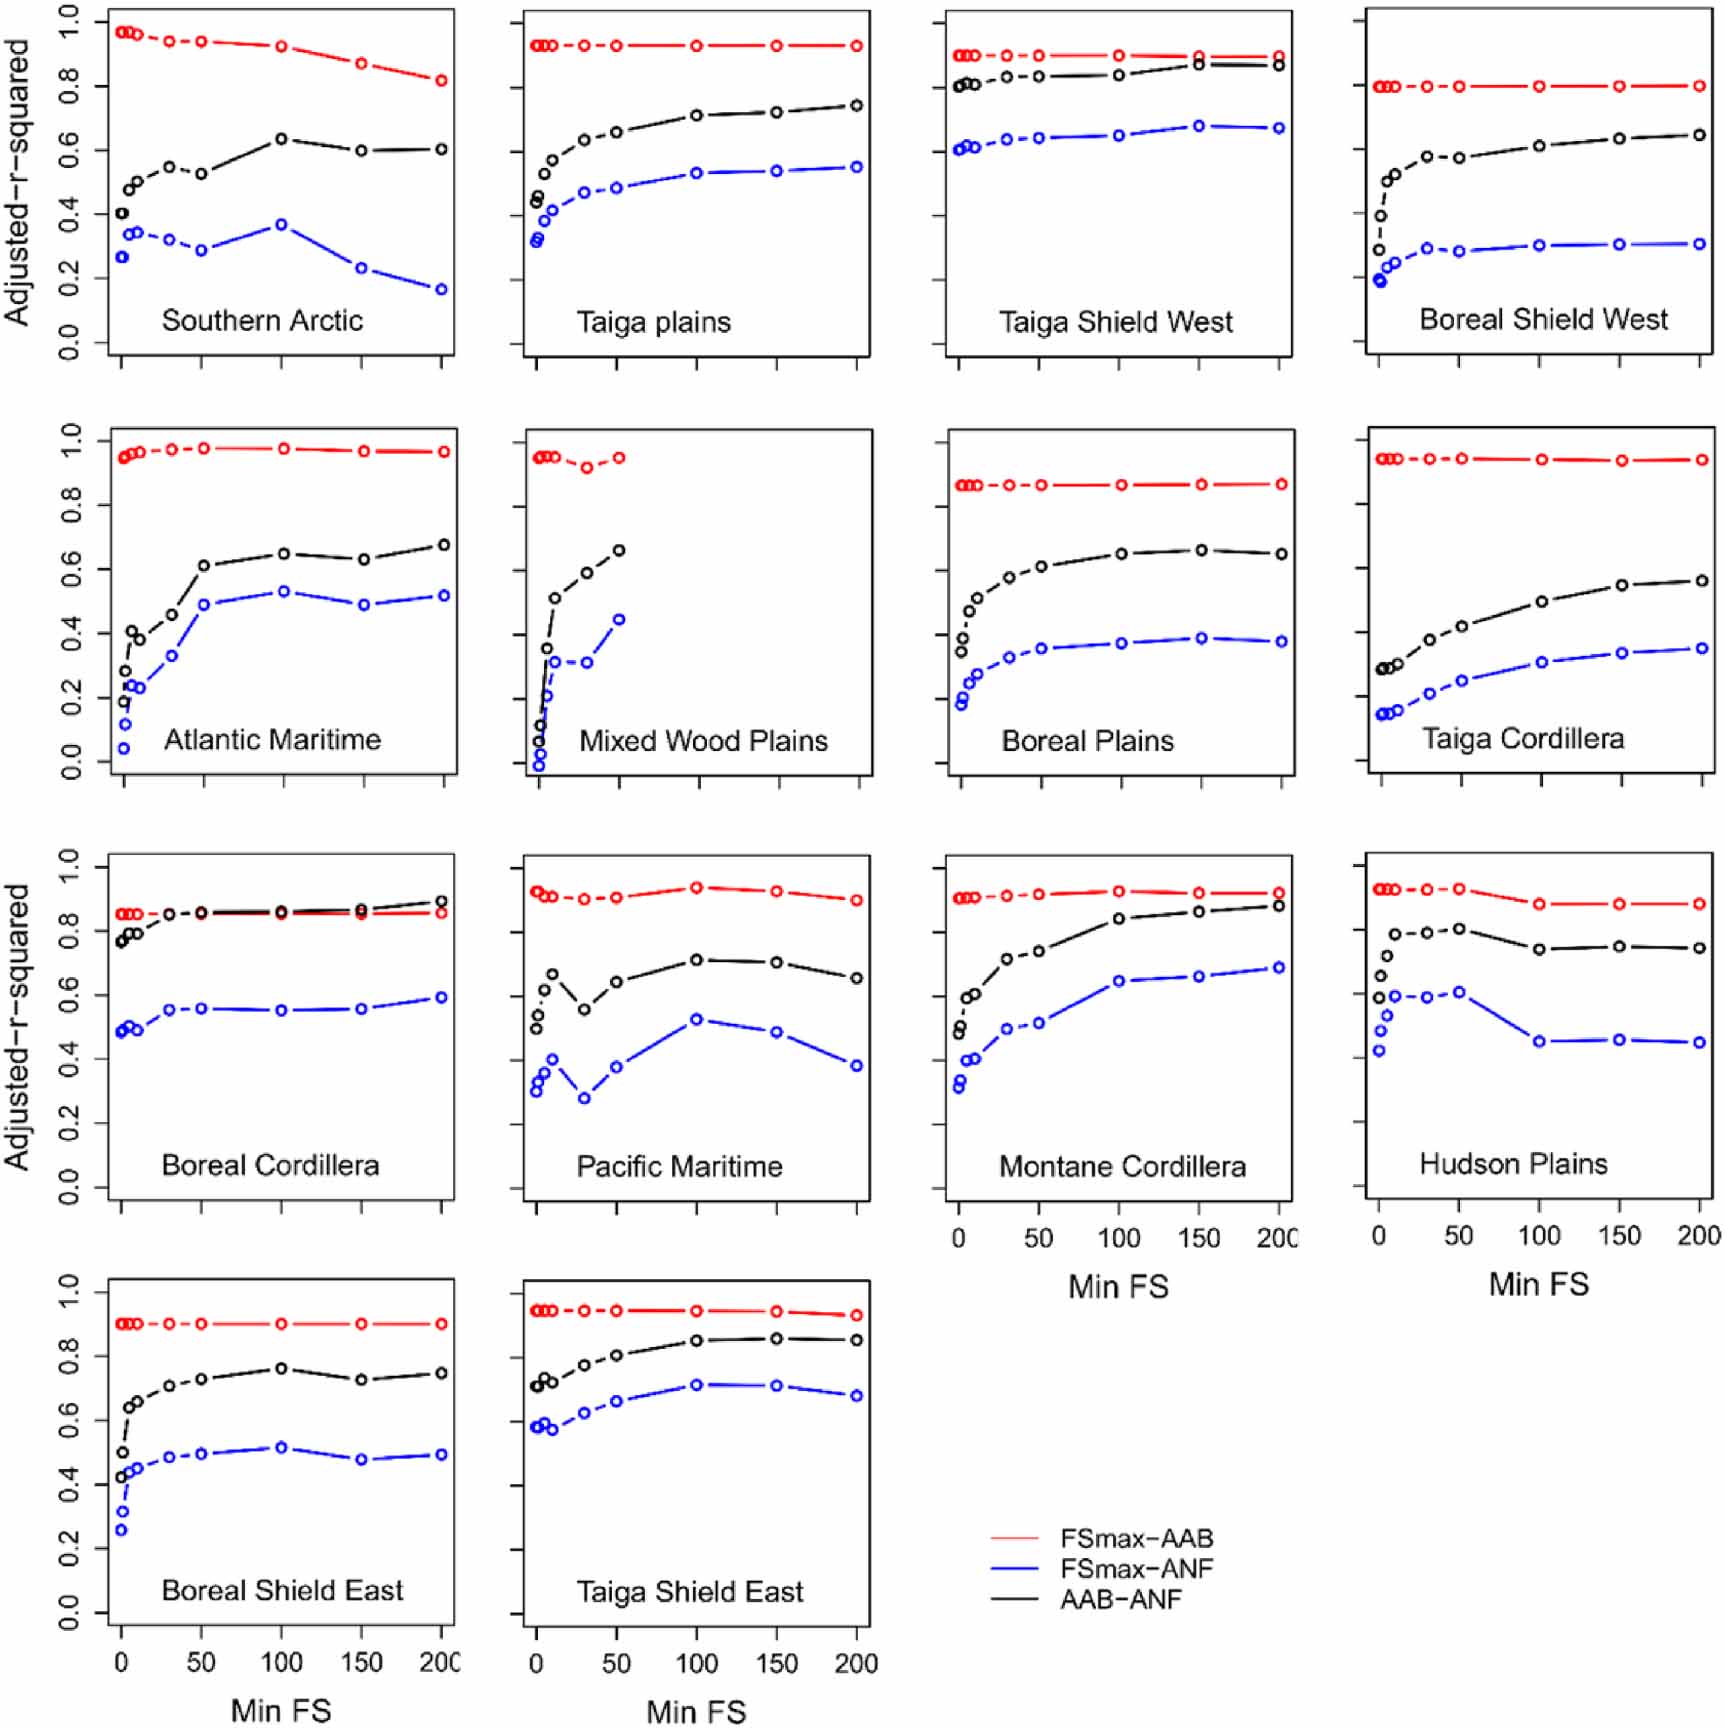
Figure 3. Adjusted r2 of the log–log linear regression models between pairs among FSmax, AAB, and ANF by Canadian Ecozone (Ecological Stratification Working Group 1995) at various minimum FS thresholds (ha).
Download figure:
Standard image High-resolution image3.2. Predicting AAB and ANF based on FS
We found that FSmax was the best predictor of both AAB and ANF, with the 99th percentile being second best. The predictive power measured with adjusted r2 showed that FSmax is a much better predictor for AAB (table 2) in comparison to NSDmax (table 1). As expected, the relationship between AAB and ANF shows no statistical difference between the NBAC and remote sensing data (p > 0.89; tables 1 and 2); however, the relationships between NSDmax and ANF (table 1) are generally stronger than those between FSmax and ANF (table 2) across all datasets.
Table 2. Adjusted r2 of log–log linear regression model between pairs among FSmax, AAB, and ANF by Canadian Ecozone (Ecological Stratification Working Group 1995) based on fires ⩾50 ha for 1986–2019 where NBAC data are available. All models are significant (p < 0.01).
| Fsmax | |||
|---|---|---|---|
| Ecozone | AAB | ANF | AAB/ANF |
| Atlantic Maritime | 0.98 | 0.49 | 0.61 |
| Boreal Cordillera | 0.85 | 0.56 | 0.86 |
| Boreal Plains | 0.87 | 0.36 | 0.61 |
| Boreal Shield East | 0.90 | 0.50 | 0.73 |
| Boreal Shield West | 0.80 | 0.28 | 0.57 |
| Hudson Plains | 0.93 | 0.60 | 0.80 |
| Mixed Wood Plains | 0.95 | 0.45 | 0.66 |
| Montane Cordillera | 0.92 | 0.52 | 0.74 |
| Pacific Maritime | 0.91 | 0.38 | 0.64 |
| Southern Arctic | 0.94 | 0.29 | 0.53 |
| Taiga Cordillera | 0.94 | 0.25 | 0.42 |
| Taiga Plains | 0.93 | 0.49 | 0.66 |
| Taiga Shield East | 0.95 | 0.66 | 0.81 |
| Taiga Shield West | 0.90 | 0.64 | 0.83 |
The minimum FS threshold used in the analysis impacts the strength of the relationship between FSmax, AAB, and ANF (figures 3 and S1). These relationships usually become stable and strong when the minimum FS threshold is around 50–100 ha. The relationship strength patterns are consistent among the three pairs, with the strongest relationship being between FSmax and AAB, while the weakest is between FSmax and ANF.
In terms of relationship stability, we found that FSmax and AAB are highly correlated (in log–log transition form) regardless of the spatial environment variations (figure 4(A)). Their relationship is similarly strong in the Cordillera and the Plains, with an adjusted r2 consistently above 0.5 across all simulation cases. We also found that with an increased minimum-FS threshold the strength of correlation between these two variables decreased, although the extent of the decrease is quite mild (less than 0.1). The relationship between FSmax and ANF is comparatively weaker (figure 4(B)) but is much stronger in the Cordillera than in the Plains and Shields. The AAB and ANF relationships (figure 4(C)) are stronger overall than the relationships between FSmax and ANF, but lower than those between FSmax and AAB. With increasing minimum FS, the strength of correlations for the latter two pairs showed an increasing trend.
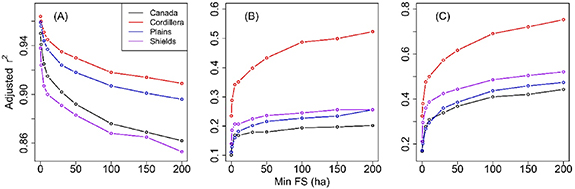
Figure 4. Mean adjusted r2 of the simulated log–log linear regression models between pairs among FSmax, AAB, and ANF at various minimum FS thresholds (ha) by the whole study area and ecozone groups including Cordillera, Plains, and Shields (figure 1). (A) FSmax vs AAB; (B) FSmax vs ANF; (C) AAB vs ANF.
Download figure:
Standard image High-resolution imageIncreasing the minimum FS used in analysis decreases the skewness of FS distributions following a power law curve (figure 5(A)). Although the predictive power of FSmax for AAB is very high across all skewness levels (figure 4(A)), the predictive power does increase with skewness (figure 5(B)). In other words, the relationship between FSmax and AAB is stronger when the FS distribution is highly skewed (figures 5(A) and (B)). The opposite is true for ANF, where increasing skewness decreases the predictive strength of FSmax (figure 5(B)). These trends were common across most ecozones (figure 3).

Figure 5. At the study area, (A) relationship between minimum fires used in the analysis and the skewness of the fire size distributions based on the NBAC database. (B) Relationship between FS distribution skewness and the mean adjusted r2 for both AAB and ANF predictions based on FSmax simulated at various minimum FS thresholds.
Download figure:
Standard image High-resolution image
In comparison to the simulated relationships between FSmax, AAB, and ANF (figure 4), the observed relationships (figure 3) are relatively stronger than the simulated means, particularly between FSmax and ANF.
4. Discussion
Making connections between fire weather potential and fire activities has been an ongoing effort in fire research (e.g. Gillett et al 2004, Flannigan et al 2005, Balshi et al 2009, Wotton et al 2010, Westerling et al 2011, Abatzoglou and Williams 2016, Wang et al 2020). In this study, we explored the possibility of linking fire weather potential, in terms of NSD, to major fire activity parameters including the FS, ANF, and AAB. Our results show that the NSDmax or the 99th percentile of NSD in a year is the best predictor of AAB and ANF. Because NSD can be a surrogate FS (Wang et al 2020), all three fire activity parameters are directly predictable from NSD. We also found that FSmax is the best predictor of AAB in all circumstances; however, its predictive power for ANF varies by spatial location and is weaker than NSDmax. Overall, FSmax is best for predicting AAB, while NSDmax is better for predicting ANF. The predictive power of AAB for ANF, however, is stronger than both FSmax and NSDmax.
The minimum FS used in the analysis does affect the strength of the relationships among FSmax, AAB, and ANF. For a fixed left-skewed FS distribution, the bigger the minimum FS used in the analysis, the smaller the skewness. Increasing the minimum FS used in analysis may reduce the predictive power of FSmax for AAB, but it enhances its power in predicting ANF. In addition, the largest fire in the highly left-skewed FS distribution contributes more to the total area burned than it does in a less-skewed FS distribution. It is well established that FS distributions are left skewed (e.g. Cumming 2001, Reed and McKelvey 2002, Schoenberg et al 2003, Cui and Perera 2008, O'Donnell et al 2014, Hantson et al 2016, Westerling 2016, Marchal et al 2017), therefore the relationship between FSmax and AAB will be very robust unless future fires become uniformly large under changing climate conditions. This strong relationship could be useful in estimating the impacts of extreme fire events (i.e. FSmax or 99th percentile of the FS with a given AAB) when a reverse form of the regression is fitted.
Topographical features influenced the performance of all models. We found that the predictive power is strongest in the Cordillera and weakest in the Shield for AAB, and strongest in the Cordillera but weakest in the Plains for ANF. The predictive power of AAB over ANF is similar to those of other ANF predictions at various topographical features but tends to be stronger than NSDmax and FSmax. Comparing FS distributions, the Cordillera and Plains had similar but much higher skewness than that of the Shield, which may partially explain the strong predictive power of FSmax over AAB in the Cordillera and the Plains (ref figure 5). However, skewness alone may not be sufficient to explain the variance in the predictive model strength for ANF between topographical regions. Among the three plains, the Boreal Plains showed the lowest predictive power in ANF (table 1), which might indicate the influence of excessive human-caused fires (>65%) in comparison to other ecozones (<50%) and fire management (i.e. initial attack strategy, resource availability); however, further explorations are needed for a better understanding of this result. Of note, the relationships are stronger at some zonation units than the simulation means, implying that other factors (e.g. fuel types, local weather patterns) may also play important roles.
The findings in this study may have significant implications. Linkages between NSDmax (or 99th percentile of NSD) and AAB and ANF provide a simplified method to project future shifts in these variables with climate change compared to some of the earlier studies (e.g. Venevsky et al 2002, Westerling et al 2011, Veraverbeke et al 2017, Wang et al 2020). As daily fire weather potential (i.e. fire conducive weather conditions, potential spread days) can be defined based on FWI System variables (Podur and Wotton 2011) and used to model the real NSD (Wang et al 2014), future NSDmax can be projected with the changing climates (i.e. Wang et al 2016, 2017). It is therefore possible that AAB and ANF can also be projected into the future with different climate change models and scenarios. This method is much simpler than previously proposed approaches (e.g. Boulanger et al 2018, Wang et al 2020). The weakness of direct projection of FSmax based on NSDmax (figure S2 and table 1) makes the direct projection of AAB based on NSDmax more appealing than first projecting FSmax and then using FSmax to estimate AAB. Due to the very strong relationship between AAB and FSmax, future extreme fire events may be projected if AAB is estimated based on NSDmax (or 99th percentile of the NSD at that year). In addition, because of the strong relationship between AAB and ANF, future ANF could be modeled given a future AAB.
Our study did not explore the minimum spatial units required for these relationships to exist. We have assumed that as long as there are enough fire records (⩾15–20 fires yr−1) within a spatial/temporal unit, these relationships should present as the simulations have shown. The relationship between FSmax and AAB should not change with the changing minimum FS assuming AAB is fixed (i.e. minimum FS is >0 ha) for a year. This is significant as it demonstrates how the strength of prediction changes when an arbitrary minimum size is used to limit fire data collection. In addition, our analysis did not consider fire seasonality; it is assumed that if the FS distributions are left skewed, these relationships should be consistent. The mathematical relationship between maximum value and the integral area in a skewed distribution requires further exploration. Understanding the role of the extreme values in a distribution may lead to a better understanding of how extreme events are triggered (e.g. Malamud et al 1998) and how to avoid their occurrence. Further exploration may help to better understand the relationships found in this study.
5. Conclusion
This study explored the relationships between extreme fire events and fire activity parameters. We found that the NSDmax and FSmax that occur in a year are the best predictor of ANF and AAB respectively. The strong relationship that exists between AAB and ANF for certain landscapes may provide a unique approach to model ANF with changing climates. These relationships are stronger in the Cordillera area than in the Shield and Plains in Canada. The linkages between extreme fire events and the frequency and extent of fires may have something to do with the FS distribution. Further, the skewness of these distributions may play an important role in determining the strength of these relationships. Further exploration may help to better understand the relationships found in this study.
Data availability statement
The data that support the findings of this study are available upon reasonable request from the authors.
Footnotes
- 4
NASA MCD14ML product, Collection 5, Version 1, available at: https://fsapps.nwcg.gov/afm/activefiremaps.php.