

Abstract
Solar photovoltaic (PV) energy is one of the fastest growing renewable energy sources globally. However, the dependency of PV generation on climatological factors such as the intensity of radiation, temperature, wind speed, cloud cover, etc can impact future power generation capacity. Considering the future large-scale deployment of PV systems, accurate climate information is essential for PV site selection, stable grid regulation, planning and energy output projections. In this study, the long-term changes in the future PV potential are estimated over Australia using regional climate projections for the near-future (2020–2039) and far-future (2060–2079) periods under a high emission scenario that projects 3.4 °C warming by 2100. The effects of projected changes in shortwave downwelling radiation, temperature and wind speed on the future performance of PV systems over Australia is also examined. Results indicate decline in the future PV potential over most of the continent due to reduced insolation and increased temperature. Northern coastal Australia experiences negligible increase in PV potential during the far future period due to increase in radiation and wind speed in that region. On further investigation, we find that the cell temperatures are projected to increase in the future under a high emission scenario (2.5 °C by 2079), resulting in increased degradation and risks of failure. The elevated cell temperatures significantly contribute to cell efficiency losses, that are expected to increase in the future (6–13 d yr−1 for multi-crystalline silicon cells) mostly around Western and central Australia indicating further reductions in PV power generation. Therefore, long-term PV power projections can help understand the variations in future power generation and identify regions where PV systems will be highly susceptible to losses in Australia.
Export citation and abstract BibTeX RIS

Original content from this work may be used under the terms of the Creative Commons Attribution 4.0 license. Any further distribution of this work must maintain attribution to the author(s) and the title of the work, journal citation and DOI.
1. Introduction
With the high rate of global warming and enhanced greenhouse gas emissions, Australia has moved towards sustainable energy systems by deploying renewable technologies in the last decade. Almost 27.7% of Australia's electricity was generated from renewable energy in 2020 (Clean Energy Australia Report 2021). Large-scale renewable energy generation capacity of almost 2 GW was added to the electricity grid in 2020, which includes an additional 893 MW of generation capacity in large-scale solar photovoltaic (PV) power plants along with a 3 GW capacity of rooftop PV. The solar PV capacity is expected to increase by 20 GW by 2026 and by another 72 GW by 2050 to meet the zero net emissions target (Energy Networks Australia 2017). To achieve these targets, resource assessments and energy production forecasts at all timescales will be required during the planning, construction and operation phases of a solar plant (Crook et al 2011), along with planning storage solutions for mitigating the variable electricity generation of PV systems.
Energy generated from PV at a site mainly depends on solar irradiance availability at that location, the solar cell efficiency and the cell temperature. PV power output decreases linearly with the increase in cell temperature. Previous studies have reported a decline of 0.45% for multi-crystalline silicon cells (Kaldellis et al 2014), 0.32% for copper indium gallium diselenide cells, 0.28% for cadmium telluride cells (Fu et al 2017) with every 1 °C rise in cell temperature. The PV power output varies non-linearly with irradiance, especially at lower intensities (Müller et al 2019). Climate variables like cloud cover, wind speed, aerosols and relative humidity (Pérez et al 2019, Solaun and Cerdá 2019) also affect PV production. Global solar irradiance is directly dependent on cloud cover and atmospheric conditions. The cloud cover pattern and precipitation distribution rates are likely to change in the future under different warming scenarios (Collins et al 2013, Moon and Ha 2020). Dependency of PV power output on these meteorological factors introduces a large uncertainty for investments. Thus, mitigating risks for investments in future large-scale PV plants requires detailed future climate analysis, as well as financial analysis to determine the economic feasibility of a project.
Several studies to quantify the long-term changes in future PV power availability have been undertaken globally, as well as regionally, using climate projections. Global studies based on coarse-resolution global simulations including the Coupled Model Intercomparison Project 3 and 5 (CMIP3 and CMIP5) (Crook et al 2011, Wild et al 2015) projections indicate little predicted changes in the PV production over Australia. Crook et al (2011) investigated the future changes in concentrated solar power and PV productivity and have suggested an increase in PV productivity over Europe and China, a decrease over the USA and Saudi Arabia, and a slight decline over Australia and Algeria by 2080. Wild et al (2015) suggest that PV power may increase in Spain and Germany, decrease in North-India and North-West China with an almost negligible increase over Australia by 2049. None of these studies explicitly considered the additional impact of changes in cell temperatures. Regional studies, with both higher resolution regional model simulations and coarser resolution climate projection data, have been carried out for various parts of the world. These include studies for Europe (Jerez et al 2015b, Tobin et al 2018 using Euro-CORDEX simulations, Müller et al 2019 using CMIP5 projections), Europe and Africa (Gaetani et al 2014 using ECHAM5 model), Greece (Panagea et al 2014 using five regional models), UK (Burnett et al 2014 using UKCP09 probabilistic climate change projections), Africa (Bazyomo et al 2016, Bichet et al 2019, Sawadogo et al 2020 using CORDEX-Africa simulations; Sawadogo et al 2021 using RegCM4 model simulations for CORDEX-CORE experiment).
Studies focusing on the Australian continent have focused more on historical time periods and highlighted the strong seasonal variability of global horizontal irradiance (GHI) and direct normal irradiance (DNI) (Prasad et al 2015, 2017). The variability of GHI and DNI over Australia is directly influenced by the changes in cloud cover due to large-scale climate drivers (like El-Niño Southern Oscillation (ENSO), monsoon, and sub-tropical ridge) and synoptic features (like cloud bands, troughs, and fronts) (Prasad et al 2015, 2017). Davy and Troccoli (2012) analysed the effects of ENSO and Indian Ocean Dipole on solar radiation over Australia (for the period 1989–2008) and highlighted the variability in radiation patterns, especially during the winter period over the continent. Huang et al (2020) have reported the temperature de-rating impacts on solar and wind farms for two sites in Australia. However, to date, an extensive study using high-resolution regional climate model (RCM) to analyse the future energy projections from PV technology has not been attempted for Australia. Similarly, future changes in cell temperature due to climate change, are yet to have been incorporated.
The main goal of this paper is to estimate the changes in PV potential over Australia due to climate change under a high emission A2 scenario. The Special Report on Emission Scenarios (Nakićenović et al 2000) describes A2 scenario as a heterogenous, self-reliant world with high population growth and regional economic development. This study aims to investigate the individual contributions of climate variables (radiation, temperature and wind speed) towards future changes in PV potential, which has not been discussed in the past. By projecting future cell temperature changes over Australia under high emission scenario and its relationship to future cell efficiency losses, insights on the associated risks of module degradation and failure are gained. The results of this analysis can help guide material selection and future technology developments for PV panels, to ensure maximum power generation under projected future climatic conditions as per high emission A2 scenario.
2. Methods
2.1. New South Wales/Australian Capital Territory Regional Climate Modelling (NARCliM) regional projections
RCM simulations from the NARCliM project have been used in this study (Evans et al 2014). The NARCliM projections consist of two spatial domains at ∼50 km (0.44° × 0.44°, covering CORDEX-Australasia region) and ∼10 km (0.088° × 0.088°) spatial resolution (covering south-east Australia) for three different time periods: historical (1990–2009), near future (2020–2039) and far future (2060–2079). Here we use the naming convention established in the NARCliM project for the time periods but note that we have already entered the near future period. The future periods are forced using the A2 scenario following the Special Report on Emission Scenarios (Nakićenović et al 2000). The A2 scenario projects a surface warming of 3.4 °C by 2100 (IPCC 2007). The RCM ensembles have been created by downscaling the four global climate models (GCMs) (MIROC3.2, ECHAM5, CCCMA3.1, and CSIRO-Mk3.0) using the weather research and forecasting model version 3.3. These GCMs were chosen from CMIP3 according to their performance over the Australian domain, their ability to span potential future climate over South-East Australia and the independence of their errors (their errors are uncorrelated) (Evans et al 2014). Three different RCM versions were created by combining different planetary boundary layer, cumulus clouds and atmospheric radiation schemes (supplementary table S1 available online at stacks.iop.org/ERL/16/114034/mmedia). The RCM configurations were selected from 36-member multi-physics ensemble based on their skill and independence of errors in a two-step selection process (Evans et al 2012, 2014). Thus, each period consists of 12 ensemble members: 4 GCMs × 3 RCMs.
The NARCliM ensemble has been evaluated for the historical period and found to produce good results for various surface variables like maximum temperature, minimum temperature and precipitation (Ji et al 2016). Several studies have also reported the capability of NARCliM to effectively capture temperature inversions (Ji et al 2018) and vertical temperature profile (Ji et al 2020). The NARCliM has also been extensively evaluated and found to reproduce many aspects of the regions climate including: the mean climatology (Olson et al 2016); wind speed (Evans et al 2018); precipitation extremes (Evans et al 2017); heatwaves (Gross et al 2017); drought (Herold et al 2018); teleconnections with large-scale climate modes (Fita et al 2016); extra-tropical low pressure systems (Di Luca et al 2016) and fire weather (Clarke and Evans 2019, Di Virgilio et al 2019). Evans et al (2018) have also used NARCliM projections to predict the future viability of wind energy and the levelized cost of electricity generation in the future from wind energy in Australia.
In this study, an additional evaluation exercise for the downward shortwave solar radiation has been included (details can be found in supplementary section 2). Comparisons with in-situ irradiance data for 14 locations across Australia show strong correlations with the NARCliM ensemble mean with slight positive bias (figure S1). Further, it is noted that the NARCliM captures the magnitude and spatial pattern of mean solar radiation with reasonable fidelity in comparison with the two reanalysis products: Modern-Era Retrospective analysis for Research and Applications Version-2 (MERRA2) and European Centre for Medium-Range Weather Forecasts Re-analysis (ERA5). The simulated radiation has a positive bias of less than 10 W m−2 (25 W m−2) over most of Australia when compared to MERRA2 (ERA5) (figure S3). This validation exercise and the previous evaluation of NARCliM surface variables in the above-mentioned studies add confidence in using NARCliM projections to assess the future solar PV potential over Australia. All the analysis in this study has been done using the NARCliM three-hourly temperature, downward shortwave solar radiation and wind speed data.
2.2. Estimation of PV potential
The power generated by a PV plant directly depends on the nominal installed capacity and the PV power generation potential of the location. PV potential characterizes the amount of solar energy retrieved at a location by a typical utility-scale PV system under ambient conditions. It is a dimensionless quantity that accounts explicitly for the performance of the PV cells to their nominal power capacity. Therefore, the instantaneous PV power of a site is the product of its PV potential and the nominal installed capacity. PV potential has been calculated using the general expression (Jerez et al 2015a) in equation (1):

where G and GSTC are the downward shortwave solar radiation (W m−2) currently and under standard test conditions (1000 W m−2), respectively. PR is the performance ratio of the PV cell accounting for all the losses due to increase in cell temperature. Estimation of the PV potential does not consider the tilt of the array. Note, spectrum effects on the PV power output is small (Huld and Gracia Amillo 2015) and has not been considered. The performance ratio of the PV cell is estimated (Mavromatakis et al 2010, Davy and Troccoli 2012) using equation (2):

where γ is the power thermal coefficient and is taken as −0.005 (Jerez et al 2015a). Tcell and Tref denote cell temperature and reference temperature, respectively. The reference temperature is taken to be 25 °C and Tcell is modelled according to Chenni et al (2007):

where T is the air temperature around the cells (°C), G is the downward solar radiation (W m−2), V is the wind speed (m s−1) and C1, C2, C3 and C4 are coefficients of cell temperature that depend on the cell properties and reflect the heat transfer properties of the cell. Representing a generalized cell, the values of C1, C2, C3 and C4 are taken as 4.3 °C, 0.943, 0.028 °C m2W−1 and −1.528 °Cs m−1 (Jerez et al 2015a). At standard temperature and irradiance, the power production reaches the rated value.
2.3. Contribution of climate variables to PV potential change
The PV potential has been expressed in terms of radiation, temperature and wind speed to obtain the contribution of each variable to the projected changes in PV potential. Combining equations (2) and (3) with equation (1), the expression for PV potential can be rewritten as:

 (W m−2)−1,
 (W m−2)−2,
  (W°C m−2)−1 and
  (W (m s)−1)−1. The total change in PV potential due to each variable (obtained using Taylor expansion of equation (4) can be expressed as:
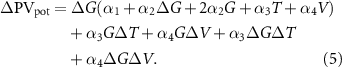
ΔT, ΔG and ΔV are the changes in temperature, radiation and wind between the historical and the future period. Hence, PV potential change due to temperature alone can be estimated by using  in equation (5). Analogously, the change in PV potential due to the influence of changes in radiation or wind alone is obtained by considering
  and
and  respectively in equation (5) (refer supplementary section 3 for derivation). This method has been previously adopted by (Jerez et al
2015b, Sawadogo et al
2020).
respectively in equation (5) (refer supplementary section 3 for derivation). This method has been previously adopted by (Jerez et al
2015b, Sawadogo et al
2020).
2.4. Cell efficiency estimation
The efficiency of a PV cell directly depends on the cell temperature, which in turn is directly dependent on the atmospheric conditions of a location. Increases in cell temperature beyond the reference temperature can result in efficiency losses. The efficiency of a PV cell, taking into account the cell temperature, can be obtained using the following equation (Mavromatakis et al 2010, Makrides et al 2012):

where Tcell and Tref are the cell temperature and reference temperature respectively. ηt is the rated power conversion efficiency of the solar cell at reference temperature. β is the temperature coefficient of the cells (−0.45% °C−1 for multi-crystalline silicon cells) (Kaldellis et al 2014). The quantity (Tcell − Tref) increases with cell temperature and consequently decreases efficiency.
2.5. Significance test
The statistical significance of the results is examined with Student's t-test and presented following the convention of Tebaldi et al (2011). For each grid point, the mean change in each ensemble member is individually tested for significance using a Student's t-test at 5% significance level (p < 0.05) assuming equal variances for the past and future periods. The results from the significance test are represented in three categories areas with significant agreement, areas with insignificant agreement, and areas with significant disagreement (Tebaldi et al 2011). Grid points, where at least 50% of the ensemble members show a significant change and at least 75% of the significant members agree on the direction of change, are denoted by colour and stippling. These areas represent significant agreement. These are areas with high confidence in the future change. Grid points where less than 50% of the ensemble members show a significant change, are shown in colour. These areas represent insignificant agreement, and these are the areas where little change is likely. Grid points where at least 50% of the ensemble members show significant change with less than 75% of them agreeing on the direction of change is denoted in white. These are areas with low confidence in the future change and represent significant disagreement.
3. Results and discussions
3.1. Future projections of PV power output over Australia
To assess the climate change impacts on PV productivity over Australia, future changes in the PV potential between the historical period (1990–2009) and future periods, near future (2020–2039) and far future (2060–2079), have been estimated (figures 1(b) and (c), table 1). Western and Northern Australia have the maximum potential for PV production in the historical period (figure 1(a)). The overall PV potential over Australia declines in the future with respect to the historical period. During the near future period, the decline in potential over Southern Australia is almost negligible (∼0.25%) while the Northern regions show almost a uniform decline (1%–1.25%). However, during the far future period the PV potential declines further with a maximum decrease in the South-East of the continent (∼2%).

Figure 1. Historical and projected changes in the solar PV potential over Australia. Panel (a) represents the mean PV potential calculated for the historical period (1990–2009). Panels (b) and (c) represent the relative percentage change in the PV potential over Australia obtained for the near future period (2020–2039) and the far future period (2060–2079) with respect to the historical period (1990–2009) respectively. Stippling indicates a significant change (according to section 2.4).
Download figure:
Standard image High-resolution imageTable 1. Projected changes in radiation, temperature, wind speed, PV potential, cell temperature and number of days cell temperature exceeds the threshold for minimum 15% efficiency loss averaged over Australia for the near future (2020–2039) and far future period (2060–2079) obtained with respect to the historical period (1990–2009).
| Parameter | Near future change | Far future change |
|---|---|---|
| Radiation (W m−2) | −0.50 | −1.21 |
| Temperature (°C) | 0.71 | 1.89 |
| Wind speed (m s−1) | −0.01 | 0.12 |
| PV potential (%) | −0.46 | −1.19 |
| Daily maximum cell temperature (°C) | 0.68 | 1.81 |
| Number of days cell temperature exceeds threshold (d yr−1) | 1.25 | 3.83 |
Crook et al (2011) also suggested that Australia may experience very slight changes in the power produced by 2080 upon estimating the global relative PV power. They computed a decline in power over most of the continent; however the East and the South coast had an increase in power output (∼2%) (figure 1(e) in Crook et al 2011), in contrast to our results. Crook et al (2011) used only one GCM, HadGEM1 from CMIP3 under a balanced emission scenario of SRES A1B for their study, which is the likely reason for such a contradiction. The SRES A1B scenario is a more optimistic scenario that projects warming of the planet by 2.8 °C by 2100 (IPCC 2007) unlike to the A2 scenario that projects 3.4 °C warming by 2100. Similar disagreement is also evident from the results of Wild et al (2015), where a negligible increase in PV power over Australia (0.05%–0.1%) is predicted by the end of 2049 using 39 CMIP5 models. Such differences are expected due to the coarser resolution GCMs used in their study. RCMs introduce an added value to the simulations compared to the GCMs due to the inclusion of higher resolution spatial details and better representation of small-scale processes in parametrization schemes (Bartók et al 2017). The specific physical parameterization schemes selected for the NARCliM configuration can also be considered as one of the causes for the difference in results.
3.2. Dependency of PV potential on climatological variables and sensitivity to climate change
PV power output is directly driven by meteorological conditions, and its drivers are likely to change in the future. The changes in PV potential are influenced by changes in downward shortwave radiation, temperature and wind speed. Estimation of the individual strength of the impacts of these parameters on PV power is required to fully understand predictions for future scenarios. Projected changes in radiation show a decline over Northern Australia and a negligible increase over Southern Australia during the near future (figure 2(a)). A further decline in radiation during the far future is expected over most of the continent except the coastal regions of Northern and Southern Australia. Since the PV power can be generated only during the daytime, the changes in temperature and wind speed are estimated for the daytime only (6 am–6 pm). Overall, daytime temperature is expected to increase throughout the continent for both periods (∼1 °C in the near future and ∼2.7 °C in far future) while only small changes (0–0.3 m s−1) in wind speed are expected for the future periods. Strong positive changes (0.2–0.5 m s−1) in the wind speed are expected near the coastal regions of Northern Australia in the far future. Winds produce a cooling effect on the panel by reducing the cell temperature and thus enhancing the power output (Kaldellis et al 2014).

Figure 2. Future changes in the climate variables that influences the PV potential of a location. Panels (a) and (d) represent the changes in the shortwave downward radiation over Australia for the near future period (2020–2039) and the far future period (2060–2079) respectively with respect to the historical period (1990–2009). Panels (b) and (e) represent the changes in the daytime temperature over Australia for the near future period (2020–2039) and the far future period (2060–2079) respectively with respect to the historical period (1990–2009). Panels (c) and (f) represent the changes in the daytime wind speed over Australia for the near future period (2020–2039) and the far future period (2060–2079) period respectively with respect to the historical period (1990–2009). Stippling indicates a significant change (according to section 2.4).
Download figure:
Standard image High-resolution imageFigure 3 shows the net contribution of radiation, temperature and wind towards the future changes in PV potential, respectively. The changes in PV potential due to each of the variables is obtained by considering the change in future values of that variable with other variables set at historical values (see section 2.3). The ratio of the future PV potential change due to an individual variable to the net change in the future PV potential estimates the contribution of that variable to future PV potential change. Positive contribution by a variable implies an increase in the future PV output due to changes in that variable. Similarly, a negative contribution implies a reduction in the future PV output due to that variable. This analysis reveals that the drivers of future changes in PV potential over Australia, in order of significance, are the changes in temperature, followed by radiation, and wind, respectively.

Figure 3. Contribution of meteorological variables to future PV potential change over Australia. Panels (a) and (d) represent the contribution by shortwave downward radiation for the near future period (2020–2039) and the far future period (2060–2079) respectively. Panels (b) and (e) represent the contribution by daytime temperature for the near future period (2020–2039) and the far future period (2060–2079) respectively. Panels (c) and (f) represent the contribution by daytime wind speed for the near future period (2020–2039) and the far future period (2060–2079) respectively. Stippling indicates a significant change (according to section 2.4).
Download figure:
Standard image High-resolution imageThe negative contributions of temperature (figures 3(b) and (e)) towards the future PV potential change indicates that increases in temperature over Australia contributes towards the decline in PV potential (figures s5(b) and (e)). This highlights the sensitivity of PV cells to temperature consistent with the previous studies (Radziemska 2003, Dubey et al 2013). The change in PV potential due to radiation is negative near Northern Australia, negligible near central Australia and positive near Southern Australia (figure s5(a)) for the near future period. During the far future period, these changes due to radiation are negative throughout the continent except along the Northern and Southern coast where we see positive changes. The total PV potential change during the future periods exhibits small positive values mostly due to the positive contributions by radiation. Small positive contributions of wind speed to future PV potential change can be noted as opposed to large contributions of radiation and temperature. This is due to the small changes in future wind speed (figures 2(c) and (f)). The presence of cross-products in the last two terms of ΔPVpot expression (equation (5) makes it difficult to isolate the contributions by the individual variables and adds a negligible residual contribution.
3.3. Changes in the cell temperature and efficiency loss in future
The dependency of heat transfer processes in solar cells on the atmospheric conditions means cell temperature is susceptible to the changes in climatic conditions. The performance of the PV modules decreases at high cell temperature due to cell efficiency losses. Thus, periods of high cell temperature can lead to significant decreases in the power generated (Dubey et al 2013). The mean daily maximum cell temperature over Australia varies from 35 °C to 55 °C (figure 4(a)) for the historical period. Northern Australia records the highest mean daily maximum cell temperature (∼55 °C). During the historical period, the highest recorded cell temperature varies from 55 °C to 72 °C (figure 4(d)). The highest cell temperature for the historical period is found in Northern Australia (72 °C) with relatively lower values along the Southern coastal regions (55 °C–60 °C). Figures 4(b) and (c) depicts the projected changes in mean daily maximum cell temperature over Australia for the near future and far future period. Even though the mean daily maximum cell temperature is highest over Northern Australia (∼55 °C), it is worth noting that the maximum rise in cell temperature is expected along the Eastern coast and Western Australia for both near future (∼1 °C) and far future (∼2.5 °C) periods. A similar increase in the mean cell temperature is also observed (figure S6). The results also indicate that the highest predicted cell temperature increases during the future period (figures 4(e) and (f)). The maximum cell temperature for the near future period records ∼1 °C rise uniformly except for parts of central Australia where an increase of 3 °C–4 °C can be noted (figure 4(e)). The increase in the highest cell temperature for the far future is higher (∼6 °C–7 °C) and fairly uniform throughout the continent unlike the near future period. It is worth noting that prolonged exposure to high cell temperatures can cause module degradation and enhance failure rates (Ndiaye et al 2013, Omazic et al 2019). Such considerations are beyond the scope of this study.

Figure 4. Historical and projected changes in the cell temperature and number of days beyond 15% relative cell efficiency losses over Australia. Panel (a) represents the mean daily maximum cell temperature over Australia for the historical period (1990–2009). Panels (b) and (c) represent the relative change in the mean daily maximum cell temperature for the near future period (2020–2039) and the far future period (2060–2079) obtained with respect to the historical period (1990–2009). Panel (d) represents the maximum cell temperature for the historical period (1990–2009). Panels (e) and (f) represent the relative change in the maximum cell temperature for the near future period (2020–2039) and the far future period (2060–2079) obtained with respect to the historical period (1990–2009). Panel (g) represents the climatological total number of days/year cell temperature exceeds the threshold temperature for minimum 15% reduction in relative cell efficiency for the historical period (1990–2009). Panels (h) and (i) represents the relative change in number of days/year the cell temperature exceeds the threshold temperature for minimum 15% reduction in relative cell efficiency for the near future period (2020–2039) and the far future period (2060–2079) obtained with respect to the historical period. Stippling indicates a significant change (according to section 2.4).
Download figure:
Standard image High-resolution image
During the historical period with relatively high cell temperatures, the minimum annual cell efficiency over Australia is found to be 82%–83% of the rated power conversion efficiency indicating a loss of 17%–18% due to de-rating. De-rating is the reduction in power output of the PV cells from their rated power. It is important to note that this loss is expected to increase further in the future due to consistent increases in the cell temperature with a maximum annual loss of 19% and 21% in the near future and far future periods, respectively (figure S7). A similar increase in daily maximum relative cell efficiency loss is expected in the future (∼0.5% and ∼1.2% in near and far future respectively). Considering the possibility of future decline in relative cell efficiency due to elevated cell temperatures, it is useful to analyse the duration of expected loss per year and its future changes.
Beyond a threshold of 58.33 °C cell temperature (supplementary section 4), a significant reduction in cell efficiency of at least 15% occurs. We therefore calculate the number of days/year when there will be expected loss in efficiency on reaching beyond the threshold cell temperature (figures 4(g)–(i), table 1). During the historical period, at least a 15% reduction in relative cell efficiency can be observed for 12–16 d yr−1 in Northern and Central Australia. Results indicate that the maximum number of days/year above the threshold temperature increases for both near future (∼2–4 d yr−1) and far future (∼6–13 d yr−1) period. This indicates that the frequency of significant module efficiency de-rating will increase in the future leading to a reduction in energy production. A similar increase in the duration of 16%–19% efficiency losses for both the future periods (figure S8) suggests an increased power loss by the end of the century across the country due to cell temperature rise. Increase in cell temperatures can lead to direct current to alternating current inverter de-rating and PV module de-rating (Huang et al 2020). De-rating is one of the most significant impacts of temperature on power generation. It can negatively affect the supply-demand ratio causing power shortages, material damage along with a huge monetary loss to the industry (Ke et al 2016).
4. Conclusion
This paper presents the expected changes in the future PV power potential over Australia under a high emission scenario using dynamically downscaled regional climate data from the NARCliM project. The PV potential is projected to decline during the 21st century over Australia for near future (2020–2039) and far future (2060–2079) period. The maximum decline in PV power generation is expected to occur in Northern Australia during the near future period and South-East Australia during the far future period. The relative contributions of projected changes in temperature, downward solar radiation and wind speed on the future PV potential was analysed. Results reveal that future changes in PV potential are determined primarily by the increase in temperature over Australia, with the next most significant effect being the projected decline in radiation. Elevated air temperatures due to global warming will induce higher cell temperatures over Australia, which leads to a decrease in relative cell efficiency and productivity. This study reveals that expected number of days/year recording minimum 15% relative cell efficiency loss increases in the future for the multi-crystalline silicon cells. This indicates an increase in the number of days/year when PV power generated will be significantly less than the rated generation capacity. PV systems are foreseen to largely expand over the 21st century in Australia, together with other technological developments. Future changes in PV power generation capacity should be considered when selecting locations and technology for transition to a low-carbon economy. These results can thus help in the assessment of resources and site allocation before deployment of large-scale projects in Australia. Latest technological developments in PV industry have introduced solar cells with relatively lower temperature coefficients that will consequently perform better under similar warming scenario. It is highly recommended to incorporate a detailed inter-comparison of various PV technologies in future for the areas expecting a high temperature rise due to global warming. This will be highly beneficial for appropriate PV material selection to ensure maximum power generation.
Acknowledgments
The NARCliM regional climate projection data that support the findings of this study are available from the New South Wales government Climate Data Portal https://climatedata.environment.nsw.gov.au/. Analysis was conducted on the National Computational Infrastructure (NCI) facility based in Canberra, Australia. This research includes computations using the computational cluster Katana at UNSW, Sydney.
Data availability statement
The data that support the findings of this study are openly available at the following URL/DOI: https://climatedata.environment.nsw.gov.au/).