

Abstract
Based on the daily reanalysis, the present study examines the interannual influences of the European blocking (EB) and Greenland blocking (GB) frequencies on the winter North Atlantic storm track (WNAST) intensity. There are contrasting relationships between the two types of atmospheric blockings and the WNAST. The EB and GB frequencies are significantly positively and negatively related to the WNAST intensity, respectively. Composite analysis shows a meridional dipole of the WNAST anomalies associated with both frequent EB and GB. The area of EB-related positive WNAST anomalies is obviously larger than that of the negative anomalies, which directly results in their in-phase relationship. However, the amplitudes of the GB-related negative WNAST anomalies that are larger than those of the positive anomalies directly lead to their out-of-phase relationship. The EB-related intensified WNAST is dependent on the enhanced baroclinic energy conversion and the strengthened atmospheric baroclinicity induced by the anomalous westerly winds on the northern side of the EB-related anticyclone. In contrast, the GB-related weakened WNAST is determined by the attenuated atmospheric baroclinicity and baroclinic energy conversion on the southern flank of the WNAST climatology.
Export citation and abstract BibTeX RIS

Original content from this work may be used under the terms of the Creative Commons Attribution 4.0 license. Any further distribution of this work must maintain attribution to the author(s) and the title of the work, journal citation and DOI.
1. Introduction
Disastrous weather and climate events such as blizzards, heat waves (Simmonds 2018, Li et al 2020), drought, and floods bring about humans facing increasingly serious environmental crises. Atmospheric blocking and storm track are intimately bound to disastrous weather and climate events (e.g. Zhou et al 2009, Dong et al 2013, Park et al 2015, Yao et al 2016, Jian et al 2020). As an important system of anomalous atmospheric circulation in middle and high latitudes, atmospheric blocking has the characteristics of a large spatial extent and quasi-static nature, which remain for a long time in the occurrence area (Rex 1950) and then directly or indirectly affect the weather and short-term climate in the occurrence area and upstream and downstream areas (Zhou et al 2009, Wang et al 2010, Li et al 2020). The cyclones and anticyclones in the synoptic chart directly affect local daily weather (Hawcroft et al 2012). The most concentrated region of cyclone and anticyclone activities is called the storm track, which also refers to the area with the strongest synoptic-scale disturbance (Blackmon 1976, Blackmon et al 1977, Wallace et al 1988). The storm track maintains climate and impacts extratropical weather by transporting large amounts of heat and moisture poleward and transporting momentum from the hemispheric low and high latitudes to the midlatitudes to maintain the westerlies against surface friction (Chang et al 2002, Schneider 2006, Simmonds et al 2012, Shaw et al 2016).
In the Northern Hemisphere winter, atmospheric blockings are mainly observed over Europe, Greenland, the North Pacific Ocean, and the Ural Mountains (Rex 1950, Barriopedro et al 2006, Cheung et al 2013, Davini and D'Andrea 2020). There are three storm tracks in the Northern Hemisphere, which are located over the North Atlantic Ocean, the North Pacific Ocean, and Siberia (Blackmon et al 1977, Hoskins and Hodges 2002, 2019). In terms of time, frequent atmospheric blocking occurs when synoptic-scale disturbances are active. In terms of space, synoptic-scale disturbances originate from the strong baroclinic region around the upper-level jet stream and move towards the weak baroclinic region, and atmospheric blockings frequently emerge near storm tracks. For example, the European blocking (EB) and Greenland blocking (GB) near the North Atlantic coincide with the North Atlantic storm track (NAST); the North Pacific blocking and the Ural blocking coincide with the North Pacific storm track and the Siberian storm track, respectively. Thus, storm tracks are spatiotemporally associated with atmospheric blockings.
Based on the quasigeostrophic geopotential tendency budget, previous studies have shown that the eddy forcing induced by synoptic-scale disturbances is conducive to maintaining atmospheric blocking (e.g. Holopainen and Fortelius 1987, Mullen 1987, Hwang et al 2020). On the other hand, storm track anomalies tend to be accompanied by anomalous changes in planetary-scale atmospheric circulation, which can result from atmospheric blocking (Nakamura and Wallace 1990, Luo et al 2001). Therefore, synoptic-scale disturbance and atmospheric blocking can be considered as symbiotic systems (Cai and Mak 1990). Notably, Luo (2000) and Luo et al (2001, 2019a) established a theoretical model of the interaction between synoptic-scale disturbance and atmospheric blocking, which can reasonably describe the important role of high-frequency transient eddy forcing in the life cycle of atmospheric blocking and explain the feedback of blocking circulation on the high-frequency transient eddy.
Regarding the influences of atmospheric blocking on storm track activity, almost all previous studies have focused on synoptic behavior by individual composites. For example, Nakamura and Wallace (1990) reported the synoptic characteristics of storm track activities during the different stages of atmospheric blocking. Furthermore, Nakamura and Wallace (1993) investigated the synoptic behavior of storm track activity during the onset of five different types of atmospheric blocking patterns. They found that the behavior of synoptic-scale eddies in the course of their interactions with amplifying blocking ridges varies slightly from one blocking pattern to another. However, there are few studies on the interannual behavior of storm track activity related to atmospheric blocking.
Europe is the birthplace of industrialization and one of the centers of contemporary economic globalization. The EB and GB are geographically close to the NAST. A better understanding of the impacts of the EB and GB on the NAST could potentially improve the prediction of disastrous weather and climate events in Europe and contribute to stable economic development. The present study focuses on the interannual impacts of the EB and GB frequencies on the NAST intensity during boreal wintertime. This paper is organized as follows: section 2 presents brief descriptions of the data and methods; section 3 shows the relationships between the winter NAST (WNAST) and the two types of atmospheric blocking, interannual influences of the EB and GB on the WNAST, and possible dynamic processes; and finally, conclusions are given in section 4.
2. Data and methods
2.1. Data
The daily atmospheric data, including the geopotential height, three-dimensional wind field, and air temperature, were obtained from the National Centers for Environmental Prediction/National Center for Atmospheric Research (NCEP/NCAR) global atmospheric reanalysis datasets (Kalnay et al 1996) with a time span from 1948 to 2018 and a horizontal resolution of 2.5° × 2.5°. Note that the use of the NCEP/NCAR reanalysis instead of the superior fifth-generation European Centre for Medium-Range Weather Forecasts reanalysis (ERA5; Hersbach et al 2020) is based on considerations of its long time span and the consistent interannual variation of WNAST among the different reanalyses (Chang and Yau 2016).
2.2. Methods
2.2.1. Atmospheric blocking detection
The present study uses the two-dimensional definition (Scherrer et al 2006, Davini et al 2012a) to detect instantaneous atmospheric blocking. More specifically, at each grid point, we calculate the daily meridional gradient of geopotential height at 500 hPa by the following formulas:
where  denotes the daily geopotential height at 500 hPa,
  represents the longitude,
  represents the latitude and ranges from 30° to 75°,
  ,
,  , and
, and  . When the criteria
  ,
,  , and
, and  are satisfied simultaneously, instantaneous atmospheric blocking is identified, and this day is regarded as a blocked day. The winter (December–February) atmospheric blocking frequency is measured by the percentage of blocked days per winter. Although we do not apply to this instantaneous blocking any duration criterion as commonly used (e.g. Davini et al
2012a), it is convenient to investigate the interannual impact of the blocking on the storm track. Additionally, this approach was already used by previous studies (e.g. Prodhomme et al
2016, Davini and D'Andrea 2020).
are satisfied simultaneously, instantaneous atmospheric blocking is identified, and this day is regarded as a blocked day. The winter (December–February) atmospheric blocking frequency is measured by the percentage of blocked days per winter. Although we do not apply to this instantaneous blocking any duration criterion as commonly used (e.g. Davini et al
2012a), it is convenient to investigate the interannual impact of the blocking on the storm track. Additionally, this approach was already used by previous studies (e.g. Prodhomme et al
2016, Davini and D'Andrea 2020).
2.2.2. Storm track representation
Bandpass statistics have been confirmed to be a useful tool to measure storm track activity (Chang 2009). The vertically integrated (from 925 to 250 hPa) eddy kinetic energy is used to represent the WNAST. The synoptic-scale (2.5–6 day) component is separated by the Lanczos bandpass filter (Duchon 1979). The storm track strength index (STSI; Yang et al 2018, 2020a) is defined by setting a threshold that is the median of the WNAST amplitudes of all of the grid points within a domain of (30°–75° N, 100° W–30° E). The threshold is set each winter and applied to all the grid points. The use of median strength threshold can better represent storm track activities by dynamically capturing the main body of WNAST in each calculation. The mean of the values greater than the threshold in all the grids is defined as the STSI which can be expressed as:
where denotes the number of grid points with the WNAST amplitude larger than the threshold and  represents the amplitude of the WNAST at the grid point.
2.2.3. Liang-Kleeman information flow theory
A recent rigorous causality formalism based on the Liang-Kleeman information flow theory (Liang and Kleeman 2005, Liang 2008, 2014), which has been widely used for causality analysis in the field of earth sciences (e.g. Liang 2014, Stips et al
2016, Jiang et al
2019, Yang et al
2021a), is applied to reveal the causal relationship between the occurrence frequency of atmospheric blocking and the intensity of the WNAST. Information flow is considered a measure of causality, where the exchange of information between two events indicates not only the quantity but also the direction of causality (Liang 2016). Specifically, for two time series  and
and  , the information flow (Liang 2014) from the latter to the former can be expressed as follows:
where  denotes the sample covariance between
  and
and  ,
,  denotes the covariance between
  and the Euler forward finite difference of
  . The flow in the opposite direction,
  , can be directly written out by switching subscripts 1 and 2. The units are in nats per unit time. Note that nat is the natural unit of information, which is expressed as a natural logarithm (Weik 2001). If the calculated result is zero, then
  does not affect the change in
  ; that is,
  is not the cause of
  , and there is no causal relationship between them. However, if it is nonzero, then
  is the cause of
  . The code of Liang-Kleeman information flow can be found at www.ncoads.cn/article/show/63.aspx.
3. Results
3.1. Relationships between WNAST and two types of atmospheric blocking
Figure 1(a) shows the climatological winter atmospheric blocking occurrence frequency and storm track amplitude over the North Atlantic and Europe. Two peaks of atmospheric blocking occurrence frequency are located over Europe and Greenland, which are known as the EB and GB, respectively. Note that when a one-dimensional definition (Tibaldi and Molteni 1990) is used to detect atmospheric blocking, the EB and GB cannot be distinguished conveniently, and they are often referred to as the Atlantic-Europe blocking. The maximum frequency of EB over the North Sea achieving more than 13% of blocked days per winter is larger than that of GB. It can be clearly observed that the WNAST is geographically closely bound to atmospheric blocking, emerging west of EB and south of GB. To quantitatively examine the relationships between the WNAST and the two types of atmospheric blocking, the EB index (EBI) and GB index (GBI) are defined by the normalized domain-averaged blocking frequency over 40°–65° N, 20° W–40° E and 60°–75° N, 60°–20° W, respectively.
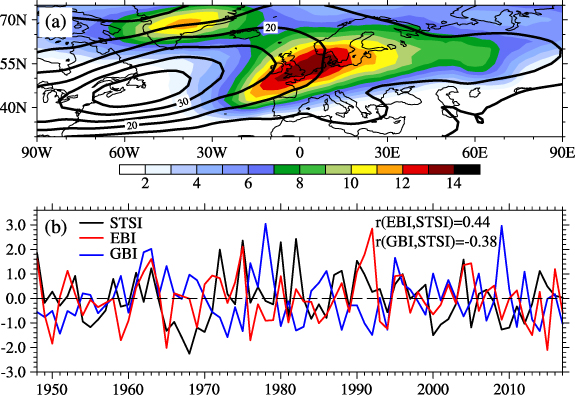
Figure 1. (a) The climatology of winter (December–February)-mean instantaneous blocking frequency (shading) and WNAST (contours; unit: m2 s−2) characterized by vertically integrated (from 925 to 250 hPa) eddy kinetic energy. (b) The time series of standardized winter-mean STSI (black), EBI (red) and GBI (blue). The numerical values shown in (b) are the correlation coefficients of the time series.
Download figure:
Standard image High-resolution imageFigure 1(b) presents the time series of winter-mean STSI, EBI and GBI. The equivalent degrees of freedom range from 65 to 70 after taking serial lag-one autocorrelation into account (Bretherton et al 1999). All three indices exhibit prominent interannual variations. There is a significant out-of-phase relationship between the STSI and the GBI, and their correlation coefficient is −0.38 with a 99% confidence level based on a two-sided Student's t test, indicating that frequent GB corresponds to weakened WNAST. In contrast, the correlation coefficient between the STSI and the EBI is 0.44, which suggests that the frequent EB is significantly associated with a strengthened WNAST. It is interesting that the two types of atmospheric blocking, EB and GB, neighboring the WNAST have opposite interannual relationships with WNAST intensity.
By applying the Liang-Kleeman information flow theory, an information flow from the EB occurrence frequency to the WNAST intensity:  (unit: nats s−1), and an information flow from the GB occurrence frequency to the WNAST intensity:
  nats s−1 suggest that the occurrence frequencies of EB and GB are the cause of the WNAST intensity. In fact, an information flow from the intensity WNAST to the occurrence frequency of atmospheric blocking is also nonzero, which implies a mutually causal relationship between them and the interaction between the high-frequency eddies and the intermediate-frequency eddies (Jiang et al
2013). However, the present study primarily focuses on the impacts of the EG and GB on the WNAST.
nats s−1 suggest that the occurrence frequencies of EB and GB are the cause of the WNAST intensity. In fact, an information flow from the intensity WNAST to the occurrence frequency of atmospheric blocking is also nonzero, which implies a mutually causal relationship between them and the interaction between the high-frequency eddies and the intermediate-frequency eddies (Jiang et al
2013). However, the present study primarily focuses on the impacts of the EG and GB on the WNAST.
3.2. Contrasting influences of the EB and GB on the WNAST
To obtain the anomalous WNAST distribution related to the two types of atmospheric blocking, composite analysis is performed by taking one standard deviation of the EBI and GBI as the criterion. Based on this method, 10 (8) winters, including 1948/49, 1952/53, 1963/64, 1975/76, 1990/91, 1991/92, 1992/93, 2004/05, 2005/06, and 2016/17 (1950/51, 1959/60, 1965/66, 1969/70, 1985/86, 1994/95, 2013/14, and 2015/16), with a high (low) occurrence frequency of EB, and 9 (9) winters, including 1962/63, 1976/77, 1978/79, 1986/87, 1995/96, 2000/01, 2006/07, 2009/10, and 2012/13 (1951/52, 1973/74, 1980/81, 1982/83, 1983/84, 1988/89, 2011/12, 2014/15, and 2017/18), with a high (low) occurrence frequency of GB, were selected. Note that a few winters, such as 1962/63 and 2012/2013, that should have been chosen by both EB and GB for the composite, are reserved by only one of them. Figure 2 shows the composite WNAST anomalies associated with the two types of atmospheric blocking. There is a meridional dipole distribution of the EB-related WNAST anomalies, with significantly positive anomalies occurring on the northeastern flank of the climatological WNAST and prominently negative anomalies appearing over the Iberian Peninsula and the Mediterranean (figure 2(a)). Although the magnitudes of the two anomalous peak amplitudes within the meridional dipole distribution are generally comparable, the area of positive anomalies is obviously larger than that of negative anomalies, which may directly result in the in-phase relationship between the EB occurrence frequency and the WNAST intensity. In addition, such a meridional dipole distribution is conducive to the northward displacement of the eastern WNAST.

Figure 2. Composite differences in WNAST (shading) marked by the vertically integrated (from 925 to 250 hPa) eddy kinetic energy ((a), (b); unit: m2 s−2), the 850 hPa meridional transport of eddy heat flux ((c), (d); unit: K m s−1) and the standard deviation of the 500 hPa filtered geopotential height ((e), (f); unit: m) between strong and weak EBI ((a), (c), (e)) and GBI ((b), (d), (f)) winters. The contours denote the composite WNAST during strong EBI ((a), (c), (e)) and GBI ((b), (d), (f)) winters with intervals of 5 m2 s−2 ((a), (b)), 2.5 K m s−1 ((c), (d)), and 5 m ((e), (f)). The stippled areas denote the 99% confidence level by Student's t test.
Download figure:
Standard image High-resolution imageFrom figure 2(b), we can see that the influence of the GB on the WNAST is basically opposite to that of the EB. The significantly negative WNAST anomalies associated with the frequent GB arise on the northeastern flank of the WNAST climatology, while noticeably positive anomalies emerge west of the Strait of Gibraltar. The out-of-phase relationship between the GBI and STSI may be attributed to the amplitude of the negative WNAST anomalies being larger than that of positive anomalies. The distribution of the GB-related WNAST anomalies favors the southward migration of the eastern WNAST, which is contrary to the impact of the EB. Thus, the downstream structure of the composite WNAST during high occurrence frequencies of EB (figure 2(a)) and GB (figure 2(b)) winters shows a poleward deflection and zonal horizontal, respectively, relative to the climatology (figure 1(a)).
In addition, another two commonly used Eulerian storm track diagnostics are used to further identify the contrasting influences of the EB and GB on the WNAST. For the lower-tropospheric meridional eddy heat flux, the EB-related anomalous distribution is dominated by significantly positive anomalies (figure 2(c)); however, there are prominently negative anomalies associated with the frequent GB occurring on the north side of its climatology (figure 2(d)). For the standard deviation of the filtered geopotential height at 500 hPa, the anomalous distributions related to the frequent EB (figure 2(e)) and GB (figure 2(f)) are essentially consistent with those of eddy kinetic energy. Therefore, the contrasting impacts of the EB and GB on the WNAST are strong enough to consider this as a robust and important result.
3.3. Role of the North Atlantic Oscillation
In boreal wintertime, the North Atlantic Oscillation (NAO) is the dominant mode of variability in the North Atlantic-European area and is strongly related to variations of the WNAST (e.g. Hurrell et al 2003, Cattiaux et al 2010, Luo et al 2011). The NAO is also closely linked with the GB (e.g. Woollings et al 2008, Davini et al 2012b, Yao and Luo 2014). It is natural that one may wonder whether interannual impacts of the EB and GB on the WNAST is just the signature of the NAO. To address this issue, we investigate relationships between the NAO and EB, GB, and WNAST. The monthly NAO index (NAOI) spanning from 1950 to 2018 is obtained from the National Oceanic and Atmospheric Administration/Climate Prediction Center. The correlation coefficients between the winter NAOI and the EBI, GBI, and STSI are 0.10, −0.85 and 0.44, respectively, which indicates that the NAOI and the EBI are largely uncorrelated and the interannual influence of the EB on the WNAST is independent of the NAO. The NAOI is strongly negatively related to the GBI and has a significantly positive correlation relationship with the STSI.
To further examine the role of the NAO in the impact of the GB on the WNAST, we also perform composite analysis by taking one standard deviation of the NAOI as the criterion; 10 (10) winters, including 1962/63, 1963/64, 1968/69, 1976/77, 1977/78, 1978/79, 1984/85, 1995/96, 2009/10, and 2010/11 (1951/52, 1956/57, 1982/83, 1983/84, 1988/89, 1993/94, 1994/95, 1999/2000, 2011/12, and 2014/15), with a weak (strong) NAOI, are selected. Note that the operation of composite difference between strong and weak winters are opposite in the GBI and NAOI due to their significant out-of-phase relationship. Figure 3(a) shows the composite difference in the WNAST between weak and strong NAOI winters. We can see that that the spatial pattern of anomalous WNAST related to the NAO also exhibits a meridional dipole with significantly positive WNAST anomalies occurring in the southern part, which is consistent with the anomalous WNAST associated with the GB (figure 2(b)). It suggests that the GB-related WNAST anomalies are largely associated with the NAO.

Figure 3. Composite differences in the WNAST between (a) weak and strong NAOI winters and (b) strong (1986/87, 2000/01, 2006/07, and 2012/13) and weak (1973/74, 1980/81, and 2017/18) GBI winters. The contours denote the composite WNAST during (a) weak NAOI and (b) strong (1986/87, 2000/01, 2006/07, and 2012/13) GBI winters with intervals of 5 m2 s−2. The stippled areas denote the (a) 99% and (b) 95% confidence level by Student's t test.
Download figure:
Standard image High-resolution imageTo demonstrate that the interannual impact of the GB alone on the WNAST is also significant, composite difference between strong and weak GBI winters is performed by excluding weak and strong NAOI winters, respectively. In this way, there are 4 (3) winters, including 1986/87, 2000/01, 2006/07, and 2012/13 (1973/74, 1980/81, and 2017/18), with a strong (weak) GBI, are selected. Figure 3(b) shows the composite difference in the WNAST between strong (1986/87, 2000/01, 2006/07, and 2012/13) and weak (1973/74, 1980/81, and 2017/18) GBI winters. We can see that the anomalous WNAST related to the GB alone is basically consistent with the result shown in figure 2(b), which indicates that the influence of the GB alone on the WNAST is significant.
3.4. Possible dynamic processes
Before exploring the possible underlying physical mechanisms behind the contrasting impacts of the EB and GB on the WNAST, it is important to investigate the anomalous atmospheric circulation associated with the frequent EB and GB. Figure 4 shows the composite geopotential height and wind field anomalies. In the middle troposphere, there are prominently EB-related positive geopotential height anomalies over western Europe (figure 4(a)), corresponding to a remarkably anomalous anticyclone. However, negative geopotential height anomalies in the lower latitudes have obviously weaker amplitudes. In the lower troposphere, anomalous westerly and easterly winds emerge in the northern and southern flanks of EB-related anticyclonic circulation (arrows in figure 4(a)), respectively. In the upper troposphere, the spatial distributions of anomalous westerly and easterly winds (figure 4(c)) are consistent with those in the lower troposphere, but the amplitudes are evidently larger, which suggests the intensified vertical shear of zonal wind.

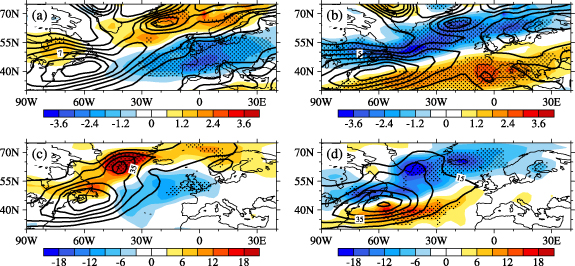
Figure 4. Composite differences in 500 hPa geopotential height ((a), (b); shading; unit: m), 850 hPa horizontal wind ((a), (b); vector; unit: m s−1) and 250 hPa zonal wind ((c), (d); shading; unit: m s−1) between strong and weak EBI ((a), (c)) and GBI ((b), (d)) winters. The contours denote the composite 250 hPa zonal wind during strong EBI (c) and GBI (d) winters with an interval of 5 m s−1. The stippled areas denote the 99% confidence level by Student's t test.
Download figure:
Standard image High-resolution imageThe atmospheric baroclinicity quantified by the maximum Eady growth rate (EGR; Lindzen and Farrell 1980) can be calculated by:

where  denotes the Coriolis parameter, denotes the Brunt-Väisälä frequency, and
  is the vertical shear of zonal wind. According to the linear theory of baroclinic instability (Charney 1947, Eady 1949, Lindzen and Farrell 1980), strengthened lower-tropospheric atmospheric baroclinicity provides a favorable condition for the potential intensification of synoptic-scale eddies (Hoskins and Valdes 1990). Figure 5(a) shows the EB-related composite anomalies of vertically integrated (from 925 to 700 hPa) lower-tropospheric EGR. We can see that the spatial distribution of anomalous EGR also displays a meridional dipole (figure 5(a)), which is broadly consistent with that of anomalous WNAST (figure 2(a)). Note that the structure of the anomalous EGR dipole strongly resembles the mean winter EGR (Simmonds and Li 2021). However, the area and amplitude of negative EGR anomalies are larger than those of positive EGR anomalies, suggesting that the EB-related WNAST anomalies cannot all be attributed to the anomalous EGR.
Figure 5. Composite differences in vertically integrated (from 925 to 700 hPa) lower-tropospheric EGR ((a), (b); shading; unit: 10−6 s−1) and vertically integrated (from 925 to 250 hPa) baroclinic energy conversion ((c), (d); shading; unit: W m−2) between strong and weak EBI ((a), (c)) and GBI ((b), (d)) winters. The contours denote the composite vertically integrated lower-tropospheric Eady growth rate ((a), (b)) and baroclinic energy conversion ((c), (d)) during strong EBI ((a), (c)) and GBI ((b), (d)) winters with intervals of 10−6 s−1 ((a), (b)) and 10 m2 s−2 d−1 ((c), (d)). The stippled areas denote the 99% confidence level by Student's t test.
Download figure:
Standard image High-resolution image
In fact, apart from atmospheric baroclinicity, storm track activities are also largely dependent on the baroclinic energy conversion from the eddy available potential energy to the eddy kinetic energy (Cai et al 2007, Jiang et al 2013, Yang et al 2020b, 2021b). The baroclinic energy conversion (BCEC) can be expressed as:

where  denotes 1000 hPa,
  is the gas constant for dry air,
  is the vertical pressure velocity and
  (
( ) is the specific heat of dry air at a constant volume (pressure). The prime and the overbar indicate the transient (2.5–6 day bandpass filtered) and climatological mean components, respectively. Figure 5(c) shows the EB-related composite anomalies of vertically integrated (from 925 to 250 hPa) baroclinic energy conversion. It is obvious that the area and amplitude of the EB-related positive baroclinic energy conversion anomalies are larger than those of the negative anomalies (figure 5(c)), which may explain the EB-related WNAST anomalies well.
With regard to the GB-related atmospheric circulation anomalies (figure 4(b)), there is a noticeably meridional dipole pattern of anomalous geopotential height over the North Atlantic, with positive geopotential height anomalies appearing north of 55° N. The lower-tropospheric easterly wind anomalies lying on the southern flank of the anomalous anticyclone coincide with the northern flank of the anomalous cyclone, while the westerly wind anomalies primarily arise on the southern side of the anomalous cyclone (arrows in figure 4(b)). The spatial pattern of the zonal wind anomalies in the upper troposphere (figure 4(d)) is essentially consistent with that in the lower troposphere. The GB-related vertical shear of zonal wind anomalies is responsible for the resultant EGR anomalies (figure 5(b)). We find that the amplitudes of the negative EGR anomalies are larger than those of the positive anomalies, which may result in the GB-related weakened WNAST. In addition, the GB-related baroclinic energy conversion anomalies also manifest as a noticeable meridional dipole (figure 5(d)). The area and amplitude of the GB-related negative baroclinic energy conversion anomalies on the northern side larger than those of the positive anomalies results in the weakened WNAST associated with the frequent GB.
4. Conclusion and discussion
In this study, we investigate the interannual impacts of the EB and GB frequencies on the WNAST intensity by using the NCEP/NCAR reanalysis spanning 1948 to 2018. The EB and GB frequencies are detected by the two-dimensional definition of atmospheric blocking. The WNAST is represented by the vertically integrated eddy kinetic energy. The main conclusions are described below.
There is a significantly positive relationship between the EB frequency and the WNAST intensity. In contrast, the GB frequency is significantly negatively related to the WNAST intensity. Based on the Liang-Kleeman information flow theory, the interannual relationships between the EB and GB frequencies and the WNAST intensity are identified to be mutually causal. The present study focuses on the influences of the EB and GB frequencies on the WNAST intensity.
Composite analysis shows that there is a meridional dipole distribution of the WNAST anomalies related to frequent EB. The area of the EB-related positive WNAST anomalies in the northern flank of the WNAST climatology is evidently larger than that of the negative anomalies, which directly results in the in-phase relationship between the EB frequency and the WNAST intensity. The spatial pattern of the GB-related WNAST anomalies also shows a meridional dipole, but positive anomalies occur on the southern side. It must be emphasized that the GB-related WNAST anomalies are largely associated with the NAO. The amplitudes of the GB-related negative WNAST anomalies that are larger than those of positive anomalies directly lead to the out-of-phase relationship between the GB frequency and the WNAST intensity.
The intensified atmospheric baroclinicity due to the anomalous westerly winds in the northern flank of EB-related anticyclonic circulation and the enhanced baroclinic energy conversion contribute to the strengthened WNAST associated with the frequent EB. In contrast, the amplitudes of GB-related weakened atmospheric baroclinicity and baroclinic energy conversion larger than those of augmented ones are responsible for the attenuated WNAST accompanied by the frequent GB.
Given the fact that local weather in midlatitudes is affected by cyclones/anticyclones, and extremes of precipitation, wind, and temperature in midlatitudes are associated with storm tracks (Shaw et al 2016), a year with the frequent EB tends to be associated with an intensified and northward shift WNAST; thus, northern Europe is prone to extreme weather events. In contrast, in years with frequent GB, the WNAST tends to be suppressed and displace southward, and extreme weather events are more likely to occur in southern Europe.
In recent years, sea ice loss and polar climate change have received growing attention (Screen et al 2018). The North Atlantic and Eurasia are adjacent to sea ice areas such as the Barents and Kara Seas. Blocking has exhibited considerable variability associated with these changes (Luo et al 2016, 2017, Screen et al 2018, Luo et al 2019b). Therefore, impacts of EB and GB on the WNAST may be modulated by the climate change in mid-high latitudes.
In addition, it should be noted that due to the different definitions, time series shown for GBI differ somewhat from that derived in Hanna et al (2016); more specifically, their GBI is defined by the domain-averaged 500 hPa geopotential height over 60°–80° N, 80°–20° W. Thus, there is a potential sensitivity of the current results to the choice of how blocks are identified (Tyrlis et al 2021, Wachowicz et al 2021).
Acknowledgments
The authors thank five anonymous reviewers for their helpful and crucial comments which improve the manuscript substantially. This research was supported by the National Natural Science Foundation of China (Grant Numbers: 41790473 and 41975068) and the Chinese Academy of Science Strategic Priority Research Program (Grant XDA 19070403). The NCEP/NCAR reanalysis dataset was obtained online (www.esrl.noaa.gov/psd/data/gridded/reanalysis/). The North Atlantic Oscillation index was obtained online (www.cpc.ncep.noaa.gov/products/precip/CWlink/pna/nao.shtml).
Data availability statement
The data that support the findings of this study are openly available at the following URL/DOI: www.esrl.noaa.gov/psd/data/gridded/reanalysis/.