

Abstract
Decarbonization is an urgent global policy priority, with increasing movement towards zero-carbon targets in the United States and elsewhere. Given the joint decarbonization strategies of electrifying fossil fuel-based energy uses and decarbonizing the electricity supply, understanding how electricity emissions might change over time is of particular value in evaluating policy sequencing strategies. For example, is the electricity system likely to decarbonize quickly enough to motivate electrification even on relatively carbon-intensive systems? Although electricity sector decarbonization has been widely studied, limited research has focused on evaluating emissions factors at the utility level, which is where the impact of electrification strategies is operationalized. Given the existing fleet of electricity generators, ownership structures, and generator lifespans, committed emissions can be modeled at the utility level. Generator lifespans are modeled using capacity-weighted mean age-on-retirement for similar units over the last two decades, a simple empirical outcome variable reflecting the length of time the unit might reasonably be expected to operate. By also evaluating generators in wholesale power markets and designing scenarios for new-build generation, first-order annual average emissions factors can be projected forward on a multidecadal time scale at the utility level. This letter presents a new model of utility-specific annual average emissions projections (greenhouse gases and air pollutants) through 2050 for the United States, using a 2019 base year to define existing asset characteristics. Enabling the creation and evaluation of scenario-based projections for dynamic environmental intensity metrics in a decarbonizing electricity sector can inform life cycle and other environmental assessment studies that evaluate impact over time, in addition to highlighting particular opportunities and risks associated with the timing and location of long-lived capital investments as the fossil fuel electricity generator fleet turns over. Model results can also be used to contextualize utilities' decarbonization commitments and timelines against their asset bases.
Export citation and abstract BibTeX RIS
1. Introduction
Decarbonizing the electricity sector is an increasingly urgent policy target in the United States, with increasing enactment and calls for zero-carbon electricity targets from city through federal levels (Trumbull et al 2019, Leon 2021, The White House 2021). As decarbonization policies begin to take shape, often leveraging both electricity sector decarbonization and increased electrification of historically fossil-based sectors (Williams et al 2021), understanding the mid-transition dynamics of electricity-related greenhouse gas (GHG) and other emissions is highly relevant for evaluating how interventions might reduce contributions to climate change (Vaishnav and Fatimah 2020). Although electrification has the potential to enable zero-GHG energy consumption, not all electricity is zero GHG, and other electricity-related emissions can contribute to large public health burdens (Penn et al 2017, Henneman et al 2019, Buonocore et al 2021). As such, understanding how the timing of electrification interacts with the timing of electricity decarbonization is highly relevant for evaluating overall environmental impact of policy interventions and the potential for burden shifting.
The spatiotemporal variability of electricity emissions factors is well known, as are the challenges of assigning generation to specific end users due to the complex physical and economic architecture of electricity systems (Weber et al 2010, Schivley et al 2018, de Chalendar et al 2019, Fell and Johnson 2021, von Wald et al 2021). Although regionalization of environmental impacts is common in evaluation methods like life cycle assessment (LCA), dynamics over time—particularly into the future—are rarely incorporated in a manner that reflects the transition from high to low GHG systems (though see (Ambrose et al 2020, Gençer et al 2020)). That is, while studies might include scenarios with future low-emissions conditions (Onat et al 2019), they do not generally account for the mid-transition where the existing system has been partially but not fully replaced. Like most equipment, power plants have lifespans that empirical data suggest are relatively stable despite having complex drivers (Davis and Socolow 2014), which enables asset-informed evaluation of potential future emissions (Grubert 2020a).
Given that most electricity sales are done via utilities, which supply power from specific generation assets (through ownership or markets), the emissions impact of a given electricity consumption activity largely depends on the utility's profile and the timing of electricity consumption. Timing is relevant at multiple scales, from hourly (Thind et al 2017, de Chalendar et al 2019) to asset lifespan. From a decarbonization perspective, understanding the potential future evolution of emissions factors for a given utility over a multidecadal time frame is particularly useful for evaluating how given interventions might affect emissions over their life cycles. Although prior work has mapped emissions to utilities (van Atten et al 2020), investigated changes in electricity emissions over time at regional (Schivley et al 2018) and utility (Alova 2020) levels, and performed LCA incorporating dynamic electricity sector emissions over time (Hertwich et al 2014), the ability to evaluate highly specific scenarios of future emissions for specific utilities, accounting for the existing generator asset base that utilities own and purchase power from, has been elusive. As such, this work aims to address a major literature gap by modeling future GHG emissions factors for US utilities that include committed emissions that would be expected if existing assets run about as long as similar assets have run in the past, over a time frame (∼30 years) that is relevant on an asset lifespan basis. The remainder of this letter describes how the utility-specific model was built, then presents results, validation, and an analytical example.
2. Methods
This research uses federally reported data on US electric utilities and generators to develop utility-specific projections of annual average GHG emissions per unit of retail electricity sales through 2050, in addition to utility-specific projections of five types of air emissions associated with owned assets. These projections are the outputs of an Excel-based model, three versions of which are available as supplementary data files 1A–1C of this letter (available online at stacks.iop.org/ERL/16/084049/mmedia). The difference among the three versions is the geographic scope of power markets from which a given utility can purchase electricity generated by power plants it does not own. Data File 1A, which is the basis of reported results in this letter unless stated otherwise, assigns each utility to its reported balancing authority for wholesale purchases. Data File 1B assigns each utility to its reported state, and Data File 1C assigns each utility to its reported North American Electric Reliability Corporation (NERC) region. These assignments are made based on reported balancing authority, state, and NERC region in Energy Information Administration (EIA) 861 (EIA 2021a). Note that some utilities operate in multiple balancing authorities, states, and NERC regions: given the structure of EIA 861, utilities in multiple balancing authorities are excluded from analysis (Data File 1A), but utilities in multiple states or NERC regions are assigned to the single reported locations, a potential source of error for retail power marketers in particular.
The modeling approach used here is adapted from the approach used in Grubert et al (2020) to project annual average GHG emissions factors for utilities in California. By also incorporating the multicriteria, generator-level modeling approach used in Grubert (2020a), this model is not only more comprehensive (covering all utilities in US states included in EIA 861) but also much higher resolution at the asset level, with generator- rather than plant-level specificity for (a) generation, (b) asset lifespan, (c) emissions (including nitrogen oxides, sulfur dioxide, and mercury in addition to carbon dioxide and, for natural gas units, upstream methane, with state-level resolution from Burns and Grubert (2021)), and (d) ownership. Unlike the California model in Grubert et al (2020), the current model does not assume policy compliance with legislated or voluntary GHG emissions targets, largely given the complexity of modeling interdependent compliance with rapidly changing policies and shared wholesale markets across states, regulatory environments, and utility internal policy. Instead, the current model includes utility-specific estimates of owned generation capacity that a zero-carbon target implemented in a given year would strand under the definition used in Grubert (2020a): requiring an asset to close earlier than would be expected absent policy, here defined as before it reaches a historically typical lifespan for its type.
2.1. Data
The model is based primarily on four US federal data products, using a 2019 base year: EIA 860 (EIA 2021c), EIA 861 (EIA 2021a), EIA 923 (EIA 2021d), and eGRID (EPA 2021). Additional data are adapted from prior work, including fuel- and prime mover-specific generator lifespans (using the 2002–2018 retirement cohort (Grubert 2020a)), emissions intensity data for generators without matches in eGRID 2019 (using a 2018 base year (Grubert 2020a)), state-specific methane intensity of natural gas supplies (using a 2015 base year for basin-level methane leakage intensity applied to 2018 US natural gas flows (Burns and Grubert 2021) and midstream leakage estimates from Alvarez et al (2018)), and nuclear license expiration dates (as of October 2020, originally compiled from the Nuclear Regulatory Commission for Zacarias and Grubert (2021)). Data sources and analytical methods are included both in this letter's Data Files and the source documents and their accompanying models. Data adjustments are described in section 2.3, 'Validation'.
2.2. Implementation
Two different types of utility-specific results are derived in the Data Files. First, for each year 2021–2050, and for each utility, committed impacts associated with the generators that each utility owns (either fully or partially, based on EIA 860 Schedule 4) are reported, assuming that all generators that were operable as of 2019 continue to produce at their 2019 levels until their modeled retirement date. This modeled retirement date is either the end of the generator's empirical fuel- and prime mover-specific lifespan if that date is 2021 or later, following Grubert (2020a), or a randomly selected year between (2022, 2030) if the unit reached that age before 2021, to avoid the step change associated with simultaneous retirement of all assets past their typical lifespans present in Grubert et al (2020). Modeled committed impacts include projected generation, emissions (of carbon dioxide, CO2; natural gas supply-associated methane, CH4; nitrogen oxides, NOx ; sulfur dioxide, SO2; and mercury, Hg), and capacity of owned assets that would be stranded if a zero-carbon electricity deadline were implemented in any year between 2021 and 2050. Stranded asset estimates are made based on typical lifespan, not modeled retirement year. On the results sheet 'Utility Multicriteria Results', users can select a utility and view projected committed emissions from owned generating assets by year as a percentage of estimated 2021 emissions (figure 1).
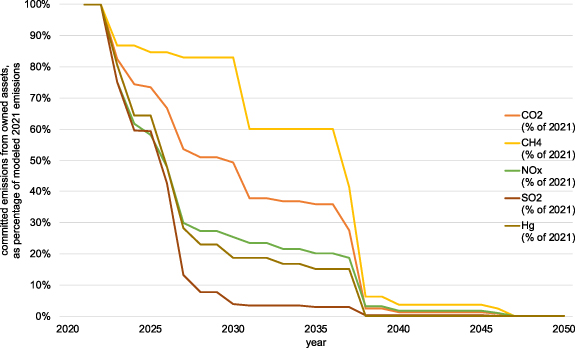
Figure 1. Example output: 2021–2050 emissions from owned generation assets operable as of 2019 as a percentage of 2021 modeled output, Georgia Power.
Download figure:
Standard image High-resolution imageSecond, for each year 2021–2050, and for each utility, annual GHG emissions associated with total retail sales are computed, with the option to display annual average GHG emissions factors per unit of retail sales. Utilities are assumed to fulfill retail sales obligations in the following sequence: (a) with electricity generated by generators that were operable as of 2019, have not yet reached their modeled retirement date in the projection year, and that the utility owns either wholly or partially (for partial ownership, outputs are allocated in direct proportion to ownership share—i.e. a utility that owns 40% of a generator is assigned 40% of that generator's outputs.); (b) with electricity generated by generators that were operable as of 2019, have not yet reached their modeled retirement date in the projection year, are not assigned to their owner's retail sales needs, and are in the utility's region (balancing authority (Data File 1A), state (Data File 1B), or NERC region (Data File 1C)), up to the utility's share of unmet need (projected retail sales less projected owned generation) across all utilities in the region; and (c) with electricity generated by generators that were not operable as of 2019, i.e. new build generation.
User inputs include the GHG intensity of new build generation, annual retail sales growth rate (default: 0.9%, the 2021–2050 annual average growth rate assumed in the 2021 Annual Energy Outlook reference case (EIA 2021b)), and Global Warming Potential (GWP) of methane (default: 36, the Fifth Assessment Report GWP-100 with climate-carbon feedback for fossil methane (Intergovernmental Panel on Climate Change 2014)). To view generator CO2 emissions only, enter '0' as the methane GWP. New build generation GHG intensity is based either on directly entered annual GHG emissions factors (2021–2050) or on an annual fuel mix comprising user-entered shares of natural gas combined cycle (NGCC) units with and without carbon capture and storage (CCS), natural gas combustion turbine units with and without CCS, and zero-carbon generation. For natural gas units, users can adjust assumptions about efficiency, capture level, and methane emissions rate. Defaults are set to Annual Energy Outlook heat rates, 90% capture rate for CCS units, and national average methane leakage rate for natural gas (production through transmission and storage). Assumptions and calculations can be viewed in the Data Files. New build generation is modeled only as an emissions factor in a given year rather than as new assets with lifespans, meaning that the new build emissions factors do not explicitly account for future asset commitments.
Several considerations not included in the current model that were included in predecessor models are noted here for clarity. In addition to this model's lack of explicit policy modeling, it differs from the California model (Grubert et al 2020) by not including nonownership contracts for generation (largely because what was reasonable to identify manually for five utilities is not reasonable to find manually for all utilities), not including plant-level GHG emissions aside from CO2, and not including relatively minor upstream methane emissions from coal extraction. Unlike the non-utility-specific generator model (Grubert 2020a), this model does not include labor or water use estimates, and emissions are modeled as either a generator-level match with eGRID or by applying Grubert (2020a) 2018-base year emissions intensities to 2019 generation at either the generator level or the 'Energy Source 1' fuel level, in that order. Note that although projected total non-GHG air emissions and emissions factors like those shown in Grubert (2020a) are not explicitly presented as results in the Data Files, all necessary information is embedded in the models, and such results can be viewed by altering lookups in a few locations. See Data Files for details, with further instructions available from the author upon request.
2.3. Validation
In the case of missing or inconsistent data, some adjustments to federal data were made, which are marked in yellow in the Data Files for clarity. The most relevant adjustments include (a) corrections to NERC regions (e.g. self-reports of 'FRCC' were altered to 'SERC' to reflect the 2019 dissolution of FRCC (Jenkins 2019) and utilities without a listed NERC region were assigned to one based on approximate location (FERC 2020)); and (b) corrections to utility ownership. Most utility ownership corrections were to reconcile differing names for the same organization between EIA 860 and EIA 861, e.g. 'National Grid Generation LLC' (860) versus 'National Grid Generation, LLC' (861). At the generator level, name reconciliation adjustments were applied to about 9 GW of capacity based on manual inspection of all units with capacity of at least 50 MW, which might have introduced errors and are thus clearly marked in the Data Files. Additional adjustments were made to reflect partial or whole ownership of other utilities identified by manual inspection of the top 100 utilities by 2019 retail sales (accounting for ∼90% of 2019 retail sales), where issues were flagged if modeled owned generation was more than 10% different from reported owned generation in 2019. Not all discrepancies were resolvable, which in some cases seems to be a result of inconsistent interpretation of owned generation (e.g. the Los Angeles Department of Water and Power appears to report its share of the Southern California Public Power Authority's generation as owned generation, while SCPPA reports it as 'purchased' (SCPPA 2021)). Note that aside from manual adjustments described here, model results do not reflect contracts or ownership shares not reflected in EIA 860 ownership data, which likely has particular relevance for municipal utilities that purchase electricity from cooperatives or other organizations (e.g. federal dam projects). See Data Files for details.
Further validation of the current model against the California-specific, plant-level model described in Grubert et al (2020) is conducted by matching user inputs (methane GWP, retail sales growth rate, and GHG intensity of new-build generation) and California-specific natural gas supply methane leakage assumptions, in addition to removing policy constraints and contracts from the California model. This validation contextualizes the three wholesale market regionalizations presented in Data Files 1A–C by comparing estimated GHG intensity of retail sales for California's largest five utilities.
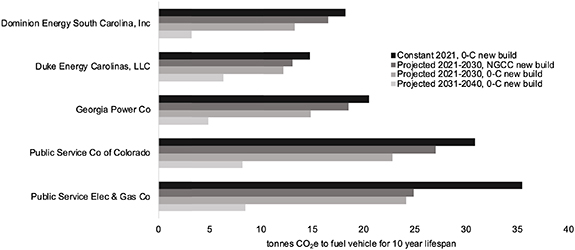
2.4. Analytical example: lifetime GHG emissions from electric vehicle charging
As an example of how utility-specific annual average GHG emissions factors can contribute to LCA and other environmental assessment studies by grounding scenarios for temporally dynamic inventory data, this research includes an illustrative example of estimated lifetime GHG emissions from electric vehicle charging. The example is based on a 2021 Nissan Leaf with a 40 kWh battery pack, with a fuel consumption rate of 30 kWh/100 miles (19 kWh/100 km) (DOE and EPA 2021). This example assumes the fueleconomy.gov default of 15 000 miles (24 000 km) driven per year, and a 10 year vehicle lifespan. Emissions are estimated for five example utilities assuming (a) static 2021 annual average emissions; (b) 2021–2030 annual average emissions assuming all new build generation is NGCC; (c) 2021–2030 annual average emissions assuming all new build generation is zero-carbon; and (d) 2031–2040 annual average emissions assuming all new build generation is zero-carbon.
3. Results
Figure 2 shows model results using the balancing authority model (Data File 1A) for five example utilities, each of which has declared a goal of reaching net-zero carbon by 2050 (St. John 2020).
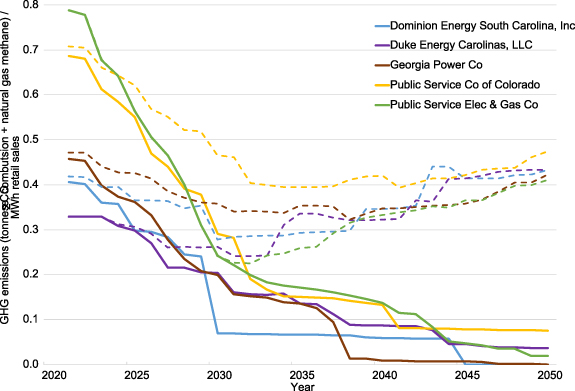
Figure 2. Projected annual average GHG emissions factors for five example utilities with net-zero carbon goals, 2021–2050. Solid lines show model projections if all new build power is zero carbon; dashed lines show model projections if all new build power is supplied by NGCC units, assuming national average methane intensity for the natural gas supply.
Download figure:
Standard image High-resolution imageAs figure 2 shows, projected emissions factors are highly sensitive to assumptions about the environmental intensity of new-build power as existing generators close. Divergence between the zero-carbon (solid lines) and NGCC (dashed lines) replacement power scenarios occurs largely in response to closure of owned assets.
Figure 3 shows power generation capacity operable as of 2019 that, based on fuel- and generator-specific lifespan estimates, would be at risk of stranding under a 2035 deadline for zero-carbon electricity.
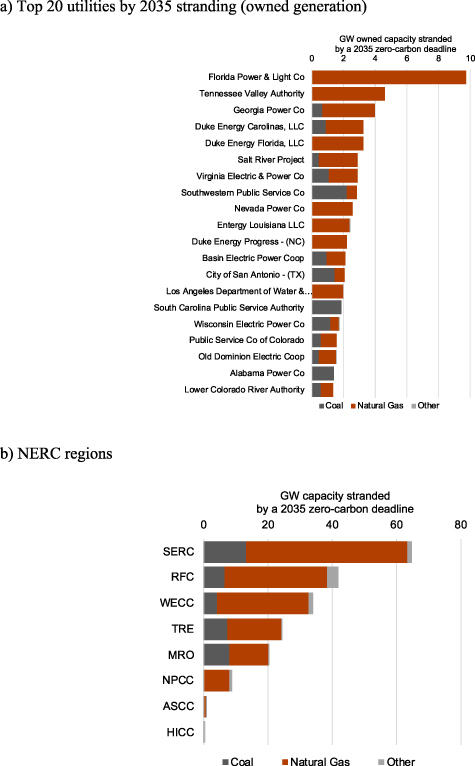
Figure 3. Power generation capacity operable as of 2019 that would be stranded under a 2035 deadline for zero-carbon electricity based on mean age-on-retirement lifespans.
Download figure:
Standard image High-resolution imageAs validation, and to show differences among regionalizations, figure 4 compares outputs for California's largest five utilities from this 2019 base year, generator-level model's three regionalizations (Data Files 1A–C) with outputs from a 2018 base year, plant-level model published for California specifically, which uses an eGRID regionalization (Grubert et al 2020).
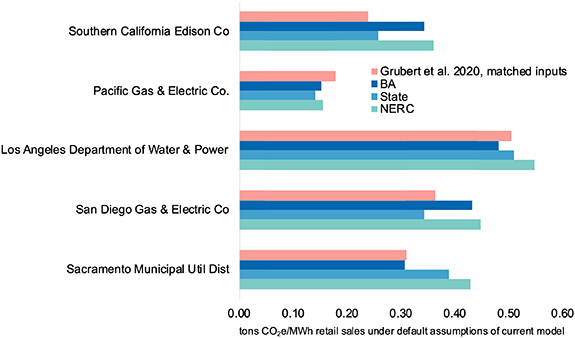
Figure 4. Annual average estimated 2021 GHG emissions factors for California's largest five utilities from (Grubert et al 2020) plant-level, 2018-base year model versus this work's three regionalizations, using reconciled assumptions.
Download figure:
Standard image High-resolution imageAs figure 4 shows, although trends are similar across all models, actual values differ. For the three regionalizations of this work's model (Data Files 1A–C), results reflect that California's large utilities are in different balancing authorities with varying GHG intensity of supply, in addition to an overall observation that California's NERC region (the Western Electricity Coordinating Council, WECC) has higher GHG intensity than the state (which has strict GHG rules) or relevant balancing authorities. Figure 4 also shows that utilities that purchase large shares of their electricity (e.g. Southern California Edison and San Diego Gas & Electric, see (Grubert et al 2020) figure 1) are more sensitive to wholesale assumptions. Other differences are explained by the fact that the California-specific model differs from this model in several relevant ways. First, the models use different base years. Second, as a plant- rather than generator-based model, resolution on ownership, retirement, and specific emissions is lower for the California-specific model. Third, this model underestimates access to hydropower, as hydropower contracts are complex and sellers (e.g. the Western Area Power Administration) operate across multiple regions. Finally, the California-specific model relies solely on eGRID for plant-level emissions estimates, resulting in a roughly 20% underestimate of 2018 California generator CO2 emissions versus this model's roughly 2% overestimate of 2019 California generator CO2 emissions (EIA 2021e). Notably, the validated policy, contract, and import-conscious values presented in Grubert et al (2020) are substantially lower than estimates in figure 4, reflecting the need for caution in using this model in contexts with significant policy-aware contracting and utilities with low asset ownership in particular. California is a particularly challenging case due to deregulation, policy, and import dynamics (Grubert et al 2020, von Wald et al 2021).
Figure 5 shows an analytical example of how utility-level annual average GHG emissions factors can be leveraged to evaluate life cycle impacts of electricity consuming activities. Specifically, figure 5 shows estimated lifetime GHG emissions from charging an electric vehicle on the utility systems shown in figure 2, using static 2021, dynamic 2021–2030 (with NGCC or zero-carbon new build), or 2031–2040 (with zero-carbon new build) annual average emissions factor projections.
Figure 5. Lifetime GHG emissions from electric vehicle charging in five utility service territories under four emissions factor assumption sets.
Download figure:
Standard image High-resolution image
As figure 5 shows, results using dynamic emissions factors are meaningfully different from static emissions factors, demonstrating that life cycle environmental evaluations are sensitive to changing conditions in the electricity sector. Ideally, future evaluations will incorporate temporal dynamics both within (Miller et al 2020) and across years.
4. Discussion
The GHG intensity of electricity is utility specific and changes over time. Particularly given recent policy emphasis on rapid decarbonization in the US electricity sector (Williams et al 2021), both understanding the potential evolution of emissions at decision-relevant scales (e.g. the power generator and utility levels) and creating tools that enable use of dynamic environmental characteristics for long-term analysis are relevant for evaluating possible futures. Understanding what emissions are committed by existing generation assets (Davis and Socolow 2014, Shearer et al 2020), or potentially stranded by policy (Fofrich et al 2020, Grubert 2020a), helps contextualize costs, difficulty, and environmental implications of alternative electricity system futures. In particular, clarity on how the assets utilities own are likely to affect their ability to meet decarbonization goals or requirements (Pomerantz and Kasper 2020) can highlight what actions might be necessary to meet those goals.
Existing models like the Annual Energy Outlook that do not account for asset lifespans in a manner consistent with historical observations risk portraying the system as much less mutable than it is on decadal time scales (Zacarias and Grubert 2021), further motivating the development of scenarios and modeling approaches that include explicit representation of historically consistent generator replacement. Understanding roughly when specific generators might close, particularly at the utility level, can inform recommendations for replacement investments that are consistent with utility, state, federal, and other emissions goals. Further, understanding potential future emissions intensity conditions for a given utility can inform sequencing of decarbonization efforts, including electrification, efficiency investments, and supply-side decarbonization. Efforts to characterize life cycle emissions associated with electrification likely over- or underestimate life cycle emissions by relying on existing or expected end-point future conditions alone, rather than accounting for dynamism over equipment lifetimes (figure 5; Ambrose et al 2020, Asdrubali et al 2020, Vaishnav and Fatimah 2020, Verma et al 2021). The model accompanying this letter is an attempt to improve access to reasonable projections for what these dynamics might be at utility and annual average resolution, with the expectation that future models might improve asset attribution and temporal resolution.
4.1. Limitations
Projections of future emissions and annual average GHG emissions factors are sensitive to assumptions like generator closure dates and electricity available for purchase. Several major limitations that are difficult to overcome given the model design include inability to select variable retail sales growth rates (e.g. by utility, region, or year); inability to assign new-build emissions profiles geographically or to specific utilities; and inability to model contracting relationships without adding proxy power plants or altering ownership relationships. This lack of contracting detail in particular means that the model will likely systematically overestimate emissions for utilities enacting GHG reductions through power purchasing agreements, and systematically underestimate emissions for utilities that do not. In general, due to model design and emphasis on owned assets, utilities that own most of their own generation are likely to be most accurately modeled.
Other limitations include lack of representational accuracy for purchased electricity. Not only are contracts with non-owned generation not modeled, but purchases are assumed to be restricted to the utility's own region. In practice, not only do some utilities operate across multiple regions, but trade of both electricity and environmental attributes exists across any of the regionalizations modeled in Data Files 1A–C (balancing authorities, states, and NERC regions) including through difficult-to-trace, one-sided transactions like renewable energy credit sales (one-sided in the sense that environmental attributes are not actually exchanged: null power generally does not legally take on the emissions intensity of the power its severed environmental attributes were purchased to displace). Further, emissions factors are presented as annual averages, which could miss relevant dynamics associated with when power is being bought and sold. Effectively, this model trades high emissions and emissions trading detail (see, e.g. von Wald et al 2021) for the ability to model first order dynamics at the utility level and into the far future.
Results should be treated as informative but not highly precise. Simplifications like neglecting losses (2.7% of generation as a disposition-weighted average across the US, but much higher for specific utilities) introduce minor errors. Assuming that generators continue to operate at 2019 levels until end-of-life is a reasonable approximation that nonetheless will not be true in practice: see Grubert (2020a, 2020b) for detailed discussion of the implications of this choice. Data cleaning choices, like assigning utilities to balancing authorities by matching EIA 861 'Sales_Ult_Cust' data to 'Operational_Data', in addition to manual adjustments like state-based assignment of NERC regions where the field is blank, introduce errors that are difficult to quantify relative to reality given a lack of validation data. Fundamental uncertainties like whether utility-owned generators might respond differently than merchant plants to future policy also affect results. In general, though, data are sufficiently robust to support general claims about asset turnover and sensitivity to major fuel mix transitions, particularly for utilities that own much of their own generation. The largest divergence from reality is likely associated with utilities with significant shares of contracted generation from units they do not own (e.g. small municipal utilities that are part of cooperatives), and with utilities operating across multiple regions with very low or no generation ownership (e.g. retail power marketers).
Acknowledgments
This material is based upon work supported in part by the National Science Foundation under Grant CNS 1931980. Any opinions, findings and conclusions or recommendations expressed in this material are those of the author and do not necessarily reflect those of the National Science Foundation. Thank you to Manasi Gali for assistance with preliminary data collection.
Data availability statement
All data that support the findings of this study are included within the article (and any supplementary files).