

Abstract
India relies on groundwater irrigation to produce staple grain crops that provide over half of the calories consumed by its over 1.3 billion people. While groundwater has helped India achieve grain self-sufficiency, aquifers have been overexploited across much of the country and its implications for crop production are unclear. To understand how groundwater depletion affects staple grain (wheat, rice, maize, pearl millet, and sorghum) production in India, we ran district-level panel regressions using agricultural census, groundwater observation, and gridded weather datasets over a ten-year study period (2004–2013). We find that nationally, declining groundwater levels are associated with significant reductions in yield, cropped area, and production for wheat, rice, and maize in the winter season. Despite the negative impacts of groundwater depletion on crop production, we find little evidence that farmers are switching from planting more water-intensive to less water-intensive grains. Using profit-based decision modeling, we further investigated the effects of agricultural energy prices on crop choice in the monsoon season across Haryana and Punjab, which are responsible for over 60% of India's grain production, have high electricity subsidies, and have rapidly depleting water tables. We find that eliminating energy subsidies for groundwater pumping would likely not encourage farmers to switch to planting less water-intensive crops, though sensitivity analyses suggest that it could encourage the adoption of increased water conservation efforts. In summary, our analyses reveal a discernable impact of groundwater depletion on crop production in India and suggest that reducing or removing energy subsidies may largely affect water use but not crop choice.
Export citation and abstract BibTeX RIS

Original content from this work may be used under the terms of the Creative Commons Attribution 4.0 license. Any further distribution of this work must maintain attribution to the author(s) and the title of the work, journal citation and DOI.
Corrections were made to this article on 22 July 2021. The Acknowledgments section was amended.
1. Introduction
Groundwater is a critical source of irrigation but is becoming rapidly depleted in many regions across the globe. This is particularly true in India, where groundwater provides over 60% of irrigation (Siebert et al 2010, Saha et al 2018), and where water levels have dropped by more than 8 m on average since the 1980s (Rodell et al 2009, Aeschbach-Hertig and Gleeson 2012, Sekhri 2012). This is because at this time groundwater pumps were introduced to increase groundwater withdrawal capacities and, since then, the number of groundwater structures has more than quadrupled to over 20 million (Mukherji et al 2013). Coupled with policies that support highly subsidized, unmetered, and unregulated electricity, farmers have largely been able to withdraw groundwater on-demand in many parts of India. The rise of groundwater irrigation greatly contributed to large food production gains, by increasing production in the dry season and reducing the sensitivity of crops to weather variability (Fishman 2018, Zaveri and Lobell 2019). Groundwater irrigation is critical for India's food security, and its importance will likely only increase over the coming decades due to climate change.
Given the magnitude of India's groundwater depletion problem, it is important to understand the consequences of groundwater depletion for the country's food production. Studies suggest that groundwater depletion has already reduced crop production (Sekhri 2013) and, in the future, will further reduce cropping intensity and production (Zaveri et al 2016, Jain et al 2021), and amplify the negative effects of climate change (Tack et al 2017, Zaveri and Lobell 2019). While these studies provide important insights into the impacts of groundwater depletion on agricultural production, they have focused only on a single crop type, single growing season, or an aggregate class of multiple crops (e.g. food grains). To date, the effects of groundwater depletion on the production of a suite of individual food crops with variable water requirements are not well understood. Yet understanding the effects of groundwater depletion on individual food crops is important because it can provide insight into whether there are specific crops that are most at risk and in need of interventions or policies to maintain production. In addition, previous studies largely focused on the impacts of groundwater depletion on production and did not examine whether farmers change crop planting areas in response to falling water tables. Such information can reveal if farmers are adapting to groundwater depletion by switching to planting less water-intensive crops.
In this study, we fill these knowledge gaps by examining the impact of groundwater depletion on the production of India's main staple grain crops, rice, wheat, maize, pearl millet, and sorghum, which provide over 50% of household calories (Rampal 2018). We use district-level datasets (https://doi.org/10.6084/m9.figshare.14960100.v1) on crop yield, crop area, groundwater depths, and weather from 2004 to 2013 in fixed-effect panel regression models to examine the impact of groundwater depletion on (a) grain yields, (b) grain production, and (c) the area planted under grain crops. In addition, we examine whether groundwater depletion results in farmers switching to less water-intensive crops by identifying whether (d) the proportion of area under each grain crop changes in response to falling water tables. Finally, we examine (e) whether increasing the price of energy incentivizes farmers to plant less water-intensive crops in Punjab and Haryana, two states with high rates of groundwater depletion and high levels of energy subsidies. This study provides important implications for India's future food security in the face of groundwater depletion.
2. Methods
2.1. Data collection and collation
We used several datasets in this study, including crop production, weather, groundwater, price, and cost data (table S1 (available online at stacks.iop.org/ERL/16/085003/mmedia)). We obtained district-level crop production information, including seasonal yield, seasonal cropped area, and annual harvest price for each crop from 1997 to 2015 from International Crops Research Institute for the Semi-Arid Tropics (supplementary methods). The crops included winter wheat, winter and monsoon rice, winter and monsoon maize, winter and monsoon sorghum, and monsoon pearl millet, as these are India's major staple grains (Hazra 2001) (figure 1(A)). We derived district-level pre-monsoon (May) and pre-winter (November) groundwater levels from 2004 to 2013 using data (figure 1(B)) from the Central Groundwater Board (see supplementary methods). We obtained rainfall data from NASA's Tropical Rainfall Measuring Mission (Huffman 1997, Huffman et al 2015) and temperature data from the Climatic Research Unit (Harris et al 2014), and calculated seasonal total rainfall and mean temperature from 2004 to 2013 at the district scale (supplementary methods). Finally, we obtained fixed costs for principal crops for Punjab and Haryana from the Directorate of Economics and Statistics (table S2).

Figure 1. Spatial distribution of district level crop production and groundwater table depth in India. Maps display (A) 1997–2014 mean district level crop production in tons for each of five staple crops (winter wheat, winter and monsoon rice, winter and monsoon maize, winter and monsoon sorghum, and monsoon pearl millet) and (B) 2004–2013 mean district level preseason groundwater table (m). Polygons in red in panel (B) show the states of Punjab (top) and Haryana (bottom).
Download figure:
Standard image High-resolution image2.2. Fixed-effect panel regressions
We used fixed-effect panel regression models to identify whether groundwater depletion was associated with changes in (a) yield, (b) production, (c) area, and (d) proportional area for each of the five main grain crops (i.e. rice, wheat, maize, sorghum, and pearl millet) during the monsoon and winter seasons. We ran all regressions (equations (1)–(8)) at the national scale and for the region where we conducted our subsidy analysis, Punjab and Haryana. Regression results are reported for each crop that had yearly observations for at least 50 unique districts (40 for Punjab and Haryana regressions due to smaller sample size). For the national level regressions, we ran two robustness checks. First, we restricted our analyses to only districts that had more than four wells available to ensure that differences in well data availability were not affecting our results. Second, we used state × linear time trends instead of a year fixed effect to see whether our results changed based on the way we specified time.
2.2.1. Yield and production regressions
We estimated the association between preseason groundwater level depth with yield (equations (1) and (2)) and production (equations (3) and (4)) for all crops. We hypothesized that yield and production will decline as groundwater tables fall, due to reduced access to groundwater for irrigation. We estimate the following regression for each crop separately:
where WinterYieldiy (WinterCPiy ) and MonsoonYieldiy (MonsoonCPiy ) represent crop-specific mean yields (total production) for a district i at a growing season year y; GWLiy represents preseason (May for the monsoon season and November for the winter season) mean district-level well depth in meters for year y, MonsoonPiy and WinterPiy represent total monsoon and winter rainfall (mm), respectively; WinterTiy and MonsoonTiy represent seasonal mean temperature for the winter and monsoon season, respectively; Fey and Fei represent year and district fixed effects, respectively.
2.2.2. Area and proportional area regressions
We examined the association between preseason groundwater level depth with area (equations (5) and (6)) and proportional area (equations (7) and (8)) for all crops. The proportional area was calculated as the proportion of total cropped area (in %) within the same growing season that was planted under a particular crop. In both regressions, we included total monsoon rainfall as a control variable as monsoon rainfall serves as an important means to irrigate crops. Given that farmers make decisions about what crops to plant prior to the start of the growing season, we included monsoon rainfall from the previous year in all monsoon regressions, as it is unclear how same-season rainfall could alter farmer decision-making at the start of the season. We hypothesized that falling groundwater tables will be associated with decreased area and proportional area under (a) water-intensive crops (e.g. rice) and (b) crops planted during the largely dry winter season (e.g. wheat):
where WCAit and MCAit are total farmed area of each crop in thousands of hectares during the winter and monsoon seasons, respectively; PWCAit and PMCAit are proportional area of each crop in % during the winter and monsoon seasons, respectively. All other variables in equations (5)–(8) are the same as those outlined above for equations (1)–(4), however, monsoon season at time y − 1 was used to examine the impact that previous season rainfall has on cropping decisions.
2.3. Crop choice model
To better understand the impact of electricity subsidies, we modeled farmer crop choice based on crop yield, groundwater depth, and pumping cost under different energy price scenarios. We focused this analysis on the states of Punjab and Haryana, where over 93% of irrigated food grains are produced (GOI 2018), energy is heavily subsidized, and the highest rates of groundwater depletion occur (Rodell et al 2009). We also focused on the monsoon season as most farmers in these states plant water-intensive rice during the monsoon season though alternative lower-water use grains exist, such as maize, pearl millet, and sorghum. However, in the winter season, most farmers plant wheat and few alternative grain crops exist that would use less water (Halli et al 2016).
Our crop choice model assumes that farmers are profit-maximizing and will choose to plant the most profitable crop. The decisions are made at a district level and are based on 2004–2013 mean profit for each crop (Profitcrop), which is calculated by subtracting the cost to grow the crop (Costcrop) from total revenue (Revenuecrop) earned for the crop per hectare (equation (9)):


Revenue was calculated by multiplying district level mean yield (Yieldcrop; tons ha−1) by district level mean price (Pricecrop) for each crop (equation (10)). Cost was calculated by adding the price of water (INR ha−1) to the fixed cost (table S2) of planting per hectare (equation (11)). The price of water (Pricewater: INR ha−1) was calculated by multiplying the price of energy by the amount of energy required to pump water from a given depth (equation (12)):

The energy (kWh ha−1) needed to pump water was modified and calculated from an equation created by Zhu et al (2007) (equation (13)):

The coefficient φ (equation (14)) is obtained by multiplying pumping efficiency (γ; between 0.4 and 0.7) by the density of water (ρ = 1000 kg m−3) and the acceleration due to gravity (g = 9.8 m s−2), which was taken as 0.6 following common values in the literature (Sant and Dixit 1996, Jagtap 2013). The groundwater depth (h, m) was calculated as the mean pre-monsoon groundwater depth per district. IWcrop represents total water withdrawal for irrigation, which includes both the amount of water used by the crops for biomass production (i.e. Yieldcrop) and those not used by the crops (or water lost during the process of irrigation). Following Jägermeyr et al (2015), IWcrop was derived as:

where Wcrop represents the actual irrigated water used by crops, which was estimated as the blue water footprint of crops (Rost et al 2008, Mekonnen and Hoekstra 2010) using values for each crop for the states of Punjab and Haryana (and all of India for supplemental analysis, table S3) from Kayatz et al (2019). Eb is the beneficiary water efficiency or the ratio of the total water consumed by the crops (transpiration) for biomass production to total water withdrawn or diverted for irrigation (Seckler et al 2003, Jensen 2007, Jägermeyr et al 2015). Eb accounts for potential irrigated water lost in the system and reported values of Eb are typically lower for India and Southeast Asia (∼30%), as these regions primarily use surface (flood) irrigation (Jägermeyr et al 2015). We used a value of 29% (i.e. 0.29) for Eb, which is also the reported global mean Eb for surface irrigation (Jägermeyr et al 2015). We also considered two additional scenarios assuming that irrigation for alternative crops is more efficient than rice by considering higher Eb values of 0.4 and 0.5 for these alternative crops. These values are based on the average of the global mean Eb reported for (a) surface and sprinkler irrigation and (b) surface, sprinkler, and drip irrigation, as reported by Jägermeyr et al (2015).
We also performed a sensitivity analysis to understand which factors most influenced farmer crop choice. We used the Morris Method (Morris 1991, Franczyk 2019) to calculate the sensitivity of the model's outcome to each input, including crop yields, crop prices, groundwater depths, and energy prices under low (0–0.1 INR (kWh)−1), mid (0.1–5.5 INR (kWh)−1), high (5.5–11.71 INR (kWh)−1), and very high (11.71–17 INR kWh−1) energy price scenarios (supplementary methods).
3. Results
3.1. Yield fixed-effect panel regression
We find that nationally the preseason groundwater depth coefficient had a significant negative association with yield for several staple crops in the winter season, including wheat, rice, and maize, but no effect on monsoon season crops (figure 2). The effect was negative but only marginally significant for winter sorghum. We find that nationally a 1 m decline in preseason groundwater depth was associated with a 1%–3% decline in mean yields for winter crops (table S4). The largest (i.e. ∼3%) and smallest (i.e. ∼1%) decline in mean yields were experienced by winter rice and winter wheat, respectively. When the regression models were run across districts within Punjab and Haryana only, we found no effect of groundwater depletion on winter wheat and monsoon rice yields (table S5).
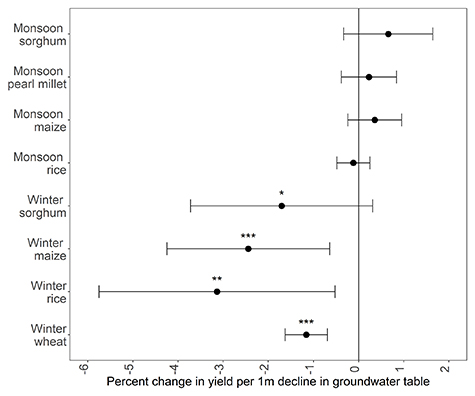
Figure 2. Effects of groundwater depletion on yield at the national scale. The regression coefficients (β) are expressed as (exp(β) − 1) × 100 to approximate percent change in yield in response to a 1 m decline in the groundwater table. All regressions include district and year fixed effects. *, **, and *** indicate p values less than 0.1, 0.05, and 0.01, respectively. The number of observations ranges from 824 (winter sorghum regression) to 4044 (winter wheat regression) with data from 109 to 420 districts in India depending on the regression model. Error bars represent 95% confidence intervals derived as the exponentiated coefficient value ± 1.96 × standard error of the regression coefficient (table S4).
Download figure:
Standard image High-resolution imageWith respect to climate variables, crop yields generally showed positive effects with rainfall and negative effects with temperature (table S4). Specifically, across most regressions, winter wheat, winter maize, winter sorghum, and monsoon rice had a significant positive association with monsoon rainfall and temperature was significantly negatively associated with yields for winter wheat, winter rice, winter maize, and monsoon millet. The associations between seasonal mean temperature and winter wheat yield and monsoon rice yield were consistent for Punjab and Haryana, while the associations between monsoon rainfall and crop yield were insignificant (table S5).
3.2. Production fixed-effect panel regression
We find that nationally groundwater decline led to a reduction in winter crop production by 4%–8% per 1 m decline in groundwater tables (figure 3, table S6). However, the effect was mostly insignificant for the production of monsoon crops except for monsoon maize, for which a 1 m decline in groundwater level was associated with a 1% reduction in crop production. Groundwater depletion was most associated with production losses for winter maize (−8% per 1 m) and winter rice (−7% per 1 m). In Punjab and Haryana, groundwater depletion was not associated with winter wheat production and was marginally significant for monsoon rice (table S5).
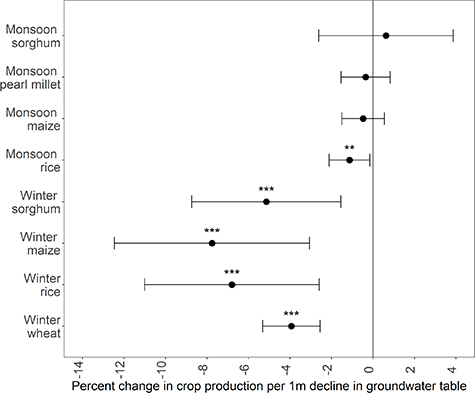
Figure 3. Effects of groundwater depletion on production (yield × area) at the national scale. The regression coefficients (β) are expressed as (exp(β) − 1) × 100 to approximate percent change in cropped area in response to a 1 m decline in the groundwater table. All regressions include district and year fixed effects. *, **, and *** indicate p values less than 0.1, 0.05, and 0.01, respectively. The number of observations ranges from 847 (winter sorghum regression) to 4056 (winter wheat regression) with data from 110 to 401 districts in India depending on the regression model. Error bars represent 95% confidence intervals derived as the exponentiated coefficient value ± 1.96 × standard error of the regression coefficient (table S6).
Download figure:
Standard image High-resolution imageProduction of winter wheat, winter rice, monsoon rice, and monsoon millet were positively associated with monsoon rainfall and negatively associated with seasonal temperature, except for monsoon rice production which was positively associated with temperature (table S6). Weather was not significantly associated with monsoon rice and winter wheat production in Punjab and Haryana (table S5).
3.3. Area fixed-effect panel regression
Nationally we found that deeper groundwater depths were significantly associated with reduced area under winter wheat, winter rice, winter maize, winter sorghum, and monsoon maize (figure 4, table S7). This negative effect was most pronounced for winter maize area (−5.8% per 1 m), compared to a 2.7%–3.5% reduction in area of other winter crops. The effect of groundwater depletion was relatively small and mostly insignificant for monsoon crop area, except for monsoon maize area (−2.2% per 1 m). In Punjab and Haryana, groundwater depletion was not associated with winter wheat area but was significantly associated with a reduction in area under monsoon rice (table S5).
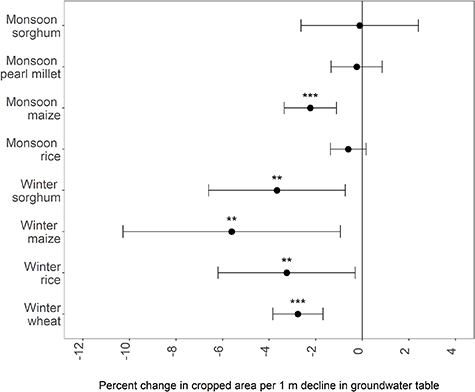
Figure 4. Effects of groundwater depletion on area at the national scale. The regression coefficients (β) are expressed as (exp(β) − 1) × 100 to approximate percent change in cropped area in response to a 1 m decline in groundwater table. All regressions include district and year fixed effects. *, **, and *** indicate p values less than 0.1, 0.05, and 0.01, respectively. The number of observations ranges from 847 (winter sorghum regression) to 4056 (winter wheat regression) with data from 110 to 401 districts in India depending on the regression model. Error bars represent 95% confidence intervals derived as the exponentiated coefficient value ± 1.96 × standard error of the regression coefficient (table S7).
Download figure:
Standard image High-resolution imageWe find that monsoon rainfall (either previous season or the previous year) was positively associated with area under winter wheat, winter rice, monsoon rice, and monsoon millet (table S7) nationally. However, in Punjab and Haryana, monsoon rainfall was not associated with winter wheat and monsoon rice area (table S5).
3.4. Proportional area fixed-effect panel regression
We find that groundwater depletion was significantly associated with reductions in the proportional area of monsoon rice (figure 5, table S8), but the effects were very small (−0.21% per 1 m). Proportional winter maize and winter wheat area also decreased in response to groundwater depletion, but at a small level (<−0.2% per 1 m). In Punjab and Haryana, the effects of groundwater depletion on proportional area were not significant for winter wheat and winter rice and were marginally significant for monsoon rice (table S5).
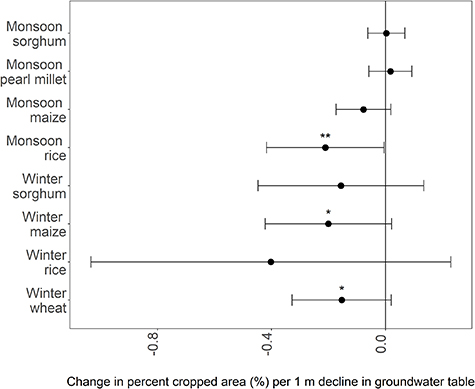
Figure 5. Effects of groundwater depletion on proportional area (%) at the national scale. All regressions include district and year fixed effects. *, **, and *** indicate p values less than 0.1, 0.05, and 0.01, respectively. The number of observations ranges from 842 (winter sorghum regression) to 4056 (winter wheat regression) with data from 110 to 401 districts in India depending on the regression model. Error bars represent 95% confidence intervals derived as coefficient value ± 1.96 × standard error of the regression coefficient (table S8).
Download figure:
Standard image High-resolution imageWe find that rainfall from the previous season or year had a positive effect on proportional area under winter wheat and monsoon maize but a negative effect on proportional area under monsoon maize and monsoon sorghum (table S8). In Punjab and Haryana, these effects were significantly positive for proportional area under winter wheat (∼5 times greater than the effect at the national scale) but were insignificant for proportional area under monsoon rice (table S5). For all regressions, we find that our robustness checks of subsetting for districts that have at least four wells (tables S9–S12) and defining time as a linear trend (tables S13–S16) did not change the direction and magnitude of our main results.
3.5. Crop choice model
The crop choice model shows that changes in the price of energy can drive crop choice decisions (figure 6). As the price of energy increases, farmers are more likely to switch from producing more water-intensive rice to producing less water-intensive maize or sorghum. Regardless of the price of energy, farmers are the least likely to switch to sorghum and pearl millet due to the higher cost associated with its production and lower yields and revenue. At the average subsidized price of energy in Punjab and Haryana (0.045 INR (kWh)−1), our model suggests that farmers will plant rice in most districts (∼83%) under all conditions when beneficiary irrigation efficiency from the alternative crops was similar or higher than that from rice. As the price of energy increases to the national average price of energy (5.15 INR (kWh)−1), farmers in slightly more districts will switch to planting maize (∼19%) and sorghum (∼10%); however, rice will still remain the primary crop choice across most districts (∼71%). Energy prices will have to increase substantially to 16 INR kWh−1 for farmers in approximately half of districts to switch away from planting rice. This energy cost, however, is likely unrealistic given that this price is over three times greater than the average cost of energy across the country.
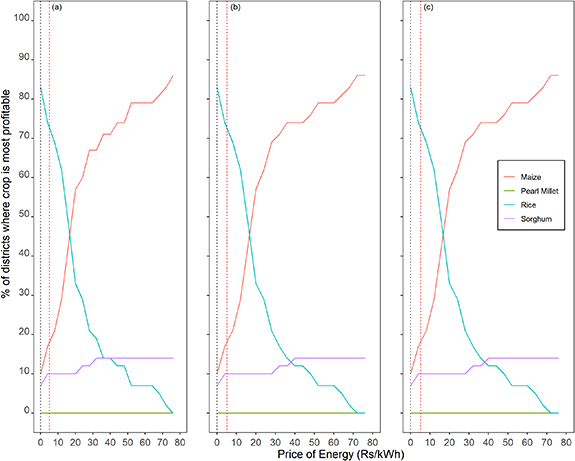
Figure 6. Crop choice model outcomes. The graph depicts aggregated profit-based crop decisions as the percent of total districts (n = 42) in Punjab and Haryana that would plant rice, maize, pearl millet, or sorghum based on a given price of energy (x-axis). The black dotted line indicates the 2007–2013 average subsidized energy price (0.045 INR kWh−1) for agricultural use in Haryana and Punjab. The red dotted line indicates the national average price (5.15 INR kWh−1) of electricity for the same period. Panels (a)–(c) consider beneficiary irrigation efficiency of 0.29, 0.4, and 0.5, respectively, to account for nonconsumptive use of irrigation water by crops.
Download figure:
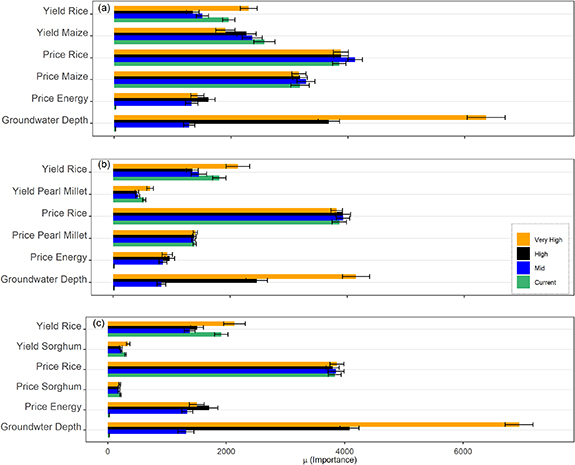
Standard image High-resolution imageWe further studied the sensitivity of net profit to crop yields, crop prices, and groundwater depths under our current to very high energy price scenarios. We find that when energy prices are low (current prices, green bars), crop price and yield are much more important for decision-making, particularly the price and yield of rice (figure 7). Crop decisions become more sensitive to the depth of water table and price of energy as the price of energy increases, with the importance of groundwater depth becoming more important than the price of rice in the high and very high energy price scenarios (black and yellow bars, respectively). The price of energy is largely less important than crop yield and price, especially for rice, which suggests that a cost of energy that is even higher than those proposed in our scenarios is needed to incentivize farmers to switch to planting less water-intensive crops.
Figure 7. Morris method sensitivity analysis showing the relative importance of input variables in the crop choice model. The bar graphs depict importance based on modeled net profit in response to input factors in Punjab and Haryana, between (a) rice and maize, (b) rice and pearl millet, and (c) rice and sorghum. Results from the low, mid, high, and very energy price scenarios are in green, blue, black, and yellow, respectively. The error bars show the 95% confidence interval of the mean (mean + 1.96 × standard error) based on 30 random simulations of the Morris method sensitivity analysis.
Download figure:
Standard image High-resolution image
4. Discussion and conclusion
Groundwater is a critical resource for agricultural production in India, helping to irrigate much of the nation's staple crops (Dalin et al 2017). Due to rapid overexploitation, groundwater reserves are becoming depleted in many regions across the country (Rodell et al 2009, Shah 2009, Asoka et al 2017). In our study, we examined the effects of groundwater depletion on agricultural production and crop planting decisions across India. Our findings suggest that groundwater depletion is already impacting crop yield, area, and production, but only in the largely dry winter season when groundwater is a primary source of irrigation and there is little additional rainfall to water crops. This is likely due to the increased effort and cost to pull water from deeper depths as water tables fall and the limited ability of other irrigation sources to water crops during the winter season. Our findings are consistent with previous studies that have shown reductions in area of water-intensive crops and winter crops (Moors et al 2011, Sekhri 2013, Dar et al 2020, Jain et al 2021). Considering whether farmers adapt by switching to less water-intensive crops, we find that though the proportional area under water-intensive crops decreases as water tables fall, this level of decrease is small. This finding aligns with studies that show that Indian farmers have responded to falling water tables by increasing investment in high capacity pumps as opposed to adopting water-saving cropping practices (Kaur and Vatta 2015, Palanisami et al 2015, Tripathi and Mishra 2017).
We find that the effect of groundwater depletion on agricultural production varies based on the growing season. Groundwater depletion mostly negatively impacts the yield, area, and production of all grain crops during the largely dry winter season when groundwater is the main and sometimes only source of irrigation. During the monsoon season, when alternative sources of water are available through rainfall and surface irrigation, groundwater depletion mostly does not affect the yield, area, and production of any grain crop, except for water-intensive rice; for rice, groundwater depletion is associated with small reductions in area and production. This may be because of the relatively high-water requirement of rice (Frenken et al 2012) including the need to maintain continuous seepage and percolation flows using ponded water (Bouman and Tuong 2001), which may be a challenge in areas with low rainfall and deep groundwater tables. These results suggest that during the monsoon season, farmers are responding to falling groundwater tables by reducing the amount of area planted under rice, but not the amount of irrigation applied to the rice paddy that they do plant.
The effect of groundwater depletion on agricultural production also varies based on crop type. Groundwater depletion is associated with the largest yield declines for winter rice then maize, and the largest area reductions for winter maize then rice. There is less impact of groundwater depletion on winter wheat and sorghum. Interestingly, even though the largest yield declines are seen for winter rice, farmers are more likely to reduce the area under winter maize due to groundwater depletion. This may be partially explained by differences in where winter rice and winter maize are planted. Winter maize is concentrated in Central and Southwest India (figure S1), where groundwater tables are already low (figure 1) and there is little winter rainfall, and winter rice is concentrated in North and Eastern India, where groundwater tables are higher and there is more winter rainfall (figure S2). Farmers may, therefore, face increased irrigation constraints in Central and Southwest India where maize is planted, resulting in a greater reduction in area under winter maize at the national scale. Considering crop switching, we find that farmers reduce the area under monsoon rice in response to falling groundwater levels, however, this effect is small (<0.21% per 1 m decline). This suggests that crop switching is not an important axis of adaptation to falling groundwater tables.
When we examine the impact of groundwater depletion on agricultural production across Punjab and Haryana, two highly input-intensive agricultural states in India, we found no effect of groundwater depletion on winter wheat and monsoon rice yields. This may be because these states are primarily located across the highly recharged alluvial plains of the Indo-Gangetic Plain (IGP), and heavily subsidized electricity may have cushioned the impact of groundwater depletion on crop yields in this region. We did find that groundwater depletion is associated with a reduction in area and production of monsoon rice, which suggests that farmers respond to falling groundwater tables by reducing the area under irrigation and not the amount of irrigation applied to planted fields. While we did find that farmers reduced the proportional area under monsoon rice in response to falling groundwater tables, this result was very small (∼0.25% per 1 m decline) and only marginally significant (table S5). This suggests that crop switching is not an important way that farmers are responding to falling groundwater tables in this region.
Based on the results of our crop choice model for Punjab and Haryana, we find that at current subsidized energy prices, the most profitable monsoon crop was rice. More surprisingly, when energy prices were set in line with the national average cost of electricity (approximately 114 times higher), there was only a modest effect on crop choice, with farmers in 29% of districts expected to switch to less water-intensive maize and pearl millet. Strikingly, only after setting prices to 16 Rs kWh−1 (approximately 356 times higher) would farmers in half of districts switch to planting less water-intensive crops (figure 6). Some studies have suggested that the most efficient way to ration farmer water consumption would be to raise the price of electricity through subsidy reform (Balani 2013), with one study concluding that a 10% reduction in subsidies can reduce groundwater extraction by 4.4% (Brooks and Gruère 2014). Our findings suggest that crop switching will likely not be the primary response to realistic changes in energy prices. We did find that with higher energy prices, both groundwater levels and energy prices became increasingly important factors in profit-based crop decisions. This suggests that even though increasing energy prices may not incentivize farmers to switch crops, it may incentivize other water conservation efforts, such as using more efficient irrigation infrastructure like sprinkler and drip irrigation (Fishman et al 2015, Taraz 2017), growing shorter-duration, less water-intensive rice varieties (Livingston 2009, Balwinder-Singh and Gaydon 2015), using supplemental canal irrigation (Hussain et al 2003), adopting water-saving laser land leveling (Larson et al 2016), and shifting sow dates to better align with monsoon onset (Rao et al 2016).
We note several limitations with our analyses. Uncertainties in the district level data (Ajaz et al 2019) could introduce biases in our regression coefficients, which we attempted to reduce by removing obvious outliers in the data (supplementary method). In addition, district groundwater levels were determined based on mean values from all available wells located within each district, and it is possible that values are not accurate for districts with few observation wells. As a robustness check, we reran all regressions using only districts where at least four wells were available and found that our results largely remained similar, suggesting that differences in well data availability did not bias our results (tables S9–S12). Considering our crop choice model, it does not consider that groundwater quality likely diminishes as water tables decline (Konikow and Kendy 2005), particularly in coastal areas. In addition, we assume that the cost of energy will remain linearly associated with depth as water tables fall, however, this association may not be linear as new, costly infrastructure may be required to reach deeper water tables. We also did not consider the impact of minimum support prices (MSP) (Srinivasan and Jha 2001, Balani 2013, Shah 2014), however, we do not think this should impact our results as the crop prices that we used in our models were higher than the average MSP during our study period. Further, we considered a beneficiary irrigation efficiency of 0.29 (i.e. 29% of irrigated water used in transpiration) to estimate total water withdrawal in the crop choice model. However, this value varies depending on the type of irrigation used, which is not captured in the model, and we assume that the Eb for India is the lowest among other highly irrigated countries in the world (Jägermeyr et al 2015). As a sensitivity analysis, we considered additional scenarios of higher efficiency for alternative crops (Eb = 0.4 and 0.5) compared to rice and found that results from our crop choice model are similar (figures 6(b) and (c)). Besides, we did not account for additional energy required to account for losses in other irrigation systems (e.g. head losses in pipes and filtration in sprinkler and drip irrigation systems). However, we considered a pumping efficiency of 0.6 following literature and believe that additional loss in the systems is relatively small (Bhatnagar and Srivastava 2003) to change our results. We used one blue water footprint value for all of Punjab and Haryana, but acknowledge that this value can vary across districts due to differences in climate, crop management, and crop variety. We do not believe this variation is large enough to change the main results of our model given that when we rerun our model using the blue water footprint reported for all of India we get similar results (table S3; figure S3). Finally, we do not account for cultural food preferences, particularly preferences for consuming rice and wheat (Timsina and Connor 2001, Davis et al 2018, Defries et al 2018), which may additionally influence crop choice decisions. Despite these limitations, we believe that our overall finding that increased energy prices alone will not incentivize large-scale crop switching is likely accurate.
In conclusion, we find that groundwater depletion is already negatively impacting agricultural production in India, particularly during the winter season. Despite these negative impacts, we find little evidence that farmers are switching to planting less-water intensive crops as groundwater tables fall. Interestingly, our scenario analysis suggests that raising energy prices alone will have little impact on crop switching. These results in combination with findings from other studies suggest that additional measures are likely needed to change farmer behavior, including prioritizing water use seasons, rationing energy, and rewarding farmers who conserve groundwater (Sidhu et al 2020). Such interventions will be critical for maintaining and increasing India's food security in the face of groundwater depletion over the coming decades.
Acknowledgments
We would like to thank our funding sources including the Earth Systems Volpert Scholars Award to A. Pollack, a NSF SEES grant (1708480 awarded to M. Jain), a NASA Land Cover and Land Use Change grant (NNX17AJ97G awarded to M. Jain), and a NASA New Investigator Grant (NNX16AI19G awarded to M. Jain). We would also like to thank Weiqi Zhou for help in coding the Crop Choice model analysis.
Data availability statement
The data sources for all datasets are provided in the supplementary information (table S1). The panel dataset and Stata code to run key regressions are available at https://doi.org/10.6084/m9.figshare.14960100.v2. All additional data and all codes (in R and Stata) used to create figures and perform analysis are available from the corresponding author upon reasonable request.
All data that support the findings of this study are included within the article (and any supplementary files).
Author contributions
The research was conceived and designed by M Jain, A Pollack, N Bhattarai, and D B Lobell. All data compilation and analysis were conducted by N Bhattarai and A Pollack. A Pollack and N Bhattarai wrote the first draft of this paper, and all authors contributed to the final manuscript.