

Abstract
As global warming makes the Arctic Ocean more accessible, concerns have been raised about the environmental consequences of a possible expansion of commercial fisheries into pristine marine ecosystems. Using a recently released global dataset, we quantify for the first time how fishing activities are responding to diminishing sea ice and a warmer Arctic Ocean. We show that trawling dominates Arctic fisheries and that this activity penetrates rapidly into Arctic shelf areas previously protected by extensive ice-cover as a response to interannual sea ice loss. We model the development of trawling activity under a climate change scenario and use the model to identify areas with high risk of increased trawling activity and estimate the amount of trawling avoided in recently established fishery protection zones. Stronger responsibility must be undertaken by Arctic coastal states to regulate increased fishing pressure and protect vulnerable Arctic shelf ecosystems.
Export citation and abstract BibTeX RIS

Original content from this work may be used under the terms of the Creative Commons Attribution 4.0 license. Any further distribution of this work must maintain attribution to the author(s) and the title of the work, journal citation and DOI.
1. Introduction
Some of the world's major fisheries are found in the Subarctic shelf areas bordering the Arctic Ocean (Hollowed and Sundby 2014, Hoel 2018). The Subarctic fisheries are sustained by large and productive fish stocks including Alaska pollock, Atlantic and Pacific cod, Atlantic and Pacific herring, Pacific salmon and capelin. Currently, most of these fisheries are managed sustainably in terms of securing the long-term yield from large and productive stocks (Worm et al 2009, Gullestad et al 2014, 2020, Kjesbu et al 2014, Costello et al 2016), and several measures have been introduced to limit fishery discards and detrimental fishing practices (Gullestad et al 2017, Jørgensen et al 2020, Long and Jones 2020, Snyder and Erbaugh 2020). North of the rich fishing grounds, sea ice limits ecosystem productivity as well as accessibility, rendering the High Arctic shelf ecosystems more or less untouched by fishing and other human activities (figure 1). While the Subarctic ecosystems are dominated by high pelagic production that supports large fish stocks, the strong pelagic-benthic coupling in the seasonally ice-covered High Arctic marine shelf ecosystems supports highly diverse and productive benthic communities (Carmack and Wassmann 2006, 2006, Grebmeier et al 2015, Frainer et al 2017, Jørgensen et al 2019, Huntington et al 2020). For example, extensive surveys in the northern Barents Sea revealed a rich and diverse seabed community including high abundance of sessile organisms that are susceptible to be damaged by demersal trawling, including sponges, sea pens, cauliflower corals, and sea lilies (Jørgensen et al 2019). Similarly, the seasonally ice-covered Northern Bering and Chukchi Seas hold a rich benthic dominated food web, supporting abundant benthic feeding eiders and marine mammals important for indigenous subsistence (Grebmeier et al 2006, 2015). Rapidly diminishing sea ice (Stroeve et al 2007, Carmack et al 2015) and a poleward shift in the distribution of the productive Subarctic commercial fish stocks (Fossheim et al 2015, Andrews et al 2019) can provide new grounds for commercial fisheries in previously ice-covered marine ecosystems (Kjesbu et al 2014, Misund et al 2016). Accordingly, Jørgensen et al (2019) suggested that these previously unexploited ecosystems are facing the cumulative impacts from three major pressures: (a) amplification of global warming in the Arctic is rapidly changing the physical environment (Carmack et al 2015, Polyakov et al 2017, Lind et al 2018, Huntington et al 2020), and reductions in sea ice extent are expected to weaken the pelagic-benthic coupling causing benthic production to decrease (Wassmann and Reigstad 2011, Grebmeier 2012). (b) Invasive species from the south are altering the ecological communities by introducing new predators, competitors and pathogens (Fossheim et al 2015, Kortsch et al 2015, Jørgensen et al 2019). (c) Finally, an expanding fishing industry might disturb the seabed habitat and impact endemic Arctic species (Christiansen et al 2014, Christiansen 2017, Jørgensen et al 2019).
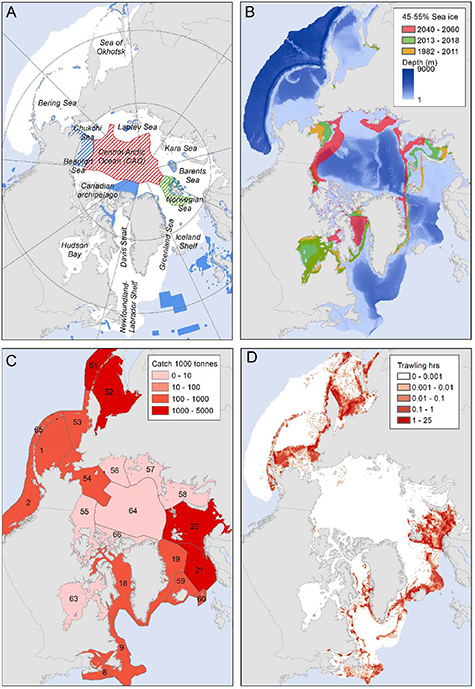
Figure 1. Study area, physical environment and fishing activity in the Arctic. (A), study area. Blue areas are marine protected areas (data from (UNEP-WCMC 2019)). Hatched areas are fishery management areas: Arctic Alaska (blue hatched), Central Arctic Ocean (CAO) (red hatched) and area around Svalbard northern Barents Sea (green hatched). (B), placement of the sea ice border, here defined as the distribution of 45%–55% annual sea ice cover during the reference period (1982–2011), recent period (2013–2018) and the future climate scenario (2040–2060). (C), LMEs, LME number and total fishery catch from 2014 (see table S2 for LME names, and catch specifications) (D), hours of trawling per km2 in 2018.
Download figure:
Standard image High-resolution imageThe fisheries on the continental shelves of the Arctic Ocean are mainly managed within the exclusive economic zones (EEZs) of the coastal states. The Subarctic fisheries are typically regulated by quotas set by rigorous stock assessments (e.g. Gullestad et al 2014). However, the protection of High Arctic benthic ecosystems from expanding demersal trawling would require a spatial approach. In 2009, several regulatory measures were implemented in Alaska waters to prevent adverse ecosystem effects from expanding fisheries (Stram and Evans 2009). Most notably, all commercial fishing was prohibited in Arctic federal waters north of the Bering Strait. More recently, a fishery protection zone around the Svalbard archipelago in the northern Barents Sea was established in 2019 to protect vulnerable sea bed communities (Jørgensen et al 2020). In October 2018, the five Arctic Ocean coastal states together with China, the European Union (EU), Iceland, Japan and South Korea signed the Agreement to Prevent Unregulated High Seas Fisheries in the CAO Agreement. The agreement imposed a temporary moratorium on unregulated commercial fishing in the CAO until the effects of climate change on fisheries are better understood and science-based management is in place (Rayfuse 2019). Most studies on climate and fisheries in the Arctic have concentrated on the effects of Arctic warming on marine ecosystems (Haug et al 2017, Holsman et al 2018) or resource stocks (Cheung et al 2010, Hollowed et al 2013, Barbeaux and Hollowed 2018, Gullestad et al 2020, Holsman et al 2020), but few studies have analyzed the changes in fishing activity per se. The recent release of a high-resolution global database of fishing activity based on the automatic identification system (AIS) mounted on individual fishing vessels (Kroodsma et al 2018) provides a unique dataset for analyzing how global warming and fishery regulations could change the behavior of fishing vessels and thereby the spatial distribution of pressures on marine ecosystems worldwide.
Here, we utilize the Global Fishing Watch (GFW) database to investigate how fisheries expand poleward as previously ice-covered areas become accessible. Our objective is to quantify the ongoing response of Subarctic fisheries to sea ice losses and project climate driven scenarios for expansion into High Arctic ecosystems. Our study area is the Arctic and Subarctic seas, limited by the 7 °C isotherm. We first show how fishing activity covaries with sea surface temperature (SST) and sea ice concentration and identify the dominant type of fishing gear. Secondly, we analyze how fishing activity responds to interannual changes in sea ice concentration. Thirdly, we combine SST, sea ice and bathymetry observations to build a statistical model of the recent observed distribution of fishing activity. We apply this statistical model to develop climate driven scenarios of fishing activity during a period with a warmer, less ice-covered and more accessible Arctic Ocean from a reference period (1982–2011) to a future climate scenario (2040–2060). Finally, we use the model to estimate the expected amount of avoided current and future trawling activity in three recently established fishery management areas.
2. Methods
2.1. Time periods and study area
Fishing activity data from GFW were available for the period 2013–2018. We used environmental variables to hindcast the fishing activity to a reference period (1982–2011) and climate predictions from 12 Coupled Model Intercomparison Project Phase 6 (CMIP6) models to predict the fishing activity under a future climate scenario (2040–2060). All data were aggregated to a common 25 × 25 km2 polar stereographic grid (NSIDC grid, see https://nsidc.org/data/polar-stereo/ps_grids.html). The study area was limited to the area where the annual average SST during the reference period was less than 7 °C.
2.2. Fishing activity
Fishing activity data are from GFW (https://globalfishingwatch.org). The methods for deriving the hours of fishing activity for each category of gear type from AIS data are described in Kroodsma et al (2018). The data were daily records from 2013–2018 and are indicated by hours of fishing on a 0.1 × 0.1 degree grid for the following fishing gears: trawling, purse seines, fixed gears (pots and traps, set gillnets and set longlines), drifting longline, squid and other fishing (pole and line, trollers and other fishing).
2.3. Catch data
To support the GFW dataset and to identify the most important target species and fishing methods, we compiled the catch data published by the Sea Around Us project (Zeller and Pauly 2015). Data from the 17 large marine ecosystems (LMEs) in the study area were downloaded from www.seaaroundus.org. Catch data from the most recent year (2014) are summarized in figure 1(C) and supplementary table S2 (available online at stacks.iop.org/ERL/16/074057/mmedia).
2.4. Environmental variables
Fishing activity is likely to be dependent on a series of environmental variables constraining the fishing activity and affecting the distribution and abundance of the target stocks (Kroodsma et al 2018). Temperature and bottom depth are for example variables that are likely to impact the spatial distribution of the fish, while sea ice and bottom depth is likely to impact the fishing operations more directly. We compiled the following variables for the study area:
2.4.1. Sea surface temperature (SST)
Data are from the NOAA OI SST V2 High Resolution Dataset (Reynolds et al 2007). Daily data from 1982 to 2018 with a 0.25 × 0.25 degree resolution were obtained from NOAA/OAR/ESRL PSD, Boulder, Colorado, USA, and downloaded from their website at www.esrl.noaa.gov/psd/data/gridded/data.noaa.oisst.v2.highres.html.
2.4.2. Sea ice
Data are from Nimbus-7 SMMR and DMSP SSM/I-SSMIS Passive Microwave Data, Version 1 (Cavalieri et al 1996). Daily data of sea ice concentration (percent) on a 25 × 25 km2 stereographic grid were obtained for the period 1982–2018 from the National Snow and Ice Data Center from their website at https://nsidc.org/data/NSIDC-0051/versions/1.
2.4.3. Bottom depth
Data are depth in meters from 2 min gridded global relief data; ETOPO2v2. Data with a resolution of 2 × 2 min were obtained from the National Geophysical Data Center, NESDIS, NOAA, and downloaded from their web site at www.ngdc.noaa.gov/mgg/fliers/06mgg01.html. Depth was log10 transformed prior to the analyses.
2.4.4. Depth gradient
The gradient in bottom depth was calculated as the smoothed local standard deviation in bottom depth in the 5 × 5 matrix of grid cells around each focal cell.
2.5. Seasonality and temporal aggregation
The Arctic is characterized by strong seasonality, especially with respect to sea ice cover. We were primarily interested in the annual variation, and we therefore decided to average out the seasonal variation. Accordingly, for each grid cell, fishing activity was summed, and SST and sea ice were averaged over each year, yielding measures of annual fishing effort, SST and ice cover.
2.6. Climate scenario
To represent climate change, we used the ScenarioMIP SSP585 (O'Neill et al 2016) emission scenario as simulated in the CMIP6 model intercomparison project (Eyring et al 2016). One realization of the historic and SSP585 runs was taken from 12 CMIP6 models to form a multimodel ensemble. Specification of the 12 models is given in supplementary table S5. The change due to global warming is defined for each model as the difference between the averages from the years 2040–2060 and 2005–2025. The 21 year average was used to minimize uncertainties due to multiannual variability in the projected changes. The changes in the ensemble multimodel mean represent the global climate change for SST and sea ice concentration.
2.7. Analyses of the response of trawling activity to changes in ice concentration
For each grid cell, we calculated the changes in SST, sea ice cover and trawling activity for each pair of successive years (year 1, year 2) from 2013 to 2018 (e.g. (2013, 2014), (2014, 2015), ...). The dataset was restricted to observations where trawling activity was zero in year 1, and the absence (0) or presence (1) of trawling in the subsequent year (year 2) was used as a response variable in a generalized additive model (GAM) (Hastie and Tibshirani 1990, Wood 2017). The probability of trawling in year 2 given that trawling was absent in year 1 was modeled as a response to the initial environmental conditions (SST, sea ice, bottom depth and depth gradient) in year 1 and changes in environmental conditions (ΔSST and Δsea ice) from year 1 to year 2. The model specifications and results are shown in supplementary material table S3. The model showed impacts from the initial sea ice concentration and changes in sea ice concentration (supplementary table S3 and figure S1). To quantify the effect of changes in sea ice, we used the model to predict the probability of trawling in the subsequent year for a range of changes in sea ice concentrations for three different levels of initial sea ice concentrations. The bottom depth for the predictions was set equal to 300 m, and the depth gradient was set equal to the average gradient in the dataset (4.79).
2.8. Model for hind- and forecasting Arctic trawling activity
The presence (1) or absence (0) of trawling activity in a grid cell in the study area for each year from 2013 to 2018 was used as a response variable in a GAM (Hastie and Tibshirani 1990, Wood 2017) with depth, depth gradient, annual sea ice and SST as explanatory variables. The model specifications and results are shown in supplementary material table S4. To assess the predictive accuracy of the model within simulated time period, we excluded one year at a time from the analysis and used the resulting model to predict the excluded year. The predictive accuracy was calculated using the area under the receiver operating curve (AUC). We used the model to predict the distribution of trawling activity during the reference period (1982–2011), the recent period (2013–2018) and during the future climate scenario (2040–2060). Median annual SST and sea ice, in addition to bathymetry, were used as inputs for the models of the reference and recent periods, while the ensemble averaged SST and sea ice from CMIP6 models were used to project the trawling in the future climate scenario. To estimate avoided trawling activity (i.e. avoided land-use, sensu Dos Ribas et al (2020)) in recently established fishery protection zones, model predictions for the recent period and the future climate scenario were extracted and plotted for three fishery management areas; Arctic Alaska, CAO and northern Barents Sea (figure 1(A)).
3. Results
3.1. Commercial fishing in the Arctic
Trawling dominates the fishing activity in the Arctic (figure 2, supplementary tables S1 and S2), representing 66% of the fishing activity registered in the GFW dataset and 58% of the catch in the Sea Around Us dataset. Both datasets suggest that commercial fishing activity is negligible in the High Arctic but widespread in the adjacent Subarctic shelf ecosystems (see figures 1(C), (D) and supplementary table S2). The most important species targeted by the demersal fisheries are Alaska pollock, Atlantic cod, Pacific cod and haddock. Important species taken by the pelagic fisheries include Pacific herring, Atlantic herring, Atlantic mackerel and capelin. In addition, Northern prawns are important in the Western Atlantic and Pink and Chum salmon are important in the Pacific (supplementary table S2). Except for the Alaska pollock fisheries, bottom trawls and long lines dominate the gears used in the demersal fisheries. However, Alaska pollock, which is the largest fishery in the Arctic, is mainly taken by pelagic trawl, and the pelagic fishes are caught by purse seines and pelagic trawls. With respect to trawling, there is a mix between pelagic and bottom trawling, with pelagic trawling dominating in the pacific due to the dominance of the Alaska pollock fisheries, while bottom trawling is more common in the Atlantic.

Figure 2. Fishing activities in the Arctic as a function of sea ice concentration and SST. Mean annual fishing intensity ±1 standard deviation in the period 2013–2018 in areas with (A), different annual sea ice concentrations and (B), SSTs. The study area is shown in figure 1(A). Fishing intensity is defined as hours of fishing per km2, and is shown for trawling (red), fixed gear (green) and other fishing gear (yellow).
Download figure:
Standard image High-resolution imageCompared to the other fishing activities, trawling penetrates further into ice-covered and cold waters (figure 2). The fishing activity was highest in areas with low annual sea ice concentrations, decreased with increasing concentrations, and was near zero for sea ice concentrations above 50% (trawling) and 25% (other fishing gears) (figure 2(A)). For trawling, fishing effort was close to zero for SSTs close to the freezing point (−1.8 °C), increased to a maximum intensity at 4 °C–5 °C and decreased thereafter. Other fishing activities increased with increasing SSTs throughout the temperature range in the study area (figure 2(B)).
3.2. Response of trawling to changes in sea ice
Our statistical model (see section 2, supplementary table S3 and figure S1 for details) showed that trawling activity responded to interannual changes in environmental conditions, revealing a strong positive response of trawling to reduced sea ice concentrations (figure 3). The probability of trawling in the subsequent year was also dependent on the initial sea ice concentration, with the probability being higher under light than dense initial ice cover (figure 3). Thus, Arctic trawling activity increases more rapidly in the margins of the ice-covered Arctic Ocean, i.e. where the seasonal sea ice zone prevails, compared with the less accessible waters in the interior where perennial and denser sea ice cover dominates.
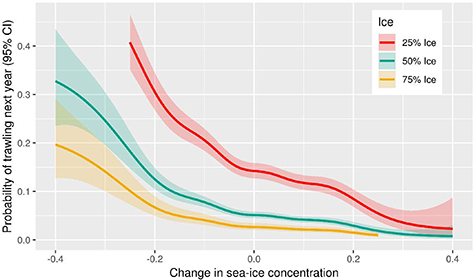
Figure 3. Trawling response to Arctic sea ice loss. Estimated probability of next year trawling in a non-trawled grid cell as a function of changes in sea ice concentration for three different levels of initial sea ice concentrations. The probabilities are predictions from an observational GAM model relating interannual changes in trawling activity to changes in environmental variables (see section 2 for specifications), and are shown as 95% confidence bands for 25%, 50% and 75% initial sea ice concentrations (red, green and yellow curves).
Download figure:
Standard image High-resolution image3.3. Hind- and forecast scenarios of trawling in the Arctic
Based on a model of the current trawling activity (2014–2018), we simulated the trawling activity in a hindcast scenario using the median sea temperature and ice concentration during a reference period (1982–2011) and in a forecast by projecting the trawling activity given the sea temperature and ice concentration under a future warmer climate scenario (2040–2060) (see section 2, supplementary table S4 and figure S2 for details). The model explained 39% of the deviance (adjusted R2 = 0.41) in current trawling activity. The predictive accuracy of the model was assessed by removing one year at a time from the analyses and then predicting the excluded year. The resulting AUC ranged from 0.972 to 0.978, suggesting a very high predictive accuracy (cf also figures 1(B) and 4(B)). The model predictions for the hindcast scenario, current situation and future scenario are shown in figures 4(A)–(C). Based on the model, we predicted an increase in trawling activity on the High Arctic shelves where diminishing sea ice cover is evident and where trawling is not limited by depth (figure 4). Most notably, the model shows that trawling expanded to the northern Barents Sea, Northern Bering Sea and Sea of Okhotsk, where trawling was previously limited by extensive sea ice (figure 4(D)) but is currently widespread (figure 1(C)). With further projected Arctic warming and sea ice loss, the climate scenario forecast increased trawling activity in major parts of the Arctic Ocean, including the Chukchi Sea, the Canadian Archipelago, Hudson Bay, Ungava Bay, the coastal areas of Newfoundland and Labrador, the Greenland coast and the Kara Sea (figure 4(E)). No increase was predicted in the central, deep Arctic Ocean. Trawling activity was forecasted to remain relatively stable in the current key fishing areas in the North Atlantic (Grand Banks, Iceland and Barents Seas) and in the Alaska–Bering sea region (figure 4(E)). Extracted distribution of model predictions for the three fishery management areas (figure 1(A)) are shown in figure 5. For Arctic Alaska, the predicted avoided trawling activity was moderate for the recent period but increased for the 2040–2060 climate scenario. In CAO, the avoided trawling activity was minimal in both time periods. For the Barents Sea the avoided trawling activity was relatively variable and large but did not differ between the two time periods.
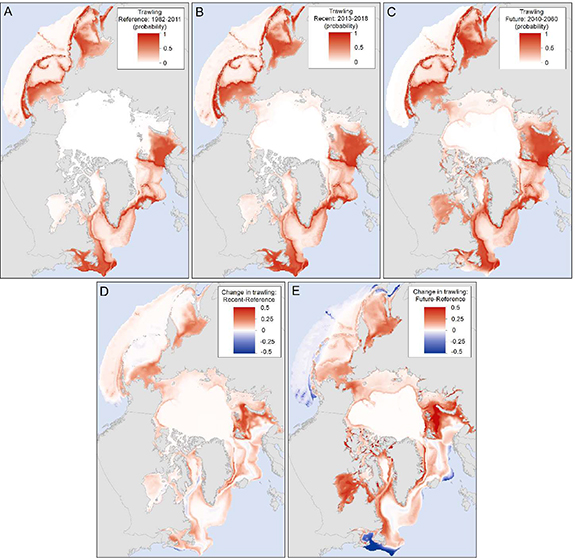
Figure 4. Projected climate-impacted development of trawling activity in the Arctic. Predicted trawling activity during (A), the reference period 1982–2011, (B), the recent period 2013–2018, and (C), a future climate scenario 2040–2060. Trawling activity is given as the annual probability of trawling within a 25 × 25 km2 grid cell. The predictions are based on an observational GAM model using data from the recent time period (see section 2 for details). The difference in predicted probability between the recent and reference period is shown in (D), and the difference between the future climate scenario and the reference period is shown in (E).
Download figure:
Standard image High-resolution image
Figure 5. Avoided trawling activity in three fishery management areas in the Arctic. Avoided trawling is given as the predicted probabilities of trawling (median, interquartile (50%) range and 90% range) during the recent time period (2013–2018) and for a future climate scenario (2040–2060) within the fishery management areas in Arctic Alaska, CAO and the fishery management area around the Svalbard archipelago in northern Barents Sea (see figure 1(A)).
Download figure:
Standard image High-resolution image
4. Discussion and conclusion
We quantify how commercial fishing activities have increased in High Arctic marine ecosystems that have remained unexploited until now. Our results show that trawling, the dominant fishing activity, has increased substantially in areas previously covered by ice. Trawling expands as a rapid response to interannual sea ice loss, most notably in the regions less covered by sea ice (figure 3). Trawling activity was also limited by depth so that our model suggests that trawling is currently expanding into the High Arctic shelf areas (figure 4).
The spatial distribution of fishing activity is likely to be dependent on a range of environmental, regulatory and socioeconomic factors, including fishery regulations, government subsidies, infrastructure (e.g. fishery ports), development in the fish stocks and changes in the fish market and technology (see e.g. Kroodsma et al (2018)). The predictions from the statistical models (figure 4) represent climate driven hindcast and forecast scenarios in fishing effort. Accordingly, they demonstrate the possible effects of climate change on fishing activity when other variables are kept constant and equal to the average of recent conditions. Though simple, the model had a high predictive accuracy (AUC > 0.95) and explained a relatively large proportion of the spatial variance in trawling activity (39% of deviance explained). It is however important to note that the hind- and forecasts produced by the model (figure 4) do not take into account factors such as the fluctuations or range expansions of major fish stocks (e.g. Fossheim et al (2015)), or changes in regulatory frameworks such as the 2009 closing of commercial fisheries north of the Bering Strait in Alaska EEZ (Stram and Evans 2009), the 2018 CAO Agreement (Rayfuse 2019), or the 2019 spatial fisheries restrictions implemented in the northern Barents Sea (Jørgensen et al 2020). The difference between the hindcast and current trawling intensity (figure 4(D)), can be used to identify areas where the current trawling activity would have been limited by previous sea-ice conditions. Moreover, the difference between the forecast and current trawling activity (figure 4(E)), can be used to identify areas where the current trawling activity could expand due to future climate warming. In other words, the model can be used to identify areas where fishery management actions could be effective in avoiding future climate induced increase in trawling activity (figure 5). For example, the model suggests that a climate driven increase in trawling activity in Arctic Alaska can be prevented by a continuation of the present management regime. Furthermore, according to the model, the 2018 CAO Agreement will have little effect with respect to avoided trawling impact, while the recent fisheries restrictions in the northern Barents Sea will have large but spatially variable impact.
The GFW dataset does not separate pelagic (midwater) trawling from trawling near or on the seabed (bottom trawling). This distinction is important because bottom trawling, in contrast to pelagic trawling, is expected to disturb the seabed habitat. Except for the Alaska pollock fishery, the catch data compiled by the Sea Around Us project (Zeller and Pauly 2015) suggest that bottom trawling dominates in the fishery of demersal fishes. Alaska pollock is caught by pelagic trawl while the pelagic fishes are caught by purse seines and pelagic trawls. The trawling signals in the GFW database do therefore represent a mix of pelagic and bottom trawling, with pelagic trawling dominating in the Bering-Alaska region due to the dominance of the Alaska pollock fisheries, while bottom trawling is more common in the North Atlantic. Bottom-contact fishing gears are considered the most widespread anthropogenic source of direct disturbance to the seabed and its associated biota (Sciberras et al 2018). The impact depends on the fishing gear and is more severe in previously untrawled areas with low levels of natural disturbances (van Denderen et al 2015, Hiddink et al 2017). In general, bottom trawling impacts the seabed habitat by resuspending and disturbing the sediments (O'Neill and Ivanović 2016), reducing the abundance and diversity of macrobenthos (McConnaughey et al 2000, Buhl-Mortensen et al 2016), selecting communities dominated by small short-lived species (van Denderen et al 2015, Hiddink et al 2019), and producing carrions for scavengers (Kaiser et al 2000). As the strong pelagic-benthic coupling and high biomass and diversity of macrobenthos that characterizes the High Arctic shelf ecosystems relies on the presence of sea ice (Wassmann and Reigstad 2011, Grebmeier 2012), this biota is likely to be particularly susceptible to disturbances from demersal fishing gear in a warming climate with retreating sea ice (Christiansen et al 2014, Jørgensen et al 2019, 2020). The rapidity of the responses of fisheries to sea ice retreat also suggest that the challenges to fisheries management caused by climate induced shifts in fish stock distributions across EEZ boundaries (Gullestad et al 2020) may occur rapidly, underlining the need to build capacity in governance structures.
While the net effects of the recent and projected increase in trawling in pristine Arctic waters on benthic communities is largely unknown, it must be assessed in the light of increased pressure from a rapidly changing climate as well as invading species (Jørgensen et al 2019). The observed and predicted increase in trawling activity is taking place within the EEZs of the Arctic states and is not covered by the recent CAO Agreement. A recent global analysis has documented that effective science-based management is instrumental to achieve sustainable fisheries (Hilborn et al 2020), underscoring the importance of Arctic fisheries management to also be based on 'area-appropriate fisheries science recommendations and management tools'. Given the generally robust governance of the Arctic coastal states, achieving a sustainable fisheries management regime under climate change seems like a realistic aspiration (Hoel 2020). Accordingly, the responsibility for documenting and eventually curbing the detrimental effects through effective management actions lies within the five Arctic coastal states. Such management actions would include spatial restrictions with respect to demersal trawling, as recently implemented in the northern Barents Sea (Jørgensen et al 2020) or the banning of commercial fishing activity in Arctic waters in Alaska (Stram and Evans 2009). We conclude that vulnerable Arctic ecosystems, which are already impacted by multiple stressors, are rapidly facing another major threat: trawling, in a warmer, more accessible Arctic.
Acknowledgments
We thank the World Fishing Watch for the fishery data; the National Snow and Ice Data Center for the sea ice data; the National Oceanic and Atmospheric Administration (NOAA) for the SST and bathymetry data; and the CMIP community for providing the climate model data. Funding: The work of P F and V H H was supported by the Research Council of Norway/Belmont Forum (RCN 247474) and the Fram Centre Research Flagship MIKON. The work of P A, E O and P F was supported by the Research Council of Norway (RCN 288192). The work of S L was supported by the Research Council of Norway (RCN). The work of J B D was supported by the Research Council of Norway (RCN 254765) and internal funding from the Norwegian Meteorological Institute.
Data availability statement
All data needed to evaluate the conclusions in the paper can be obtained from the data repositories given in the text. R-scripts for performing the analyses may be requested from the authors.
The data that support the findings of this study are openly available at the following URL/DOI: https://globalfishingwatch.org/datasets-and-code/.
Author contributions
The main idea was developed by P F in collaboration with V H H and E O Most of the text was written by P F, who also performed the data analyses. The climate scenario dataset was prepared by J B D. All authors contributed ideas, discussed the results and implications and contributed to the text.
Conflict of interests
The authors declare that they have no competing interests.