

Abstract
The intensification of crop production has been identified as one of the major drivers of environmental degradation. While significant advances could still be made with more widespread adoption of sustainable intensification technologies that address the agronomic efficiency of nitrogen fertilizers, the dynamic use of agricultural land across seasons and associated crop-specific responses to fertilizer applications have so far been largely overlooked. This paper explores the potential for improving the economic-environmental performance of crop production through spatially integrated modeling and optimization, as applied to Bangladesh. Results show that per-billion-Taka nitrogen loss from soil would decline by 83% from the baseline level through factoring in crop-specific, seasonal and spatial variations in crop nitrogen-use efficiency and nitrogen transport. The approach should complement other policy analysis and decision-support tools to assess alternative options for maximizing the positive outcomes of nitrogen fertilizers with regard to farm income and food security, while maintaining environmental sustainability.
Export citation and abstract BibTeX RIS

Original content from this work may be used under the terms of the Creative Commons Attribution 4.0 license. Any further distribution of this work must maintain attribution to the author(s) and the title of the work, journal citation and DOI.
1. Introduction
Improvements in nitrogen-use efficiency—that is, the fraction of nitrogen input harvested as product—in crop production are critical for addressing the triple challenge of food security, environmental degradation, and climate change (Sutton et al 2013, Zhang et al 2015). Such improvements depend not only on technological innovation and farm management, but also on socioeconomic planning and policies that remain poorly understood. This study examines the extent to which societal outcomes can be improved through addressing optimal crop choices and cultivated areas intra-annually and spatially. Long-term trends in many areas are encouraging intensification of capital inputs, including chemical fertilizer use (Jayne et al 2019). Yet nutrient pollution presents various environmental threats, affecting water quality, air quality, greenhouse gas balance, ecosystems and biodiversity, and soil quality (Sutton et al 2013). The unintended costs to the environment and human health have been substantial (Vitousek et al 2009). Excess nitrogen in water bodies, in particular, can cause coastal and freshwater dead zones, hypoxia, fish kills, and algal blooms, and contaminate drinking water, which can be harmful to young infants (Knobeloch et al 2000) or livestock (Carson 2000).
Much attention from academic scholars has been focused on integrated soil fertility management (ISFM), which improves the agronomic efficiency of fertilizer use and soil health, with reductions in nutrient runoff as an important side-benefit. But adoption of nutrient management, including ISFM, has remained challenging (Davidson et al 2015) and inadequate in many smallholder-farming areas (Tittonell and Giller 2013, Vanlauwe et al 2015). In promoting sustainable intensification (SI), there is no silver bullet technology or approach that will address all challenges. A national agricultural land use strategy that balances food security and environmental sustainability, as demonstrated in this study, offers an important complementarity to other efforts, such as those concerned with ISFM adoption.
The past several decades have witnessed substantial progress toward SI. Studies assessing SI projects across the world have illustrated the substantial potential for productivity improvement and reductions in agrochemical input use (see a review in Pretty 2018). Many factors can affect the environmental impact of fertilizer applications, including climate, hydrology, biological processing, and landscape characteristics such as geology, geomorphology, soil composition, and land cover (Donner and Kucharik 2003, Burt and Pinay 2005, Stuart et al 2014, Smith et al 2019). Yet two research gaps remain. First, most projects promoting SI have focused on farm- or landscape-level interventions (NRC 1989, 2010, Pretty et al 2006, 2011, Pretty and Bharucha 2015), whereas the role of nationally coordinated land use strategy remains largely understudied. Prior studies have explored spatially efficient nitrogen use/redistribution at the global (e.g. Liu et al 2010, Mueller et al 2014, 2017), and, to a smaller extent, national (e.g. Chen et al 2020, Jin et al 2020) scales. While optimized fertilization and changes in regional allocation of grain cropping areas are proposed as some of the potentially effective solutions (Chen et al 2020), no studies, as far as we know, have explicitly modeled these in a national optimization framework which accounts for food security and farmer income. Few studies considered seasonality in nitrogen-use efficiency analysis, a condition especially important for the (sub)tropical areas where the overwhelming majority of the so called 'Global South' countries are located or near. Analyzing historical patterns (1961–2011) of agricultural nitrogen use in 113 countries to demonstrate a broad range of pathways of socioeconomic development and related nitrogen pollution, Zhang et al (2015) conclude that, although much of the work pertaining to improving nitrogen-use efficiency must be done at the farm scale, there are important policies that should be implemented on national and multi-national scales. Second, while widespread adoption of SI practices is crucial, a science-driven national planning of crop choices and cultivation areas that balances the dual objective of food production and environmental integrity warrants attention.
This article sheds light on the importance of crafting a national strategy for planning crop cultivation across growing seasons and terrestrial locations to improve the environmental efficiency of fertilizer use at the national level while maintaining food production and output values. The analysis helps reveal the economic-environmental tradeoffs and opportunities in agricultural land use planning, and can inform policies that target environmentally sustainable food security.
2. Study background
Worldwide, agricultural production has increased sharply since the mid-20th century (Pretty 2018). Yet this period of agricultural intensification and expansion was accompanied by considerable harm to the environment (Government Office for Science and Foresight 2011, Goulson et al 2015, Rockström et al 2017, Stevens 2019), with planetary boundaries having already been exceeded for the nitrogen cycle (Rockström et al 2009, Steffen et al 2015). These trends are well exemplified in Bangladesh, one of the most densely populated countries in the world, with extremely limited land resources. In 2016, the country's per capita arable land was only a quarter of the global average, despite a steady increase in the total annual cultivated area, from 35.7 to 38.3 million acres (1 acre ≈ 0.405 hectares) between 2010 and 2017 (BBS 2011, 2019). The increase was primarily achieved through multiple harvests per year on the same plot. In concert with the increased cropping intensity was intensified chemical fertilizer applications. Nitrogen use per acre of cropland in Bangladesh was among the highest in 2017—twice that in the U.S.A. Yet nitrogen-use efficiency has been found to be low (Hossain et al 2005, Lassaletta et al 2014), raising concerns about the environmental sustainability of nitrogen application in the country.
An agricultural system is embedded in the dynamic flows and cycles of nature (Zhang et al 2018); farmed landscapes, like other types of terrestrial system, are connected to rivers and streams, and carry agricultural pollutant runoffs into water systems (Mekonnen and Hoekstra 2015). Hence, the timing and location of farming activities inescapably affect agriculture's environmental impact. Not only does nitrogen transport to water bodies present strong seasonal patterns (Lee et al 2012), but also crop cultivation decisions are highly seasonal. In Bangladesh, rice is the most important crop, with two to three harvests per year, accounting for ∼74% of the total cultivated area in 2018 (BBS 2019). But its seasonal price varies, due largely to different climatic conditions at harvest times affecting the moisture content and storability of rice in different ways (Ahmed and Bernard 1989, p 44). The cost of growing rice also differs from season to season. Bangladesh has a unimodal monsoon climate, bracketed by a hot-rainy summer and a dry mild winter. Irrigation cost is much higher in the winter (rabi) season than the summer (kharif) season (IFPRI 2016). With the current technologies, monsoon floods leave Bangladeshi farmers with fewer options for summer crops than in other seasons. Thus, rice becomes the predominant crop grown in paddy fields in summer (BBS 2018). Modeling seasonal heterogeneity in crop production is crucial to (sub)tropical countries where crops are typically cultivated more than once a year. Yet these seasonal variabilities have not been adequately addressed in a systematic way, representing a research gap in the literature.
3. Method and materials
This study develops a spatially explicit integrated modeling approach to fill the abovementioned research gap through seasonal and spatial reallocation of crop cultivation and adjustment of fertilizer application (figure 1). The modeling framework consists of (a) an econometric land use model, in this case a logistic form, for empirically examining the determinants of cultivated area for each of two main crop groups (rice and non-rice crops) for each of three cropping seasons—spring, summer, and winter; (b) a spatially explicit nutrient delivery ratio (NDR) model from the InVEST (Integrated Valuation of Ecosystem Services and Tradeoffs) model suite for assessing the impact of cropping intensity and fertilizer application rate on the disservice of nutrient runoff (Hamel and Guswa 2015, Sharp et al 2015, 2020), taking into account abiotic (e.g. elevation, slope, rainfall, and nitrogen fertilizer application rate) and biotic factors (e.g. vegetation type and crop intensity) affecting nutrient movement over land, where the NDR is the proportion of the applied fertilizer nutrient that runs off into waterways; (c) a seasonal-spatial optimization model to discover how to make crop area and fertilizer application rate choices that improve the environmental performance while maintaining agricultural revenue and food security. The mathematical optimization problem is characterized as one that minimizes the country's total nitrogen loss from soil across three crop growing seasons of a year through changing the nitrogen application rate and reallocating cultivation between rice and non-rice crops across seasons (and districts), subject to a set of economic and physical constraints concerning total annual output value, food security, and season-specific cropland availability.
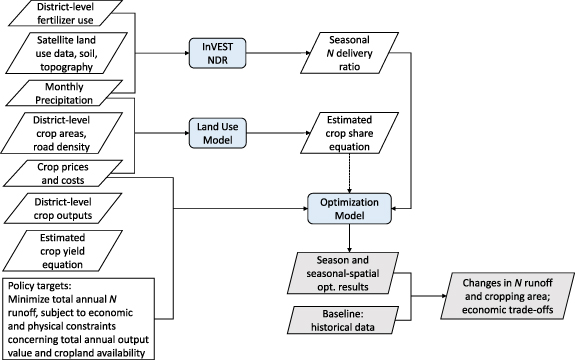
Figure 1. Workflow of the modeling approach.
Download figure:
Standard image High-resolution imageSpecifically, the NDR model of InVEST is the product of a delivery factor, representing the ability of downstream pixels to transport nutrient without retention, and a topographic index, representing the relative position of a pixel in the landscape. It produces a nutrient budget based on spatial representation of nitrogen sources, land cover and land use (LCLU) class-specific loadings and sinks (or 'retention', which represents the processes of denitrification or sediment trapping by a given land use type). Although the model can be used to simulate and evaluate the movement of multiple nutrient types such as nitrogen and phosphorus, this study will focus only on nitrogen which is largely used to promote agriculture productivity. The NDR model calculates the total nitrogen load from both anthropogenic sources (e.g. fertilizer applications) and natural ones (e.g. rainfall) for each pixel, and the amount of nitrogen retained by vegetation and topographic features and eventually delivered to water outlets, i.e. nitrogen output. The pixel-level outputs are then aggregated to the district level. For each growing season, the model assesses: total nitrogen load, nitrogen retained by vegetation and topographic features, and nitrogen delivered to the water outlet for each district.
Based on the season-, location-, and crop-specific relationships estimated from the land use and NDR models, we numerically simulated three alternative scenarios. First, a seasonal optimization, where farmers in each district would not be worse off financially; the optimization is solved across seasons within each district by choosing nitrogen application rate and cultivated areas of rice and non-rice crops. Second, a seasonal-spatial optimization where the country's farmers as a whole would not be worse off financially; the optimization is achieved across seasons and districts by choosing the same two sets of choice variables. Third, an integrated optimization which, instead of reallocating crop areas as specified in the seasonal-spatial optimization, endogenizes crop areas as functions of crop net prices, where the crop area functions are the outputs of the land use model and net price is price minus total production cost per unit production output; 3 this optimization is achieved across seasons and districts by choosing nitrogen application rate and net prices of rice and non-rice crops. The third scenario illustrates how the government can use price instruments to guide crop reallocation in order to improve the economic-environmental performance of crop production. All three scenarios are contingent on a food security constraint, assuming that the nation's total rice production would be maintained at least at the 2017 baseline level. 4 This condition ensures that national food security is not compromised as a result of the environmental initiative. The simulation analysis allows for identifying sources of inefficiency in nitrogen fertilizer use, helping shed light on the directions that hold potential to deliver improved outcomes for both food security and environmental sustainability. More details about the modeling framework and parameterization are provided in the supplementary materials (SM) (available online at stacks.iop.org/ERL/16/074046/mmedia).
The primary sources of data for the land use model are various statistical yearbooks published by the Bangladesh Bureau of Statistics (BBS). We compiled highly detailed district-level area of physical cropland and season-wise planting area and production quantities of 86 crops, including cereals, oilseeds, spices and condiments, fibers, vegetables, fodder, and fruits for the year 2013 and 2017 (BBS 2016, 2019). These detailed crop data are crucial in identifying temporarily idle cropland in each growing season and subsequently capturing the evolution of cropping intensity. 5 We compiled district-wise length of road in 2013 and 2017 to measure the market accessibility to a given area (BBS 2013, 2018). Precipitation data were obtained from the Climate Hazards group InfraRed Precipitation with Stations (Funk et al 2015). The NDR model uses three types of input data: (a) the LCLU datasets (Tang et al 2019), (b) geospatial attributes at various spatial resolution including elevation (Fick and Hijmans 2017), precipitation (Funk et al 2015), and fertilizer application (IFPRI 2016), and (c) tabular datasets drawn from the literature and existing database (see more details about the NDR data in section S1.2 of the SM).
4. Results
4.1. Land use model
Table 1 shows the estimated marginal effects of crop net price change, road density change, and precipitation change on the share of rice and non-rice crop areas in each season across districts, where the marginal effects are evaluated at the sample means of the data. Land use for rice and non-rice crops increases with their own net price, and decreases with the net price of the competing crop class—except the spring rice price and summer non-rice price. On average, the net prices of winter rice and non-rice crops increased by 3.90 and 1.14 Taka kg−1, respectively. In winter, a 1 Taka kg−1 increase in the net price of rice increases the share of rice area (as a percentage of total cropland area) by ∼9.31 percentage points and decreases the share of non-rice crop area by ∼8.56 percentage points in a district (cols. 5 and 6); a 1 Taka kg−1 increase in the net price of non-rice crops reduces the share of rice area by ∼6.70 percentage points and increases the share of non-rice crop area by ∼6.97 percentage points (cols. 5 and 6). Similar effects of net price changes are observed for summer rice and spring non-rice crops, but their magnitudes are much smaller than those of winter crops. The discussion about the effects of road density and precipitation change are provided in section S2 of the SM.
Table 1. Estimated marginal effects of variables on rice and non-rice crop area shares as percentages of total cropland area.
| Spring | Summer | Winter | ||||
|---|---|---|---|---|---|---|
| Rice | Non-rice | Rice | Non-rice | Rice | Non-rice | |
| Variable | (1) | (2) | (3) | (4) | (5) | (6) |
| Rice net price change (per 1 Tk kg−1 increase) | −0.36 | 0.06 | 1.39** | −0.57** | 9.31*** | −8.55*** |
| (0.28) | (0.06) | (0.63) | (0.27) | (2.34) | (2.79) | |
| Non-rice net price change (per 1 Tk kg−1 increase) | −0.13** | 1.82** | −0.24 | 0.30 | −6.70*** | 6.97*** |
| (0.06) | (0.84) | (0.60) | (0.78) | (2.44) | (2.68) | |
| Road density change (per 1 meter acre−1 increase) | −0.01 | 0.06 | 0.76** | 0.32* | −0.25 | 0.19 |
| (0.10) | (0.14) | (0.33) | (0.17) | (0.67) | (0.66) | |
| Precipitation change (per 100 mm increase) | 0.01 | 0.04*** | −0.01 | −0.005 | −2.13*** | 2.29*** |
| (0.01) | (0.01) | (0.03) | (0.01) | (0.73) | (0.71) | |
Note: Marginal effects are the partial derivatives of crop area shares with respect to various explanatory variables (see eq. S7a and S7b in the SM). Marginal effects are estimated based on the coefficient estimates of a system of six land use equations as specified in cols. 5 and 6 of table S3, and are evaluated at the sample means of the data. Explanatory variables in this specification include season-crop-specific net price change, road density change, precipitation change, and deviation of season-crop-specific initial share from initial share of idle use. Standard errors in parentheses are estimated using the delta method (Greene 2003, pp 70–71). *, **, and *** indicate statistical significance at the 10, 5, and 1% levels, respectively.
4.2. InVEST NDR model
The NDR model results show strong seasonal and spatial variations in the nitrogen delivery ratio (hereafter NiDR) and highlight the potential to seek improvement in the economic-environmental performance by optimization (figure 2), where the NiDR indicates the ratio of nitrogen export from soil to nitrogen loaded to soil. Variations in the quantity and timing of precipitation can influence nitrogen delivery (Breuer et al 2008, Hamel and Guswa 2015). Bangladesh has a tropical monsoon-type climate, with the heavy rainfall from June through October. The winter is dry, with less rainfall from October to March. Northeastern Bangladesh, for instance, receives the greatest rainfall because of its location in the foothills of the Himalayas. The strong rainfalls in the spring and summer seasons lead to high NiDR in this region, since nutrients (especially nitrogen, which can quickly dissolve in the water) are less likely to be held by the soil and plant. The NiDR shows lower values in the winter because less rainfall is observed.

Figure 2. Nitrogen delivery ratio by season (2017). Source: Authors' calculation using the InVEST-NDR model.
Download figure:
Standard image High-resolution imageRelatively high NiDRs are also observed for the southeastern region, where few croplands and a low fertilizer application rate are observed, but the slope is higher compared to other regions in Bangladesh. Since the NiDR is defined by nitrogen exports divided by nitrogen loads, the NiDRs are sensitive to the denominator. In addition, the spatial distribution of land use and land use intensity is one of the key determinants of NiDR (Heathwaite et al 2005, Harmel et al 2006, Pärn et al 2012). The differences in fertilizer applications among the three growing seasons also contribute to the distinct spatial patterns of NiDR in the country. Furthermore, the land use types and intensity also influence the nutrient retention efficiency, which will lead to spatial heterogeneities of NiDR distribution, as presented in figure 2.
4.3. Optimization model
Three key national-level results emerge from the optimization analysis (table 2). First, there is an opportunity of substantial improvement in the economic-environmental performance of crop production through optimizing seasonal allocation of crop cultivation and nitrogen fertilizer use, where the economic-environmental performance is measured by the volume of nitrogen export per billion Taka of agricultural output value (namely, nitrogen export intensity or NEI). The NEI would decline by 80% from the baseline level of 75.7 to 15.1 tonne billion Taka−1 under the seasonal optimization where both crop area and nitrogen input are allowed to be chosen (col. 4), and would drop further to 12.9 tonne billion Taka−1 (by additional 3%) when spatial reallocation is considered (col. 5).
Table 2. A comparison of the national-level results between the baseline and optimization model under various constraints.
| Seasonal opt. | Seasonal-spatial opt. | Integrated opt. | ||||
|---|---|---|---|---|---|---|
| Baseline | N | Area | N and area | N and area | N and Δp | |
| Decision variable | (1) | (2) | (3) | (4) | (5) | (6) |
| Total output value (billion Tk) | 1410.8 | 1523.9 | 1414.1 | 1416.7 | 1410.8 | 1438.0 |
| Total rice production (megatonne) | 35.9 | 35.9 | 35.9 | 35.9 | 35.9 | 36.2 |
| Total N export (kilotonne) | 106.8 | 57.2 | 67.5 | 21.3 | 18.2 | 33.5 |
| Spring rice | 11.5 | 5.2 | 1.6 | 2.2 | 2.3 | 2.1 |
| Summer rice | 34.0 | 22.9 | 19.2 | 2.7 | 1.6 | 11.0 |
| Winter rice | 37.0 | 12.7 | 37.5 | 10.6 | 10.4 | 10.5 |
| Spring non-rice | 10.2 | 5.2 | 5.6 | 2.4 | 2.4 | 2.7 |
| Summer non-rice | 3.4 | 2.2 | 0.2 | 1.8 | 0.2 | 1.9 |
| Winter non-rice | 10.7 | 9.0 | 3.3 | 1.6 | 1.3 | 5.3 |
| N export intensity (tonne billion Tk−1) | 75.7 | 37.5 | 47.8 | 15.1 | 12.9 | 23.3 |
| Total N inputs (kilotonne) | 560.2 | 334.8 | 397.4 | 124.6 | 111.5 | 174.2 |
| Spring rice | 55.8 | 30.9 | 9.3 | 13.7 | 13.0 | 10.6 |
| Summer rice | 174.1 | 126.2 | 113.4 | 16.3 | 11.5 | 56.2 |
| Winter rice | 184.3 | 76.6 | 210.5 | 61.7 | 62.8 | 53.6 |
| Spring non-rice | 64.7 | 34.4 | 38.7 | 16.8 | 17.7 | 15.9 |
| Summer non-rice | 20.8 | 12.7 | 1.6 | 9.2 | 1.1 | 10.7 |
| Winter non-rice | 60.6 | 54.0 | 23.8 | 6.9 | 5.4 | 27.2 |
| Total cultivated area (million acre) | 43.6 | 43.6 | 38.8 | 31.1 | 27.9 | 43.5 |
| Spring rice | 2.7 | 2.7 | 1.1 | 3.4 | 3.2 | 2.7 |
| Summer rice | 14.0 | 14.0 | 10.7 | 4.1 | 2.9 | 14.0 |
| Winter rice | 12.0 | 12.0 | 14.7 | 15.4 | 15.7 | 13.4 |
| Spring non-rice | 4.0 | 4.0 | 4.0 | 4.2 | 4.4 | 4.0 |
| Summer non-rice | 2.7 | 2.7 | 4.3 | 2.3 | 0.3 | 2.7 |
| Winter non-rice | 8.2 | 8.2 | 4.2 | 1.7 | 1.4 | 6.8 |
Note: Season opt. is referred to as an optimization solved across seasons within each district; seasonal-spatial opt. is referred to as an optimization solved across seasons and districts; integrated opt. is referred to as an optimization by embedding the crop share equations estimated by the land use model in the seasonal-spatial optimization and thus the optimization is also achieved across seasons and districts. Specifically, column 2 corresponds to the optimization results only by changing nitrogen application rates (N); column 3 corresponds to the optimization results only by reallocating cultivation between rice, non-rice, and fallows (Area); columns 4 and 5 correspond to the optimization results by changing both nitrogen application rates and crop cultivation areas; column 6 corresponds to the optimization results by changing nitrogen application rates and net price changes of rice and non-rice crops (Δp). All optimizations are contingent on two inequality constraints as reflected in the first two rows (total output value and total rice production). N export intensity is the ratio of total N export to total output value.
Second, the NEI reduction under seasonal optimization (as compared to the baseline) is further broken down into the reduction from changing nitrogen application rates and the reduction from reallocating cultivation between crops. The NEI would decline by 50% from the baseline when only per-acre nitrogen input is optimized (col. 2), and by 37% if only crop cultivation area is optimized (col. 3). 6 This result suggests that a greater extent of economic-environmental inefficiency stems from inefficient use of nitrogen fertilizer than misallocation of rice and non-rice crops.
Third, when integrating the land use model with the optimization simulation, and thus allowing prices to drive the optimization solution, the economic-environmental improvement is not as large as the case in which crop cultivation areas are optimized. Specifically, under integrated optimization, the NEI would decrease by only 69% (col. 6) from the baseline as compared to 83% in the seasonal-spatial optimization. While price may serve as a policy instrument to incentivize crop reallocations, there are limitations with respect to its effect. An increase in the price of winter rice, for instance, would increase the cropping area of winter rice while reducing the cultivated area of winter non-rice crops which compete with winter rice for the limited arable land. As such, the price effect is composed of both direct and indirect effects, which jointly drive the outcome. Moreover, the cultivations of spring crops are only responsive to price change of spring non-rice crops, whereas the cultivations of summer crops are only responsive to price change of summer rice (table 1). These complex relationships between crop prices and cropping areas impose constraints on the effect of using a price instrument.
Breaking down optimization analysis results by season-crop combinations allows a comparison of the optimization results with the baseline, and shows the type and degree of nitrogen use inefficiency in the baseline (figure 3) and whether there is any potential to improve the economic-environmental performance of crop production in each district (figure 4). Below is a discussion of the results by scenarios of optimization analysis.
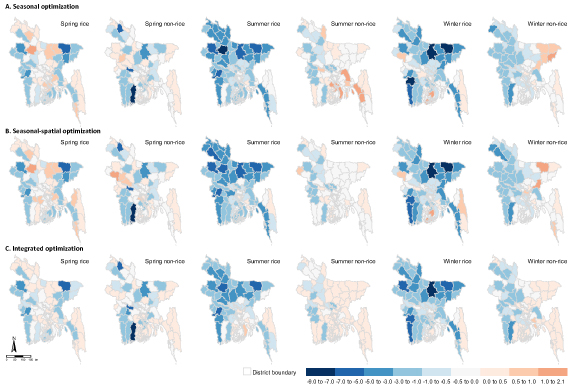
Figure 3. Changes in district nitrogen load (kilotonne) from the baseline under the three scenarios of optimization.
Download figure:
Standard image High-resolution image
Figure 4. Changes in district crop area (1000 acres) from the baseline under the three scenarios of optimization.
Download figure:
Standard image High-resolution image
In a number of districts, the baseline nitrogen use for spring crops and summer non-rice crops is below the seasonal optimization level, whereas the baseline nitrogen use for summer rice and winter crops is excessive (panel A, figure 3). Previous studies show that substantial disparities in the world's nitrogen balance remain (Houlton et al 2019), with developed nations having benefited greatly from advanced nitrogen fertilizer technologies (and in some cases are using them excessively), while many subsistence farmers in parts of Africa, Asia, and Latin America continuing to suffer from inadequate access to nutrient inputs (Vitousek et al 2009, Austin et al 2013). The present analysis of Bangladesh shows that disparities in nitrogen inputs even prevail across crops and growing seasons within the country. There is little potential for improving the economic-environmental performance of summer rice and winter non-rice crops. These two season-specific crops lack comparative advantage in improving the NEI in most districts after optimization, due to either higher NiDRs (figure 2), or less sensitive response of yield to nitrogen input (figure S4 and table S6 of SM). 7 or both. Therefore, the seasonal optimization results in decreased cultivated areas of these two crops in most eastern, and some western, districts (panel A, figure 4). In contrast, the economic-environmental performance is poised to improve by adjusting the baseline nitrogen usage of spring and winter rice in the direction of the optimization scenarios. The elimination of the inefficient use of nitrogen would reduce costs without impacting yields, leading to a significant increase in the cultivated area of these two crops (panel A, figure 4).
When crop production is allowed to be reallocated across districts, summer rice in most districts and spring rice in some western districts make little contribution to improving the economic-environmental performance. Consequently, the cultivated areas of the two crops decline after optimization (panel B, figure 4). Optimization results are qualitatively consistent with those from the seasonal optimization for other season-crop combinations.
Different from the seasonal-spatial optimization, the baseline nitrogen input of winter non-rice crops is above the integrated optimization level in western and middle-western districts. Because winter crop cultivations are more responsive to crop price change—including own net price and each other's net price—than spring and summer crops (table 1), it is easier to reallocate the cultivated area of winter crops through price instruments. In contrast, the price effects of spring and summer crops are much smaller and even statistically insignificant. Consequently, we observe relatively large changes in the cultivation area of winter crops.
5. Discussion
Nitrogen is a critical component of the economy, food security, and planetary health, and many of the world's sustainability targets hinge on global nitrogen solutions (Houlton et al 2019). This paper combines modeling and optimization simulation analysis to explore the potential for abating country-level agricultural nitrogen pollution through alternative policy perspectives including season- and district-specific crop choices (rice vs. non-rice crops), crop areas, nitrogen application rates, and net prices. It demonstrates the utility of integrated ecological-economic modeling in informing policymaking on possible tradeoffs and opportunities for achieving environmentally sustainable food security. The approach proposed here relies on publicly accessible data, while the analytical framework has broad applicability for countries that are characterized by seasonal and spatial heterogeneity in crop mix and cropping practices, and are interested in achieving the dual goal of food production and environmental sustainability.
Consistent with the worldwide trend of increasing cropping intensity (Tilman et al 2011) and low efficiency of fertilizer use (Jayne et al 2019), nitrogen use inefficiency is pervasive in Bangladeshi agriculture, constituting a major source of excess agricultural runoff across the country. Meanwhile, there is substantial potential to improve the environmental performance of agriculture by reexamining crop cultivation and allocations (between rice and non-rice crops) across seasons and locations. Summer crops and winter non-rice crops have less scope for improving economic-environmental performance. To achieve SI, a critical entry point is to improve our understanding of where the current inefficiencies are and where major levers may lie. This study sheds light into these questions, demonstrating that seasonal-spatial crop reallocation in national agricultural land use planning can potentially help address the inefficiencies in crop nitrogen supplements. Such 'top-down' perspective must go hand-in-hand with on-the-ground management practices such as ISFM, combined with the knowledge of how to adapt these practices to local conditions, aimed at long-term ecosystem health (Vanlauwe et al 2010). The challenge lies in the operationalization of the insights drawn from the exploratory optimization analysis. Yet it is beyond the scope of this paper to assess the feasibility of, conditions for, and possible unintended consequences of implementing the optimization results, which merit a whole different study. Nevertheless, policy makers increasingly need to design policies that address multiple objectives and they constantly face the challenge of balancing food security, environmental sustainability, economic viability, and political feasibility; our modeling framework presents a useful tool for conducting scenario analysis of alternative policy instruments.
The findings of this study show that seasonal optimization alone corrects almost all inefficiency in the use of yield-enhancing nitrogen that has negative environmental effect. This second-best solution could be more appealing to policymakers than the seasonal-spatial optimization, in which a slight improvement in efficiency gain comes at a non-trivial 'social' cost in terms of distributional effect: 30 of 64 districts would be financially worse off by a range of 0.176–30.9 billion Taka each year, despite that farmers as a whole at the national level are able to maintain their output value level (figure S10). Such 'revenue redistribution' is rarely politically palatable and additional measures are needed to address the economic inequity concern. This finding merits stakeholder consultation and policy discourse to explore ways in which potential opportunities such as supporting districts to implement disaggregation of fertilizer subsidy levels can be realized for improved economic-environmental performance. However, it is essential to recognize that agricultural pollutant runoffs into water systems often occur off-site. This means all districts would not have the same incentive to control pollution, and national pollution reduction goal would not be achieved unless most (if not all) districts participate in the scheme. Central government has a key role to play in coordinating and incentivizing districts to take due action.
Our explorative analysis provides useful insights into crop prices-oriented policy instrument to improve economic-environmental performance, illustrating an important tradeoff between economic-environmental efficiency gain and social equity loss. The Bangladeshi agricultural commodity sector is largely market-oriented and direct price interventions by government are unlikely. However, the government is keen to keep the prices of essential commodities within the purchasing power of the common people, and the measures they deploy can indirectly affect market prices (the measures include public procurement and distribution programs, public stocking and social safety net policies (Raihan 2014) to ensure that government can provide food to the poor in difficult times). For example, government declaration on public procurement volume target may influence the procurement behavior of major market players like millers, affecting mainstream market prices (Ahmed and Bakhtiar 2020). An important future research question is in what ways research insights like those drawn from the current analysis can help inform the central government in improving its coordination of districts on the seasonal-spatial allocation of crop areas and in creating incentives for districts to realign their crop cultivation toward the socially optimal levels, delivering better environmental performance while ensuring farmer income and social equity. Other policy instruments, such as fertilizer inputs subsidy, can also be analyzed in this modeling framework as new data and information become available. Researchers should also understand possible leakage or spillover effect of policy instruments using dynamic analysis tools.
The analysis admittedly relies on several assumptions. It is taken that other agricultural inputs remain unchanged in optimizations. This simplified assumption allows a focus on the relationship between fertilizer use, cultivated area, and crop production. It aggregates all non-rice crops in a single group and the estimated yield-nitrogen responses are representative of the observed composition of non-rice crops. Any change in this composition requires an adjustment of the yield-nitrogen response accordingly. The NDR outputs are translated into the district-specific nitrogen delivery ratio for each cropping season and it is assumed that this ratio measures the long-term nitrogen-use efficiency. In the absence of geo-referenced, crop- and season-specific land cover data layer, this NDR model is unable to differentiate rice from non-rice crops. The accuracy of the results can be improved by incorporating new data and targeted surveys and the modeling framework proposed here does not create obstacles to such an improvement. Nonetheless, the flexibility and transparency of this approach can increase decision-makers' trust in the results.
Acknowledgments
This work has been funded by the NASA-LCLUC South Asia program project NNX17AH95G titled 'Understanding changes in agricultural land use and land cover in the breadbasket area of the Ganges Basin 2000-2015: A socioeconomic-ecological analysis', and conducted in partnership with George Mason University. Wei Zhang is supported by the CGIAR Research Program on Water, Land and Ecosystems (WLE). Man Li is supported by Hatch Capacity Grant Project no. UTA-01510 from the USDA National Institute of Food and Agriculture.
Data availability statement
The data that support the findings of this study are available upon reasonable request from the authors.
Footnotes
- 3
The land use model is independent of the seasonal optimization and the seasonal-spatial optimization scenarios, but is embedded in the integrated optimization scenario by treating crop areas as functions of crop net prices. Crop net prices are thus the new choice variables in optimization. See more technical details in section S1.4 of the SM.
- 4
The baseline corresponds to the historical statistics of 2017, including crop areas, production quantities, crop prices, production values, and fertilizer applications. The year 2017 appears to be a 'normal' year for crop cultivated areas and yields given their past trends. The baseline district-level price data are extrapolated by combining the national-level annual price data from the BBS (2019) and the household-level price data for 2014 from the Bangladesh Integrated Household Survey (IFPRI 2016), assuming a constant price growth rate across the country and being averaged between 2016 and 2017.
- 5
The BBS does not report idle cropland area. Although we collected data on specific crops, we have to aggregate them in a single group representing the whole non-rice crops to avoid missing crop data in the estimation of the land use model, which requires balanced data for each district-season-crop observation. There are no other crops cultivated across all three seasons except rice.
- 6
The significant decline in total nitrogen inputs in column 3 is due to season crops with a low nitrogen use productivity being 'eliminated' from cultivation in the optimization (i.e. zero area solution to the optimization).
- 7
The effect of yield responses to nitrogen input is estimated using the household-level data on nitrogen fertilizer rates and crop yields from the Bangladesh Integrated Household Survey (IFPRI 2016).