

Abstract
The increasing production of manure is a challenge for livestock management systems as well as the global environment. Being traditionally, and still dominantly, used as fertilizers, land application of manure could preserve soil fertility and improve soil carbon sequestration. However, manure application also increases nitrous oxide (N2O) emissions that might outweigh the benefits of carbon gains. Here we quantify soil carbon change and greenhouse gas (GHG) emissions from corn production systems in the United States from a life-cycle perspective. We show that utilizing manure can reduce mineral fertilizers use, and therefore avoid GHG emissions that would otherwise occur due to mineral fertilizer production and application. As a result, corn produced under manure has a reduced intensity of GHG emissions (1.5 t CO2e ha−1 or 0.15 t CO2e t−1 corn grain), about 15% less than those under sole mineral fertilizers. Owing to a sizeable amount of avoided emissions counterbalancing N2O, the soil carbon gain derived from manure use can largely contribute to net climate change mitigation. It should be noted that GHG emissions estimation can be largely improved as more robust and recent data become available to better represent spatially specific land management and to integrate ecosystem models with life-cycle model. Future studies are merited to further assess the alternative fate of manure, and expand the system boundary to assess agriculture and livestock sectors holistically.
Export citation and abstract BibTeX RIS

Original content from this work may be used under the terms of the Creative Commons Attribution 4.0 license. Any further distribution of this work must maintain attribution to the author(s) and the title of the work, journal citation and DOI.
1. Introduction
The production of manure, one of the dominant animal wastes, has been increasing since the Industrial Revolution, especially during the past half-century (Zhang et al 2017, Powers et al 2019). In terms of nitrogen (N) excreted by livestock, current global annual manure production is estimated to be about five times greater than the amount in the 1860s (Zhang et al 2017). In the United States (U.S.), about 2.2 billion of cattle, swine and poultry generated approximately 1 billion metric tons (t) of wet manure excreted in 2007 (EPA (U.S. Environmental Protection Agency) 2013). Since the 1950s, livestock production in the U.S. has more than doubled and has led to an increased concentration of manure (EPA 2013). The increasing production of manure is believed to be mainly driven by the ever-growing human consumption of meat and animal products. This trend is expected to continue in the coming decades with growing human population if diet does not change drastically (Davidson 2009, Zhang et al 2017).
However, currently most manure is left unused, with only a small proportion being used mainly as crop fertilizer and soil amendment, and some limited use for energy (Potter et al 2010, Wu et al 2013, Zhang et al 2017). About 1/5 of global manure N was applied to cropland, of which 1/4–1/3 was used in Asia over the past one and a half centuries (Zhang et al 2017). In the U.S., about 1/4 of manure was used for crop production (mostly corn), but still only about 12% of planted corn areas received manure (USDA (U.S. Department of Agriculture) 2009). The use of manure as energy sources is still largely limited by scale (Qin et al 2015). Fertilizer use is still probably the most viable and economical path for large-scale manure utilization (Potter et al 2010, Zhang et al 2017).
Manure was a major source of nutrients for plant growth, N, phosphorus (P) and potassium (K), until mineral fertilizers started to dominate (Zhang et al 2017, Powers et al 2019). Even though manure has long been used as fertilizer in agriculture to enhance soil quality and maintain crop productivity, it is not clear whether manure application could offer any benefits of climate change mitigation relative to mineral fertilizers, in terms of net greenhouse gases (GHGs) emissions reduction. On the one hand, manure application in the field can also help soil to build up carbon (C) stocks, which creates potential for soil organic carbon (SOC) sequestration and GHG emissions mitigation (Smith et al 2020). It was estimated that, relative to mineral fertilizer, manure can accumulate about 26% more carbon in the top 30 cm soil. For each metric ton of cumulative manure C input, SOC stock increased an average of 0.12 t C ha−1 (Maillard and Angers 2014). Manure may generally enhance soil carbon stocks, but SOC response to specific manure application rate can vary spatially, depending on factors including local climate, soil and management practices (Qin et al 2018a). Improved management of manure is often required in order to co-deliver crop productivity and climate change mitigation (Davidson 2009, Paustian et al 2016, Smith et al 2020).
On the other hand, production of large quantities of manure could significantly contribute to anthropogenic emissions of nitrous oxide (N2O) (Davidson 2009), one of the major potent GHGs with a global warming potential about 265 times greater than carbon dioxide (CO2) (Myhre et al 2013). It is estimated that manure has been a major source of N2O emissions since 1860 (Zhang et al 2017). Manure production and management is the largest source of N2O emissions (2.8 Tg N2O–N yr−1), contributing 44% of global total N2O emissions (in 2000) (Davidson 2009). Manure production has become one of the biggest challenges to current climate change mitigation efforts (Davidson 2009, Herrero et al 2016, Zhang et al 2017). A recent meta-analysis study reported that manure applied in the crop field could stimulate soil N2O emissions, and increase overall emissions by 130% relative to application of mineral N fertilizer alone, which would negate 36.7% of net climate benefits resulting from SOC sequestration in uplands as a consequence of manure application (Zhou et al 2017).
Besides on-farm GHG emissions, it is equally important to understand off-farm activities that may also contribute to emissions associated with manure and mineral fertilizers (Wu et al 2013, Qin et al 2018a). Studies show that GHG emissions are not only from in-field post-application but also from fertilizer production (Kahrl et al 2010, Walling et al 2020). Many reported soil GHG emissions from an ecosystem point of view, focusing only on the manure use and its immediate emissions (Snyder et al 2009, Chang et al 2020). This approach may be able to compare manure and mineral fertilizers in terms of on-site emissions, but would inevitably overlook emissions associated with off-farm processes and the fact that manure could partially displace mineral fertilizers, and therefore avoid their emissions (Reay et al 2012, Zhou et al 2017, Qin et al 2018a). These off-farm processes include fertilizer production and logistics, and manure transportation (Kim et al 2009, Wu et al 2013). It is critical that we assess two comparative systems (manure vs. mineral fertilizers) holistically to better understand manure's role in the climate change context.
Here, we constructed a life-cycle framework to test the impacts of manure vs. mineral fertilizers application on overall GHG emissions in the U.S. typical corn (Zea mays L.) growing region. The analysis highlighted the additional life-cycle processes and GHG emissions when manure was applied with respect to a scenario where only mineral fertilizers were used. This study aimed to identify processes that affect corn's life-cycle GHG emissions under both manure and mineral fertilizer use scenarios, and to quantify manure's role in determining climate change mitigation potential.
2. Methods
2.1. Analysis system boundary
Life-cycle assessment (LCA) is a useful technique widely used to quantify environmental impacts throughout all the stages of a product's life. Corn's full life-cycle, namely cradle-to-grave process, normally refers to stages for corn farming and production, corn transportation (on-farm and off-farm), and corn use (sometimes conversion and use) (Kim et al 2009, Wu et al 2013). The whole life-cycle includes on-farm activities such as farming and management (e.g. planting, irrigation, harvesting), upstream activities associated with corn production (e.g. chemical and fertilizer production), and possibly downstream activities including corn transportation (from farmgate to users), conversion and use where applicable (e.g. ethanol production and end use) (figure 1). In this study, we investigated life-cycle GHG emissions associated with corn grain produced in typical corn-soy (Glycine max L.) rotation system in the conterminous U.S. (USDA 2015), with both off-farm upstream and on-farm processes specifically considered as within the system boundary (normally cradle-to-farmgate), while off-farm downstream processes were excluded (figure 1). Corn grain was treated as the only product delivered to the farmgate, and therefore carry all burdens of energy use and GHG emissions. Any further conversion or use of corn grain or stover (e.g. animal feed, ethanol production) can follow our analysis and specify additional downstream paths.
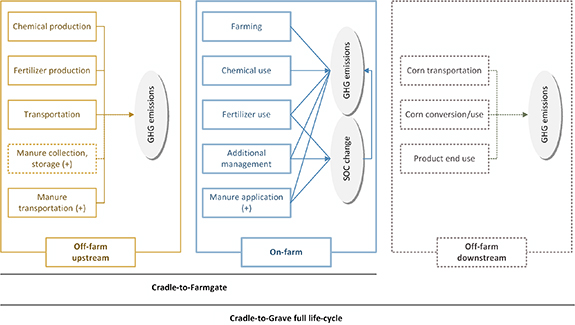
Figure 1. LCA boundaries for both on-farm and off-farm activities associated with corn life-cycle energy use and GHG emissions. (+) show processes related to manure use. Processes in dotted boxes indicated processes excluded from analysis.
Download figure:
Standard image High-resolution imageTwo life-cycle pathways were specifically included in the analysis to identify manure's net impacts on corn grain's GHG emissions, one without manure application (base scenario) and the other with manure related processes added into each applicable stage (manure scenario) (figure 1). Compared with manure left unused, any burdens (e.g. transportation) or credits (e.g. SOC gain) resulting from land application are attributed to the product (i.e. corn grain) of the pathway. In the analysis, additional processes, including manure transportation and on-farm application, were incorporated into the life-cycle of manure use (figure 1). Manure is treated as waste of livestock production and its collection and storage are regarded as part of animal farm activities attributed to livestock products regardless of manure use (Aguirre-Villegas and Larson 2017), and therefore emissions associated with livestock and manure storage are excluded from this analysis (figure 1).
For both pathways, state-level GHG emissions were estimated throughout the cradle-to-farmgate processes and compared on a per unit corn grain and per unit area basis using GHG emissions intensity indices. Process-based materials and energy flows and GHG emissions (CO2, N2O and methane) were estimated using parameters derived from the Greenhouse gases, Regulated Emissions, and Energy use in Transportation (GREET) model (Argonne National Laboratory 2019). GHG emissions due to changes of carbon stocks (i.e. soil) were modeled using a modified CENTURY model (Qin et al 2018a) to account for impacts of management (e.g. manure, fertilizer, tillage) on SOC.
2.2. Modeling SOC and GHG emissions
A well-documented CENTURY version was used to simulate SOC dynamics (0–100 cm) under specific management scenarios and formed the basis for GHG emissions accounting of SOC change in each pathway (Qin et al 2016a, 2018a). The model was parameterized and refined based on CENTURY and validated in the US cropping systems (Kwon and Hudson 2010, Kwon et al 2013). It was previously used to simulate SOC changes resulted from land use change and land management change for a variety of crops including row crops (e.g. corn, wheat and soy) and bioenergy crops (e.g. switchgrass, Miscanthus, willow and poplar) (Kwon et al 2013, Qin et al 2016a, 2018a, 2018b). In particular, a few land management practices including cover crops, manure application and tillage intensity were specifically modeled in agroecosystems to estimate potential impacts of changing management on soil carbon stocks (Qin et al 2015, 2018a). More details on recent model parameterization (Kwon et al 2013, Qin et al 2016a), simulation protocols (Qin et al 2015, 2018b), and model application on land use (Qin et al 2016a) and land management change (Qin et al 2018a) can be found elsewhere.
Specifically, in this analysis, SOC sequestration rates (SOCr) (i.e. annual changes of SOC stocks) were modeled at county-level and then weighted by corn area to reflect state-level SOC responding to specific management practices. The model runs by first spinning-up during the 1880–2010 period to establish a stable initial condition (Paustian et al 1992, Kwon et al 2013), and then simulating SOC dynamics over the next 30 years (2011–2040) to quantify SOC changes under either manure or mineral fertilizer scenarios. SOCr was determined as SOC change over the 30 years that capture most changes of SOC (Qin et al 2016b). Also, 30 year was chosen to be consistent with LCA time horizon used for corn biofuel studies (e.g. EPA) (Qin et al 2016a). In the model, two major driving factors, manure and tillage, were specifically simulated. State level manure application rates were based on the USDA Agricultural Resource Management Survey (ARMS) database (Qin et al 2015). Manure from different livestock types (e.g. swine, dairy cow, beef cattle and chicken) is applied every four years during the corn season (Qin et al 2018a). Three tillage types were included for both base and manure pathways, and modeled separately to reflect SOC changes responding to tillage intensity, conventional tillage (CT), reduced tillage (RT) and no tillage (NT). Corn stover removal rate was set at 30% (Johnson et al 2014, Xu et al 2019).
The overall GHG emissions accounted for CO2, N2O and methane (CH4) from upstream off-farm and on-farm materials and energy flows, including potential SOC changes. Relative to base scenario, manure scenario considered additional changes of GHG emissions due to manure transportation, manure application and potential changes resulted from fertilizer use reduction (figure 1). Manure produced by broiler chickens, turkeys, layers, beef cattle, swine, and dairy cows is included in the study, with beef cattle and dairy cows contributed the most (44% and 35% of total dry mass, respectively). With addition of nutrients from manure, the application rate of fertilizers would be reduced based on total mass of N, P and K made available to crops (Kellogg et al 2000, Qin et al 2015). The displacement of N, P and K differs by their respective ratio of nutrient availability, but all three types of fertilizers can be reduced due to manure use (Qin et al 2015). This could potentially reduce GHG emissions associated with fertilizer production and application. While spatially specific data for tillage types are not available at county level, a mixed ratio of tillage types (CT:RT:NT = 25:59:16) proposed in the recent GREET update (Qin et al 2018b) was used here to account for state and national average SOC change. For N2O and CH4, their global warming potentials (100 year time horizon) are 265 and 28, respectively (Myhre et al 2013). GHG emissions intensity was presented on the basis of corn yield and corn area. Detailed information on modeling inputs and parameters can also be found in GREET documentation (Qin et al 2015, 2018b) and earlier relevant studies (Qin et al 2016a, 2018a). The GREET model and associated data can be accessed free of charge at https://greet.es.anl.gov/. The SOC outputs from CENTURY can be obtained from CCLUB, an independent module in GREET analyzing SOC changes related to land use and land management (e.g. manure application) (Qin et al 2018b).
3. Results
3.1. Soil carbon sequestration
The SOC modeling results show that, across the US, soil generally gains carbon with 70% residue return, irrespective of tillage intensity and manure application (figure 2). Particularly, the rate of SOC gain in the middle states, especially the Midwest, is much higher than the eastern regions where both corn yield and area are relatively small. With decreasing tillage intensity, soil gains carbon at a faster pace with national rate of 0.08, 0.11 and 0.20 t C ha−1 under CT (figure 2(a)), RT (figure 2(b)) and NT (figure 2(c)), respectively, in base scenario. With addition of manure, soil accumulates even more carbon than the base scenario, about 90% higher in CT (figure 2(d)), 70% higher in RT (figure 2(e)) and 40% higher in NT (figure 2(f)), at state level.
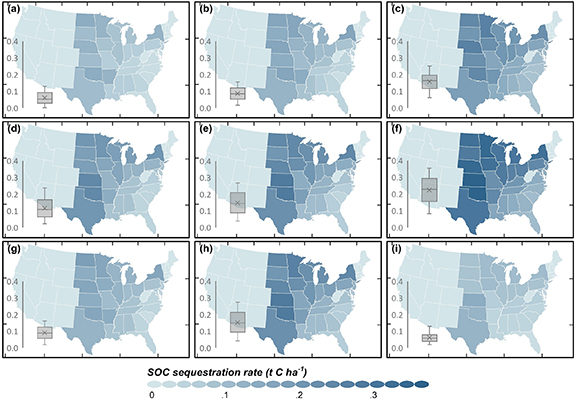
Figure 2. SOC sequestration rate (SOCr) responding to tillage intensity and manure application. The estimates (a)–(f) show state-level SOCr in corn fields without manure application under different tillage types, (a) conventional tillage (CT), (b) reduced tillage (RT), and (c) no tillage (NT), and with manure application under (d) CT, (e) RT and (f) NT. (g), (h) represented SOCr for US average tillage intensity (g) without manure application, (h) with manure application, and (i) the different between h and g. The positive values show net carbon gains in soil, and zeros indicate where corn-soy systems are not available. The box plot statistics: the bottom and top of the box are the first and third quartiles, and the band inside is the median. The cross is the arithmetic mean.
Download figure:
Standard image High-resolution imageOverall, the average SOC sequestration (weighted by area and tillage) with manure application (figure 2(g)) is 0.19 t C ha−1, about 60% greater than base scenario where only mineral fertilizers were applied (figure 2(h)). However, the absolute difference can be minimal in the eastern region (figure 2(i)) where manure supply is limited (EPA 2013) and application rate is relatively low (Qin et al 2018a).
3.2. GHG emissions
In all cases, croplands represent a net source of GHG emissions, regardless of location or fertilizer types. However, applying manure could slightly reduce overall GHG emissions, at both national and state levels (figure 3). With manure application, the average national corn GHG emissions is about 1.5 t CO2e ha−1 or 0.15 t CO2e t−1 corn grain (figures 3(b) and (e)), 15% lower than that with only mineral fertilizers applied (figures 3(a) and (d)). The state-level GHG emissions intensity, however, varies spatially. For states with larger amount of corn production, their emissions intensities also tend to be higher than those with less corn produced. The intensity in Illinois and Indiana is about three and four time of the lowest in New York for base (figures 3(a) and (d)) and manure scenarios (figures 3(b) and (e)), respectively. The differences mainly resulted from difference in mineral fertilizer rate. In the top five corn production states (i.e. Iowa, Illinois, Nebraska, Minnesota and Indiana), with relatively high GHG emissions intensity (figure 3), their nitrogen application rates are also among the highest. Applying manure could normally reduce about 3%–33% of GHG emissions, depending on where corn is produced. The percentage of reduction is not necessarily related to absolute GHG emissions intensity (figure 3(c)).

Figure 3. Life-cycle GHG emissions in corn cropping systems with and without manure application. The estimates reflected state-level emissions from cradle to farm gate associated with corn production using US average tillage. The GHG intensities were scaled by area (a), (b) and corn yield (d), (e). (a), (d) indicated base scenarios without manure application, while (b) and (e) for scenarios with manure application. (c) indicated state-level annual total corn farming GHG emissions in bar charts, with background map showing relative corn area by state. The box plot statistics are same as in figure 2.
Download figure:
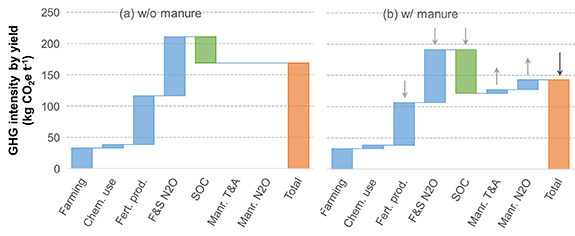
Standard image High-resolution imageThe reduction of GHG emissions with manure application is largely due to avoided emissions from reduced mineral fertilizers use and additional SOC gain (figure 4). With less N, P and K fertilizers applied, a sizable amount of GHG emissions (12%) associated with fertilizers production and application (e.g. N2O emissions) is avoided. This almost offsets GHG emissions contributed by manure transportation and on-farm N2O emissions, that is 13% at national average level. Additional SOC sequestration due to manure use could reduce another 16% of GHG emissions, resulting in a net 15% reduction at national level. Corn stover can generate additional N2O, but the amount is relatively small, and the size is the same in both base and manure scenarios. The manure induced additional N2O emissions could negate nearly 60% of the climate benefit due to SOC gain (figure 4), only if the GHG emissions were estimated from an ecosystem point of view, without considering an appropriate life-cycle system boundary (figure 1).
Figure 4. National average life-cycle GHG emissions. The cradle-to-farm gate emissions intensity were under US average tillage (a) without and (b) with manure application. Chemical use (chem. use) included uses of insecticides and pesticides. Fertilizer production (fert. prod.), manure transportation and application (manr. T&A), and N2O emissions from fertilizer and stover (F&S N2O) and manure applied into field (manr. N2O) were included separately.
Download figure:
Standard image High-resolution image
4. Discussion
Depending on system boundary, the impact of manure application on GHG emissions can vary significantly. By solely examining the soil carbon stocks, manure enhances SOC sequestration relative to mineral fertilizers only; in this respect, application of manure could be regarded as an improved cropland management practice (Maillard and Angers 2014). When accounting for nitrogen fluxes, manure application could increase microbial activity, facilitate denitrification and therefore stimulate soil N2O emissions (Hayakawa et al 2009), which could largely negate the climate benefits from SOC gains resulting from manure addition (Zhou et al 2017). A recent global review of experimental observations showed that with manure application, the additional N2O emissions could negate about 1/3 of the climate benefits from SOC gain in upland soils (Zhou et al 2017). In this sense, the potential of manure application for mitigating GHG emissions by increasing SOC storage is attenuated. Looking beyond soil and agroecosystem, our analysis adopted a systematic approach to evaluate life-cycle GHG emissions, accounting for off-farm and on-farm activities, and fluxes of carbon and nitrogen in ecosystems. The results echo with previous findings about SOC gain (Maillard and Angers 2014, Qin et al 2018a) and additional N2O emissions (Zhou et al 2017) due to manure application. However, our analysis also showed that manure application resulted in less mineral fertilizer use, which led to reduced GHG emissions associated with mineral fertilizers production and application. The amount of avoided emissions (9.6 kg CO2e t−1) is about the same size as N2O emissions induced by manure (10.1 kg CO2e t−1), leaving climate benefits associated with SOC gains largely unaffected (figure 4). Thus, from a life cycle perspective, relative to application of mineral fertilizers, manure application reduces overall GHG emissions associated with each unit of corn produced.
By doubling the use of manure from 25% to 50% of total national production, an additional 27 million t of dry manure could be applied in the field, covering about 3.9 million ha of cropland (assuming an average of 7 t DM ha−1) (Qin et al 2018a). With reduced use of chemical fertilizers and increased soil carbon, the additional manure use result in GHG emissions that are lower than the base case by 0.3–1.7 Mt CO2e annually, with a national average reduction of 1 Mt CO2e yr−1. However, it should be noted that climate mitigation is not the intention or sole purpose of manure land application. For instance, manure for energy, even though in the early phases of commercialization (EPA 2013), has much greater mitigation potential than land application (Wu et al 2013). Land application, nevertheless, offers by far the most viable pathway to turn animal waste into resource at scale. Manure, if left untreated or poorly managed, may carry pathogens, antimicrobials and hormones that cause concern for animal and human health (EPA 2013). Manure discharged to surface waters can lead to environmental problems such as eutrophication and acidification (Sandars et al 2003, EPA 2013, Aguirre-Villegas and Larson 2017). Therefore, optimized management is also required for manure application in croplands to better prevent environmental hazards and reduce GHG emissions (Sandars et al 2003, Davidson 2009, Smith et al 2020).
In terms of GHG emissions, several other aspects should be given special attention. The primary goal of manure land application is to maintain or improve soil productivity (Zhou et al 2017, Zhang et al 2020). A recent review reported over 6% of crop yield increase with partial substitution of mineral fertilizers by manure in upland (e.g. corn, wheat), while nearly 10% yield penalty could happen with full manure substitution (Zhang et al 2020). The change of yield, and therefore crop residues returned to soil, could affect SOC sequestration rate and SOC stocks, which eventually would lead to overall change to GHG intensity (Kwon et al 2013, Qin et al 2018a). A combination of land management factors should also be considered for site- and region-specific operation feasibility. These factors include cover crops, tillage intensity, stover removal, crop rotation, manure type, availability and application methods (Qin et al 2015, 2018a). Besides, the N cycle can be affected by environmental factors such as soil pH, soil texture, temperature and precipitation; the relationships at national level may not necessarily hold true at finer spatial resolutions (e.g. state or county level) (Bouwman et al 2002, Eagle et al 2017). Spatially explicit modeling is desirable not only for quantifying SOC change, but is also necessary for LCA to improve understanding of farm scale management impacts on overall GHG mitigation potential (Paustian et al 2016, Qin et al 2018a). SOC can saturate over time under given management, this effect should be considered in the SOC and LCA simulations (Qin et al 2018a).
It should be noted that model limitations and uncertainties should be further examined to better simulate GHG emissions. For instance, state-level GHG emissions with only mineral fertilizers applied vary from 0.08–0.31 t CO2e t−1 corn grain, with an average of 0.20 t CO2e t−1 corn grain (figure 3(b)). The range of emissions are comparable with state-level estimates (Hsu et al 2010), but at the lower end of the county-level estimates (0.18–0.86 t CO2e t−1 corn grain) (Pelton 2019). Besides differences in model structure, system boundary, and management scenarios among models, model input data and parameters can also contribute to the uncertainties within each study. Here, we analyzed model sensitivity by examining GHG intensity responding to changing variables (i.e. fertilizer, manure and chemical inputs and emission factors) under the manure scenario (figure S1 (available online at stacks.iop.org/ERL/16/064079/mmedia)). Among the top ten listed variables, emissions intensity is most sensitive to N fertilizer application rate, with about 21% changes responding to 20% changes in the input. This is mainly because that N fertilizer application rate changes manure use and therefore determines emissions from both mineral fertilizer and manure. Emission factors also strongly affect the model sensitivity (figure S1). Particularly, N2O emission factor for manure is higher than for N fertilizer, in terms of either direct or indirect emissions; in GREET, the total N2O emission factor (i.e. N2O–N) is 2.25% and 1.525% of N content for manure and N fertilizer, respectively (Argonne National Laboratory 2019). These factors have been constantly updating in GREET, but still cannot fully explain nonlinear relationships between N2O flux and nitrogen application rate (Hoben et al 2011, Shcherbak et al 2014). In addition, manure application type, timing and frequency may influence emission intensity and magnitude (Lentz et al 2014, Cambareri et al 2017). Currently, manure use is still largely limited to crops, and the input data of manure needs to be improved in terms of temporal and spatial coverage and resolution. The overall uncertainty can be largely reduced with more robust and recent data, especially on manure production and its existing use (Qin et al 2015). Further research is also needed to better integrate ecosystem models simulating SOC and N2O with LCA model to better inform decision making at multiple levels from farm to national (Field et al 2020).
As far as climate mitigation is concerned, limiting GHG emissions solely by land management is challenging and unlikely to be sufficient to reach climate goals. A significant proportion of GHG emissions related to manure are linked to livestock sector (Johnson et al 2007, Davidson 2009, Herrero et al 2016) beyond the system boundary of current study. Manure storage and processing contributed about 10% of total GHG emissions in livestock sector; however its magnitude is uncertain at global scale (Herrero et al 2016). GHG emissions can largely be reduced by avoiding N losses via e.g. volatilization or runoff, often with simple measures such as covering manure (Smith et al 2008, Herrero et al 2016). Manure needs to be managed throughout its own, not just corn's, life cycle, to fully capture emissions and potential mitigation from collection, storage and processing (Smith et al 2008, Herrero et al 2016). The analysis should further address counter-factual scenarios where manure can be treated traditionally or for alternative uses (e.g. energy), and the system boundary can include both agriculture and livestock sectors to holistically examine manure's life cycle and manure management (Smith et al 2008, Davidson 2009, Herrero et al 2016).
Currently, the use of manure is dominated by land application, but manure to energy use is becoming increasingly attractive with mature technology and decreasing cost (EPA 2013, Wu et al 2013). For instance, manure can be digested anaerobically to produce biogas as energy source, or converted with gasification into syngas (Smith et al 2008, Wu et al 2013). Future analysis can include competing and/or alternative uses of manure and further consider manure's full life cycle GHG emissions. Co-benefits with manure use and possible environmental burdens need to be examined to fully understand advantages and shortcomings of different manure utilization pathways.
5. Conclusion
Croplands act as a net source of GHG emissions, regardless of location or fertilizer types. However, in comparison with mineral fertilizer use only, land application of manure can reduce overall GHG emissions intensity from corn's life-cycle perspective. On a per area or per yield basis, even though manure related transportation and on-farm soil N2O emissions cause additional GHG emissions, reduced mineral fertilizer use and additional SOC gain due to manure application can largely offset these additional emissions, and result in a net GHG emissions reduction at national level. The SOC gain from manure varies spatially and increases with reduced tillage intensity. Future studies are merited to further improve modeling capacity, examine the alternative fate of manure, and expand the system boundary to assess agriculture and livestock sectors holistically.
Acknowledgments
Z Q and S D have been partially supported by the National Basic Research Program of China (2016YFA0602701), the National Natural Science Foundation of China (41975113), and the Guangdong Provincial Department of Science and Technology (2019ZT08G090). The input of P S contributed to the following projects: DEVIL (NE/M021327/1) and Soils-R-GRREAT (NE/P019455/1).
Data availability
The data that support the findings of this study are openly available at the following URL/DOI: https://greet.es.anl.gov/.