

Abstract
Air pollution over the Seto Inland Sea (SIS) is among the most severe of any region in Japan and is considered to be affected by both long-range and local pollution. To unravel the long-term trends of aerosol pollution over this region, in this study, measurements from the moderate resolution imaging spectroradiometer instrument onboard the Terra satellite were analyzed over two decades, from 2001 to 2020. Fine-mode aerosol optical depth (AODf) was calculated to estimate the amount of aerosol produced by anthropogenic emissions. The results showed that the AODf over the SIS increased from 2001 to 2004, had a flat trend from 2005 to 2009, and decreased from 2010 to 2020. To clarify the impact of long-range transport from the Asian continent to the SIS, the AODf over the Yellow Sea was also investigated and was found to increase and level off during the 2000s, after which it decreased, especially after 2014. This decrease can be attributed to emission regulations in China. The above analysis suggests that the aerosol pollution status in the SIS during the late 2010s was similar to that during the early 2000s. Over the SIS, the lowest AODf value was found in 2020, with the values in January–March and June–July approximately 30% and 30%–60% lower than the average values during the same periods in 2018–2019, respectively. The reduction found in January–March could be related to the decline in the long-range transport with restrictions on human activity due to the COVID-19 pandemic. Meanwhile, the reduction during June–July could be related to the decline of local emission sources. Considering the large SO2 decline in 2020, regulations on SO2 emitted from ships that started from 1 January 2020 are one possible factor for the improvement of aerosol pollution over the SIS in 2020.
Export citation and abstract BibTeX RIS

Original content from this work may be used under the terms of the Creative Commons Attribution 4.0 license. Any further distribution of this work must maintain attribution to the author(s) and the title of the work, journal citation and DOI.
1. Introduction
The Seto Inland Sea (SIS; figure 1), the largest inland sea in Japan, has a complicated geometry and thus contains a variety of marine environments (Yasui and Kobayashi 1991, Takeoka 2002, Ministry of the Environment 2020a). The PM2.5 pollution over the SIS is among the most severe of any area in Japan (Ministry of the Environment 2020b). This is considered to result from the combined effect of long-range pollutant transport from the Asian continent and local air pollution. The long-range transport is related to the location of the SIS in Western Japan because the PM2.5 concentration shows a longitudinal gradient in Japan, being high in the west and low in the east (e.g. Itahashi et al 2012, Shimadera et al 2016, Uno et al 2020). Meanwhile, local emission sources in the SIS include power plants and other industrial facilities along the coastline as well as intense ship emissions from the sea itself (Ocean Policy Research Foundation 2011, Sakurai et al 2021). Measurements have shown that the vanadium (V) concentration is remarkably high above the SIS, which suggests a strong contribution from ship emissions to PM2.5 (Nakatsubo et al 2020). Furthermore, numerical modeling studies indicate that ship emissions are an important source over the SIS (Itahashi 2018, Shimadera et al 2018, Chatani et al 2020).
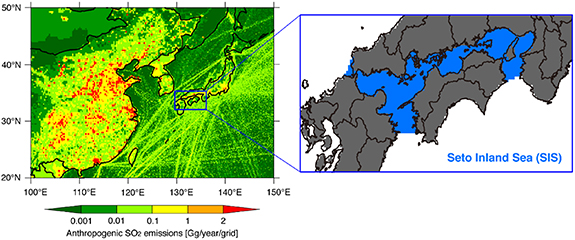
Figure 1. Left: map of anthropogenic SO2 emissions over East Asia. Right: location of the SIS as analyzed in this study.
Download figure:
Standard image High-resolution imageBecause the air quality standard for PM2.5 in Japan was set in 2009, ground-based observations of PM2.5 were exceedingly limited before this year; consequently, insufficient observational data are available to adequately validate the results of numerical modeling. Because the SIS is regarded as one of the most severely polluted regions in Japan, the long-term trend including prior to 2009 should be clarified. The current status also needs to be elucidated because of recent dramatic changes in 2020 as a result of coronavirus disease 2019 (COVID-19) and new regulations on SO2 emissions from ships. Therefore, in this study, continuous satellite observation was applied to capture the long-term air pollution status over the SIS over two decades during 2001–2020. Space-based satellite observations can be used to estimate air pollution (Irie et al 2016, van der A et al 2017) and constrain emissions (Lamsal et al 2011, Itahashi et al 2019). The present study used the aerosol optical depth (AOD) retrieved from the moderate resolution imaging spectroradiometer (MODIS) onboard NASA's Terra satellite, which is available from 24 February 2000 onward. AOD products can be used to capture aerosol pollution (Van Donkelaar et al 2010). This study aims to contribute to the understanding of the long-term trends over two decades of aerosol pollution over the SIS.
2. Methods
The AOD represents the attenuation of sunlight by aerosols and is an important measure of the aerosol column concentration (Kaufman et al 2002). To obtain the long-term trends of AOD over the longest period, the MODIS AOD product by Terra satellite was selected. Level 2 of the MOD04_3K product (NASA n.d.) in the latest Collection 6.1 (Levy et al 2013) was used. Because level 2 was swath data along the satellite orbit, the data were converted into 0.05°×°0.05 gridded data for analysis. This 3 km product closely mirrors the 10 km product, but its higher resolution enables the measurement of aerosol features closer to inland areas and coastlines; thus, this product can adequately capture the aerosol pollution over the SIS. The algorithm for determining aerosol characteristics at 550 nm has been validated with co-located surface observations from direct sun/sky radiometers from the aerosol robotic network, and the expected errors are ±0.05 ± 0.20 AOD over land and ±0.03 ± 0.05 AOD over ocean (Remer et al 2013). The error over land is greater than that of the 10 km product. The focus of this study was to capture the aerosol pollution over the SIS; therefore, the data of the small particle ratio at 550 nm provided over ocean (parameter name: 'Optical_Depth_Ratio_Small_Ocean_055micron') were multiplied by AOD (parameter name: 'Optical_Depth_Land_And_Ocean') to calculate the AOD corresponding to fine-mode aerosol (hereafter, AODf). The usefulness of AODf for detecting anthropogenic aerosol has been reported previously (Anderson et al 2005, Kaufman et al 2005). Based on this approach, error in estimation over land is reduced, and the aerosols attributed mainly to anthropogenic emissions are targeted. In this study, the AODf was calculated between 2001 and 2020 for each day. The data for the year 2000 were not used because this year is not fully covered by the MODIS AOD product. Then, monthly and annual means were calculated by averaging daily data. Additionally, data located adjoining land grids were not used to reduce the effect of errors in retrieval over land.
3. Results and discussion
An example of anthropogenic SO2 emissions over East Asia in 2010 taken from the HTAP inventory (Janssens-Maenhout et al 2015) is illustrated in figure 1. The grid resolution of HTAP is 0.1°×°0.1°. Large areas with SO2 emissions greater than 1 Gg yr−1 grid−1 (orange and red color in figure 1) can be seen over major cities in mainland China, the Seoul Metropolitan Area in the Republic of Korea, and around Osaka and Tokyo in Japan. Additionally, figure 1 clearly indicates that ship emissions in East Asian oceans are important contributors to emissions over East Asia, with emissions of 0.01–0.1 Gg yr−1 grid−1 (10–100 Mg yr−1 grid−1) (light green color in figure 1) being observed along shipping routes. For example, the latest inventory for 2015 estimated that SO2 emissions from ships over the SIS were 55.0 Gg yr−1, accounting for 29% of anthropogenic SO2 emissions in this region (Sakurai et al 2021). The emitted SO2 is oxidized in the gas and aqueous phases and then sulfate aerosol (SO4 2−) is generated in the atmosphere. Because SO4 2− has a long lifetime, it can be transported from the Asian continent to the downwind region of Japan (Itahashi et al 2017, Itahashi 2018, Chatani et al 2020). Therefore, the aerosol pollution in the SIS could be jointly affected by long-range transport from the Asian continent and local emissions.
The results of the long-term trend of AODf over the SIS are shown in figure 2. The monthly variation (figure 2(a)) shows minima in autumn and winter and maxima in spring and summer. This ranged from 0.1 to 0.7, and the monthly mean maxima in summer were largest between 2005 and 2007. It was also found that the range of monthly variation was generally smaller after 2010, except for a summer peak in 2017. The data coverage averaged over the SIS was around 20% for summer minima and close to 50% for autumn maxima (not shown). This coverage did not change over the study period. The annual average AODf over the SIS (figure 2(b)) showed an increasing trend from 2001 to 2004, a flat trend from 2005 to 2009, and a decreasing trend after 2010. The annual mean data coverage during the study period was around 30% (not shown). The analysis of AODf suggested that the aerosol pollution over the SIS was worst during the late 2000s and has been improving recently. The domestic emission of air pollutants (e.g. SO2 and NOx ) in Japan has been continuously declining since 1970 due to emission regulations (Wakamatsu et al 2013); therefore, the AODf trends of increasing, flattening, and then decreasing found over the SIS suggest that the aerosol pollution is attributable to not only local pollution but also long-range transport from outside the SIS. In our previous study (Itahashi et al 2012), the relationship between SO2 emissions in China and the AODf changes over the downwind region of Japan has been clarified based on the combined analysis of satellite data and numerical model simulation.

Figure 2. Long-term trends of AODf over the SIS. (a) Monthly mean; (b) annual mean.
Download figure:
Standard image High-resolution imageTo evaluate the trends of AODf, the available surface observations of PM2.5 were compared. The locations of the surface observation sites are mapped in figure 3(a). It should be noted that the observational data were collected based on the Japanese fiscal year, which extends from March to April of the next year (hereafter in this paragraph, 'year' is used to indicate this fiscal year). To evaluate the status of AODf over the SIS, only sites located within 5 km of a coastline were used (blue open circles in figure 3(a)). As the Japanese air quality standard for PM2.5 was established in 2009, these sites are limited to only four and 11 sites for the years 2010 and 2011, respectively; however, the available sites increased to more than 36 after 2012. To evaluate the trends in AODf, the continuous monitoring sites from 2012 were used. The trends after 2012 for AODf and PM2.5 are shown in figure 3(b). The annual mean AODf exhibited decreasing trends after 2012, as also found in figure 2(b). For AODf, the Q3 value did not change after 2015, whereas the Q1 value declined after 2015. As can be seen in figure 2(a), the lower value from autumn to winter will lead to a decline in Q1. The surface observations of PM2.5 showed continuous decreasing trends from 2012 to 2019. During this period, the trends of AODf and PM2.5 were −2.7 ± 1.1% yr−1 and −6.3 ± 0.5% yr−1 respectively. The comparison with PM2.5 observations reinforced that the analysis of AODf over the SIS can be used as a proxy for the aerosol pollution status over this region. Moreover, to investigate the reason for the declining trends in AODf, the spatial distribution of AODf was further analyzed.
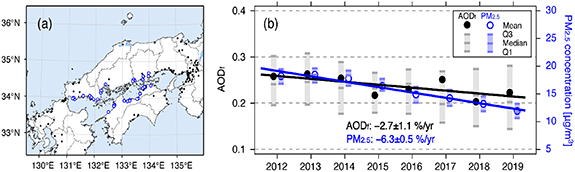
Figure 3. (a) Map of surface observation sites for PM2.5. Blue open circles are used for analysis. (b) Annual mean trends of AODf over the SIS and PM2.5 around the SIS region. Note that the annual mean is based on the Japanese fiscal year (see text).
Download figure:
Standard image High-resolution imageThe spatial distribution of AODf around the SIS from 2012 to 2020 is mapped in figure 4. The result clarified that higher values of AODf (around 0.3) were seen over Western Japan (upper left corner of each map in figure 4) from 2012 to 2014; however, such high AODf values were not found after 2015. This observation is consistent with the variation of the AODf over Western Japan. The higher AODf over Western Japan suggests that long-range transport from Asia is a contributing factor, which in turn implies that the declining trends of AODf over the SIS could be related to the reduction in long-range transport. These points are further discussed in next.
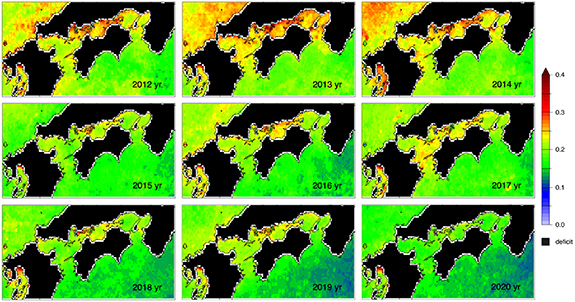
Figure 4. Spatial distribution of the annual mean AODf around the SIS from 2012 to 2020.
Download figure:
Standard image High-resolution imageFor the analysis of contributions of long-range transport from the Asian continent to the SIS, AODf and anthropogenic emissions in China were analyzed. The AODf over the Yellow Sea (YS) is shown in figure 5. This region is considered to be affected by the outflow from mainland China (Itahashi et al 2012), and is used in this study as one of the representative regions for long-range transport. The annual mean AODf over the YS showed an increasing trend from 2001 to 2006, except in 2004, constantly exhibited high values of around 0.45 from 2006 to 2014, except in 2013, and then decreased after 2014. In 2018–2020, the AODf was below 0.35, representing a decline of over 0.1 from the mean value during 2006–2014. In figures 5(b)–(f), the anthropogenic emissions in China are plotted for 2001–2015 (data from Li et al (2017)) and 2010–2017 (data from Zheng et al (2018)). SO2 emissions (figure 5(b)) and NOx emissions (figure 5(c)) showed inverse U-shaped curves with peaks in 2005 and 2012, respectively. NH3 emissions (figure 5(d)) were unchanged during 2001–2017. During the same period, NMVOC emissions (figure 5(e)) showed an increasing and then a flat trend. The primary PM2.5 (figure 5(f)) had a slight decreasing trend during 2001–2017. Under such variations in anthropogenic emissions in China, a decline in PM2.5 has been reported over the country since 2013 (e.g. Zheng et al 2017, Zhai et al 2019, Zhang et al 2019). Scatterplots between anthropogenic emissions and AODf are also shown in figure 5. The relationships between emissions and AODf differed for the various gaseous species; however, clear linear relationships were observed between AODf and SO2 and NOx emissions, respectively. This is because SO2 and NOx are important precursors of secondary inorganic aerosols of SO4 2− and nitrate (NO3 −). Zheng et al (2018) estimated that SO2 and NOx emissions in China have been strongly declining since 2011 and 2012, respectively. Those results suggest that the recently implemented Chinese regulations for anthropogenic emissions have triggered the decline of AODf over the YS. Considering the decline of Chinese emissions after 2012, the trends of AODf during 2012–2020 were further analyzed to investigate the connection between the declining trends over the YS and SIS.
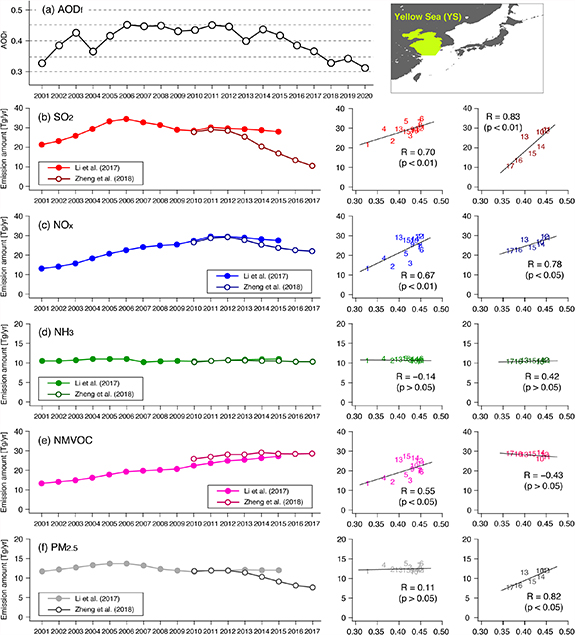
Figure 5. Long-term trends of (a) the annual mean AODf over the YS and (b)–(f) anthropogenic emissions in China. Also shown are scatterplots between AODf over the YS and each emission with numbers indicating the year.
Download figure:
Standard image High-resolution imageThe AODf trend from 2012 to 2020 was −2.9 ± 0.7% yr−1 over the SIS (figure 2(b); this value is slightly different from that in figure 3(b) since the latter was analyzed for the fiscal year) and −4.3 ± 0.6% yr−1 over the YS (figure 5(a)). The trend over the YS showed a rapid decrease. The correlation between the annual mean values of AODf over the YS and SIS during 2012–2020 was 0.75 (not shown), suggesting a moderate linear relationship. These results demonstrate that the reduction of emissions in China led to the decline of AODf over the YS, and that this was further related to the decline of AODf over the SIS. The seasonal AODf trend from 2012 to 2020 over the SIS was −3.3 ± 1.6, −2.2 ± 2.1, −4.8 ± 1.1, and −4.0 ± 1.5% period−1 during spring, summer, autumn, and winter. The correlation between the values of AODf over the YS and SIS during 2012–2020 was further investigated for each season. The results showed correlations of 0.73, 0.85, and 0.80 for spring, autumn, and winter, respectively. However, a lower correlation of 0.53 was obtained for summer. These correlation results suggest that the long-range transport of aerosol was an important factor in the variation of AODf over the SIS throughout the year, but its impact was weak in summer. Also, the lower value of declining trends during summer suggests that there were local impacts because the declining trends over the YS was greater than that over the SIS. This is consistent with previous studies based on numerical simulations that pointed out the contribution of the long-range transport of aerosol pollution in Japan, but enhanced local impacts during summer (Itahashi et al 2018, Chatani et al 2020). Additionally, as can be seen from the decadal trends for the SIS in figure 2(b) and for the YS in figure 5(a), the values of AODf in the late 2010s were mostly at the same level or lower compared with the early 2000s over both the YS and SIS. During the study period of over two decades, the aerosol air pollution improved as inferred from AODf. Moreover, a strong decline in AODf was found in 2020 over both the SIS and the YS; therefore, this year was further analyzed.
The International Convention for the Prevention of Pollution from Ships (MARPOL) Annex VI of the International Maritime Organization contains regulations on emissions from ships. One target is the reduction of sulfur emissions from ships. The sulfur content in fuel oil used by ships was 3.50% m/m. At its 70th session in 2016, the Marine Environment Protection Committee adopted mandatory requirements that sulfur contents be reduced to less than 0.50% m/m by 1 January 2020. Therefore, the SO2 emissions and SO4 2− produced from SO2 were expected to be reduced in 2020, especially over areas with a higher density of shipping traffic. For example, the impact of marine fuel sulfur restrictions has been reported in the Baltic Sea (Seppala et al 2021).
Another factor affecting anthropogenic emissions in 2020 was the dramatic changes in human activities caused by COVID-19. The first lockdown to contain the disease was started on 23 January 2020 in Wuhan, China, which is considered to be the epicenter of the outbreak (Chinazzi et al 2020, Tian et al 2020). Satellite measurements of the NO2 column—a proxy for NOx emissions—showed a strong reduction during the lockdown period (e.g. Zhang et al 2020, Wang et al 2021). In addition to this measure for controlling the spread of COVID-19, the Spring Festival holiday in China (24–30 January 2020) is also a possible cause of the emission reductions in early 2020. Emission reductions have been observed from 10 d before the beginning of the Spring Festival (Liu et al 2020, Wang et al 2021). Because of these dramatic changes, variations in AODf in 2020 were also considered in early 2020.
The monthly mean AODf over the YS and SIS during 2018, 2019, and 2020 is illustrated in figures 6(a) and (b). To quantify the difference between 2020 and the previous 2 years, the relative difference between 2020 and the average for 2018–2019 are also plotted as bar graphs for each month. As shown in figure 6(a), the AODf over the YS experienced a dramatic reduction in March 2020 of close to −60%. Other than March, the monthly variations in 2020 were similar to those found in 2018. The reduction of emissions could explain the decline of AODf during early 2020; however, the change was not remarkable in any month other than March. This could be related to unfavorable meteorological conditions (e.g. high relative humidity, stagnant wind conditions, and lower boundary height) promoting severe haze despite the reduction in emissions during the lockdown period from 23 January to 13 February 2020 (Le et al 2020). It was reported that, in April and May 2020, the NO2 pollution observed from space returned to previous levels (NASA 2020). The changes in AODf over the YS after April 2020 increased or decreased within the range of ±25%. As shown in figure 6(b), AODf over the SIS decreased by about 30% between January and March 2020 relative to the 2018–2019 average. In addition, a large reduction of 30%–60% over the SIS was identified during June and July 2020, whereas dramatic changes were not seen in other months in 2020.

Figure 6. Monthly mean of AODf over (a) the YS and (b) the SIS, and (c) NOx and (d) SO2 concentrations at observation sites around the SIS during 2018, 2019, and 2020. The relative changes between the average for 2018–2019 and 2020 are shown in bar graphs as relative percentages.
Download figure:
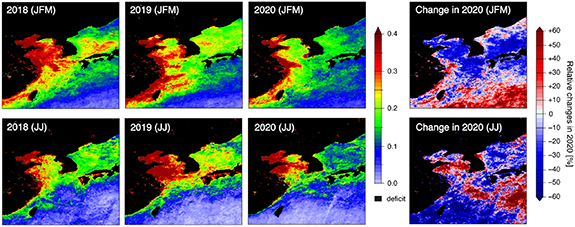
Standard image High-resolution imageThe spatial distribution of AODf over East Asia was averaged for January–March (JFM) and June–July (JJ) when the large decline in AODf was found over the SIS, as illustrated in figure 7. The AODf was high over the Asian continent and extended to the downwind oceans during JFM, whereas the AODf was limited close to the coastline of the Asian continent, but higher over the SIS during JJ in 2018 and 2019. This distinguished spatial distribution pattern supports the above discussion of the combined impacts of long-range and local aerosol pollution over the SIS. Such higher AODf declined in 2020. This decline in AODf during JFM was widely found from the YS to the SIS. Increased AODf found near Shanghai area was found when averaging over JFM; however, the decline in AODf over the whole YS were clear during March as suggested from figure 6(a). Through an analysis of PM2.5 in Japan during February and March 2020, Itahashi et al (2020) observed a 30%–50% reduction in the PM2.5 concentration from surface observational data and concluded that this reduction was jointly related to meteorological effects and the reduction in emissions due to the lockdown. Therefore, the most plausible reason for the decline in AODf over the SIS in early 2020 is the decline in long-range transport caused by emission reductions during the COVID-19 pandemic.
Figure 7. Spatial distribution of AODf over East Asia during averaging over JFM and averaging over JJ of 2018, 2019, and 2020. The changes are also shown as relative percentages in 2020 compared with the average for 2018–2019.
Download figure:
Standard image High-resolution image
The large reduction during JJ found over the SIS shown in figure 6(b) should be carefully examined. This reduction was lower over the YS; therefore, this could be related to the local emission effect as also suggested from figure 7. Previous studies have noted that the contribution of domestic sources to SO4 2− emissions in the SIS, including ship emissions, increases during summertime (Itahashi 2018, Chatani et al 2020). Data from the automatic identification system from stationary stations on land located over the SIS were analyzed to calculate the activity of navigation ships in the region from December 2019 to June 2020. It was concluded that there was no significant change in shipping activity in 2020 due to COVID-19. Therefore, if a reduction in ship emissions contributed to the reduction of AODf over the SIS during JJ, this was caused not by changes in ship activity but rather by the effect of the regulation of ship emissions from 1 January 2020. To provide support for this consideration, we analyzed continuous ground-based monitoring sites from 2012 for NOx and SO2 concentrations. The results are shown in figures 6(c) and (d). Due to the continuous emission reduction in Japan, both concentrations gradually reduced from 2018 to 2020. In 2020, the NOx concentration decreased by around 10%, whereas the SO2 concentration decreased much further, by around 30%. One of the reasons for the decrease in SO2 is the new regulations on ship SO2 emissions. Additionally, the economic slowdown that has occurred during the COVID-19 pandemic and its impact on other domestic emission sources might have further contributed to the decreases in NOx and SO2. These changes in local air pollution status are attributable to the decline of AODf over the SIS during JJ. In Japan, a state of emergency was declared from 7 April to 25 May 2020 (Cabinet Secretariat 2020). This measure presumably led to a large decline during April and May, and was well reflected in NOx concentration changes. However, there were no remarkable changes in AODf over the SIS during this period. We also considered that meteorological variation would be another important aspect in addition to changes in local emissions. In future work, numerical simulations will be useful for clarifying emission sources and meteorology as factors affecting changes in AODf and for performing quantitative evaluations.
4. Conclusion
This study analyzed the long-term trends of AODf over the SIS in Japan from 2001 to 2020. This region is located in Western Japan and is thought to be affected by both long-range and local pollution. The analysis showed a large increase of AODf after 2001, a flat trend during 2005–2009, and a decrease after 2010. This declining trend after 2010 was also identified by the analysis of surface observations of PM2.5 around the SIS. Additionally, by examining the changes in AODf in the YS, which lies upwind of the SIS, it was found that the trend of AODf over the YS corresponded well to the variations in anthropogenic SO2 and NOx emissions in China. Based on these analyses, the declining trends in AODf over the SIS after 2012 can be attributed to emission regulations in China. Emissions in China increased in the 2000s; however, aerosol pollution in China during late 2010s had largely returned to the level of the early 2000s due to the emission regulations. In 2020, the lowest values of AODf since 2001 were obtained, and this reduction was concluded to be related to the emission reduction caused by the response to the COVID-19 pandemic and the restrictions of ship SO2 emissions that were imposed from 1 January 2020.
Acknowledgments
This study is part of the project titled, 'Study on Global Limit for Marine Fuels Sulphur to better Air Quality (GLIMMS-AQ)', to be supported by the Environment Research and Technology Development Fund (JPMEERF20185002) of the Environmental Restoration and Conservation Agency of Japan during the period from April 2018 to March 2021. The authors are grateful for the MODIS observational data downloaded from http://dx.doi.org/10.5067/MODIS/MOD04_3K.061. The authors declare no conflicts of interest.
Data availability statement
The data that support the findings of this study are available from the corresponding author upon reasonable request.
The data that support the findings of this study are available upon reasonable request from the authors.