

Abstract
Low-temperature weather accompanied by strong chill wind is considered as a great risk factor for human health in winter, especially in some extreme weather conditions. Based on the observation data and the NCEP/NCAR reanalysis data of air temperature and wind velocity in 1961–2019, the warming pause of wind chill temperature (WCT) in the 21st century in China is first revealed in this paper. A significant increasing trend of WCT is found during 1961–1999 (P1), and a slight decreasing trend in 1999–2019 (P2) is detected by a 21 year running trend analysis. The extreme cold WCT day (WCD) with the WCT index below the 10th percentile also shows a decreasing trend in P1 but a slight increasing trend in P2. Both the WCT and the extreme WCD consistently display the warming pause in seven climatic regions in China. That means the slowdown or even decrease of human bioclimatic temperature in recent two decades may lead to an increasing risk of frostbite and other cold-related diseases in the country. Both the decreasing trend of mean temperature and the increasing trend of the wind speed contribute to the slowdown of the human-perceived warming in the 21st century, and this conjoint contribution could be linked to the East Asian winter monsoon circulations over Siberia, i.e. the Siberian high. The variation of averaged sea level pressure over the central region of the Siberian high shows high consistency with both the WCT and the extreme WCD in the whole study period, by a decreasing rate of −1.28 hPa per decade in P1 and an increasing rate of 1.26 hPa per decade in P2.
Export citation and abstract BibTeX RIS

Original content from this work may be used under the terms of the Creative Commons Attribution 4.0 license. Any further distribution of this work must maintain attribution to the author(s) and the title of the work, journal citation and DOI.
1. Introduction
Extreme temperature events accompanied by other severe weather always have more impacts on human body than the temperature itself, e.g. heat wave with high humidity in summer (Li et al 2020, Yuan et al 2020), or low-temperature with strong chill wind in winter (Brown 2015). Cold and chilly weather (usually referred to as wind chill) is considered as one of the major disasters and a great risk factor for human health in the winter of the northern hemisphere. Especially, in some extreme weather conditions it could bring some adverse health effects, such as frostbite, hypothermia, musculoskeletal disorder and numbness, and cardiorespiratory mortality (Carder et al 2005, Danielsson 1996, Pienimaki 2002, Holmér 2009, Zhu et al 2019). Extremely low universal apparent temperature defined by various weather indicators is associated with ischemic heart disease (Lin et al 2016). Therefore, understanding the trends and physical mechanisms of human bioclimatic cold extremes in winter at regional scales is critical to mitigate the potential damages to human health under a changing climate.
The wind chill temperature (WCT) index is used to evaluate the joint effect of low temperature and high wind velocity on exposed human body, since a single meteorological indicator, such as air temperature, is not enough to assess how cold it feels. The strong chill wind can bring surplus cold stress to human body in winter. For example, the variations of heart disease and cardiorespiratory mortality are closely related to the WCT rather than solely the low temperature (Kunst et al 1994, Carder et al 2005). The assessment of wind effects in cold environments on exposed skin areas has long been of great interest since Hill (1923) (e.g. Winslow et al 1936, Siple and Passel 1945). The old formula for equivalent temperature, derived in the 1960s from Siple and Passel's flawed but quite useful wind chill index, was used until 2001 by the weather services in North America as a common winter weather predictor (Shitzer and Tikuisis 2012). But it unnecessarily exaggerates the severity of the weather (Osczevski and Bluestein 2005). In 2001, the US National Weather Service (NWS) and Environment Canada jointly adopted a wind chill equivalent temperature risk level to express the combined effect of wind and low temperature (Osczevski and Bluestein 2005, Shitzer and Tikuisis 2012), which is largely based on the established engineering correlations of wind speed and convective heat transfer. The wind chill risk depends on the rate of heat loss from exposed skin caused by wind and cold weather, as issued by the US NWS (www.weather.gov/safety/cold-faqs). Based on the risk level, exposing at the air temperature of −28.9 °C and a wind speed of 4.2 m s−1 for 10 min may cause frostbite. However, when the wind speed increases to 9.7 m s−1 at the same air temperature, the frostbite danger time reduces to 5 min.
The increase of global mean surface temperature has slowed since 2000, regardless of the data source (Trenberth et al 2014). During the global warming hiatus or slowdown period (2002–2014), the frequency of winter cold extremes over the land of northern hemisphere increases at a rate of 1.5 d per decade, and the general behavior is not sensitive to the definition of the hiatus period (Johnson et al 2018). In China, warming hiatus also exists in both the maximum and the minimum air temperatures since 1998 (Shen et al 2018). Extreme cold surges, characterized by sharp temperature drop and strong winds, have increased the most notably in eastern Eurasia, especially in North China (NC) during the hiatus period (Ding et al 2020, Ma and Zhu 2020). Besides temperature, the near-surface wind is another meteorological factor that impacts the environment and human bioclimatic conditions. Though the wind speed has a decreasing trend of −0.109 m s−1 per decade in the whole study period of 1958–2015 in China, the trend is not evident in the hiatus period (Zhang et al 2019). In NC, the wind speed even has an increasing trend of 0.02 m s−1 per decade in 1992–2017 (Diao et al 2020). NC is the largest economic center and one of the most densely populated regions in China, and the 24th Olympic and Paralympic Winter Games will be held there. Hypothermia and frostbite are the most common cold injuries for sporting events under outdoor environmental conditions (Moran 2001). The decreasing air temperature and increasing cold extreme frequency, combined with the enhancing wind speed in this region, may bring more cold stress to human body in the slowdown period of global warming and cause great impacts on the sensation of the outdoor athletes and spectators.
The human-perceived WCT describes the combined effects of low temperature and strong wind, which are strongly related to the human health and natural environment. Lin et al (2019) have found that the warming tendency of winter WCT in China is higher than the counterpart of the air temperature, and the expansion of urban built-up area induces additional warming to the increase in WCT. Both in northern and southern China, the warming trend of WCT in highly developed urban areas is more substantial than that in non-urban areas in a long research period since 1960s or 1970s (Wang et al 2019a, 2019b). Moreover, the warming hiatus of winter WCT has also been observed in northern Asia, with a total trend of 1.11 °C per decade during 1973–1998 but −1.02 °C per decade during 1999–2013 (Ma et al 2017). By the end of the 21st century, the perceived temperature over China is projected to decrease by 4.8 °C on the basis of the observation in 1976–2005 (Zhu et al 2019). Therefore, the variations of human-perceived temperature are of significant concern in the assessment of climate change impacts on public health.
The East Asian winter monsoon (EAWM) has direct and significant effects on the winter temperature and wind speed in China. Current researches have explored a remarkable interdecadal shift of the EAWM from a weak period since the middle 1980s to a strong period since the late 2000s (Jeong et al 2011, Lu et al 2016, Yun et al 2020). As the most important member of EAWM, the Siberian high (SH) is regarded as a dominant force to the winter climate in China (Ma and Zhu 2019). Its intensification and southeastward expansion could trigger cold air outbreak and cause low temperature events accompanied by strong wind in China in each winter. Recent studies have pointed out that the enhancement of SH intensity since 1990s is related with a cooling trend over Eurasia (Sun et al 2016b, Zhao et al 2018). Its higher frequency of extreme pressure since 2000s causes more cold surges in NC (Ding et al 2020). Therefore, it is natural to raise a question whether the warming of human bioclimatic temperature is also slowed down or even decreased to lead to an increasing risk of frostbite and other cold-related diseases in China. If the slowdown or decrease exists, which circulation system is responsible for the warming pause of WCT? In this paper, the above questions are explored. The remainder of this paper is organized as follows. The introduction of data and method is in section 2. The changes of WCT are illustrated in section 3. In section 4, the interannual and interdecadal relationships between the variations of WCT in China and the possible effects of atmospheric circulation are investigated. Conclusions and discussions are given in section 5.
2. Data and method
Daily mean air temperature, wind speed and water vapor pressure data at 2513 weather stations since 1951 are extracted from the Basic Meteorological Elements of China National Surface Weather Stations (V3.0), which are issued by the National Meteorological Information Center of China Meteorological Administration (Ren et al 2012). This dataset has been strictly quality-controlled and has been widely used in operational meteorological services and scientific studies in China. In 1951–1960, the stations are distributed quite sparsely, while since 1961 the station numbers are stably over 2000. Therefore, only the data from 1961 are selected. In this paper, 914 stations with complete data in December–February between 1961 and 2019 are used. Most of the stations are located in the areas with the urban population of 50%–70% (figure not shown). Monthly atmospheric circulation data for the same period are taken from the National Centers for Environmental Prediction/National Center for Atmospheric Research reanalysis dataset, including the sea level pressure (SLP), horizontal wind and temperature at 850 hPa with a horizontal resolution of 2.5° × 2.5° (Kalnay et al 1996, Kistler et al 2001).
According to Tikuisis and Osczevski (2003), humidity has insignificant influence on the rate of skin cooling. NWS also found that the relative humidity was an insignificant weather parameter in affecting the WCT by testing 12 subjects. So in this study, the WCT index is adopted from Osczevski and Bluesteri (2005), Mekis et al (2015) and NWS, which consists of temperature and the wind speed.
When  , the WCT can be calculated from the temperature (T, °C) and the wind speed (V, m s−1) as follows
When  , the WCT is defined by the universal apparent temperature calculated from T, V and water vapor pressure (P, kPa) from Steadman (1984)

Besides the mean state of human-perceived cold stress, the human experience of extreme cold state should also be taken into consideration. In this paper, the 10th percentile threshold is used to detect an extreme WCD. The 10th percentile indexes have been generally chosen for climate extremes for their robust statistical properties and their applicability across a wide range of climates by IPCC (2013). An extreme WCD at a station is defined if the WCT is below the 10th percentile of all the local observations sorted from low to high.
The present study is focused on wintertime from December to February. As the winter spans two consecutive years, in this study the winter of 2019 denotes the December of 2018 to the February of 2019, and so on. The least squares method is applied to fit the linear trend. The Pearson correlation coefficients are calculated to demonstrate the relationships between two time series. For two time series X = (x1, x2, ..., xn ) and Y = (y1, y2, ..., yn ), their Pearson correlation coefficient r is:
where n is the sample number,  and
and  the averages of
X
and
Y
, respectively. The Student's t-test is applied for the significance test of the Pearson correlation (Wei 2007).
the averages of
X
and
Y
, respectively. The Student's t-test is applied for the significance test of the Pearson correlation (Wei 2007).
3. Pause of the WCT warming trend in the 21st century in China
The global warming has slowed down since 2000, and the strongest pause occurs in boreal winter (Trenberth et al 2014, Medhaug et al 2017). For China, a significant warming trend (0.23 °C per decade) was found from 1960 to 1998 but almost stagnated (0.05 °C per decade) after 1998 (Shen et al 2018). The trend of the human-perceived temperature during the recent decades is explored first. Figure 1 displays the mean WCT and the extreme WCD over China for the winters of 1961–2019. The time series of national average WCT shows remarkable interdecadal variations during the study period, with a rapid increase under the global warming before 1999 and a warming hiatus after 1999. Therefore, in the following analyses the whole study period is divided into two different stages, i.e. 1961–1999 (P1) and 1999–2019 (P2). A significant warming trend of WCT (0.71 °C per decade) exists in P1 and a slight decline trend (–0.26 °C per decade) exists in P2 (figure 1(a)), which coincides with the 'hiatus' period in global mean temperature (Li et al 2015, Xie et al 2017) as well as in China (Shen et al 2018). The 21 year-running linear trend is also displayed in figure 1(a). For the year in the abscissa, the 21 year period covers a time interval of ten years before and after a target year. For example, '1975' in the abscissa means a 21 year period of 1965–1985. During P1, the running trend is constantly positive, which exhibits an increase before 1993, indicating an acceleration of the human-perceived winter warming. The running trend reaches the maximum of 1.1 °C per decade at 1993 and then the warming rate slows down. During P2, the running trend turns to be negative.
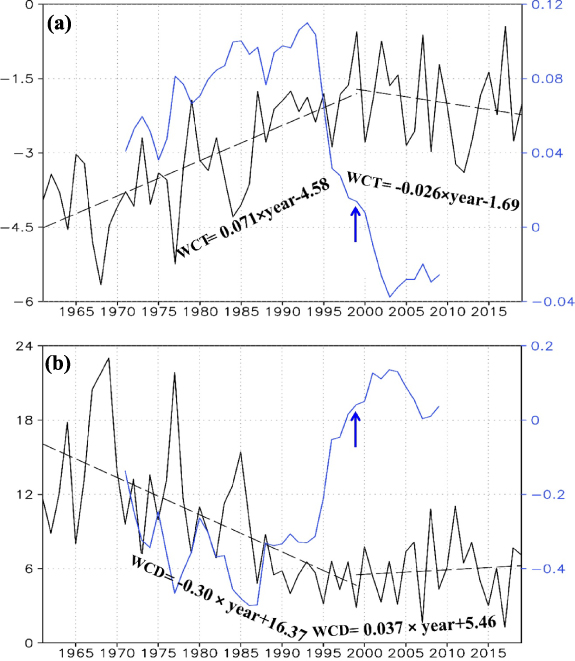
Figure 1. Variations of (a) the mean WCT (°C, black solid line, left ordinate), (b) the mean WCD (day, black solid line, left ordinate), and the 21 year-running decadal linear trends (°C year−1 for (a) and day year−1 for (b), blue solid line, right ordinate) over China averaged for the winters of 1961–2019. Black dashed lines show linear trends during P1 and P2, with equations shown below. The blue arrows denote the year of 1999.
Download figure:
Standard image High-resolution imageSimilar variations of the national average extreme WCD are also found during the study period. The extreme WCD decreases rapidly before the late 1990s at a rate of 3 d per decade, but rises slightly at a rate of 0.37 d per decade after 1999 (figure 1(b)). The running trend of extreme WCD remains negative before 1990s, indicating a consistent decline of the extreme low WCT days. However, it rises rapidly and turns to be positive after the late 1990s. From figure 1, it could be found that the transition of both WCT and WCD in P2 is quite similar to the recent cold winters in Eurasia or the slowdown of the global mean temperature, regardless of the data source (e.g. Cohen et al 2014, 2020, Trenberth et al 2014, Overland et al 2015, Johnson et al 2018, Li et al 2019). The pause or decreasing WCT and the increasing extreme WCD may increase the risk of adverse health effects caused by the wind chill events.
As mentioned above, both the WCT and the extreme WCD have new variations in the P2 stage, which are much different from the counterparts in P1 and in previous studies (Lin et al 2019). The pause or stagnation of the warming in China and the increasing frequency of cold extremes have shown clear spatial discrepancy (Ding et al 2020). Therefore, it is necessary to examine the spatial characteristics of the trends of the mean WCT and the extreme WCD in China in each period, and to explore the features of the areas with the most notable stagnation. For the climatological mean conditions, the winter WCT distribution of a cold-chilly climate in the northern region and a warm climate in the southern region is due to the cooler temperature and stronger wind in the northern region (Lin et al 2019). Figure 2 displays the spatial distribution of the trends of winter WCT and extreme WCD in China in P1 and P2. In P1, a significant increasing trend of WCT is observed all over China. The largest warming is mostly discernible in northern China, including Northwest China (NWC), NC and Northeast China (NEC), where the winter WCT for the climatological mean conditions is lower than that in southern China (figure 2(a)). The significant trend is above 1 °C per decade in the three regions. In P2, a decline of WCT is found over most of China (figure 2(b)). The significant decreasing trend at a rate of 1 °C per decade is concentrated in Xinjiang, NC and South China (SC), and is scattered along the Yangtze River Valley.

Figure 2. Spatial distributions of the trends of the winter WCT (°C per decade) and the WCD (day per decade) in China in P1 (a) and (c) and P2 (b) and (d). Small and big grey dots denote the trend significant at the 0.1 and 0.05 levels, respectively. The dashed lines in (a) delineate the seven climate regions in China.
Download figure:
Standard image High-resolution imageSimilar rapid decrease in P1 and slowdown in P2 for the extreme WCD can be found over most of China. In P1, the extreme WCD is significantly reduced with a trend below −2 d per decade, especially in northern China, eastern China and SC (figure 2(c)). But in P2, the extreme WCD has an increasing trend in most of China, except in the lower reaches of both the Yellow River and the Yangtze River (figure 2(d)). The human-perceived wind chill is colder in the global warming slowdown period, with an increase of cold extremity and more thermal discomfort in winter.
To compare the trends of the human-perceived temperature in P1 and P2 in different regions, the whole China is divided into seven regions based on the climate zoning (delineated by dashed lines in figure 2(a)), i.e. NWC, Southwest China (SWC), NEC, NC, the Yangtze and Huai River, the south of the Yangtze River and SC. Figure 3(a) shows the 21 year running trends of WCT in each region, and the trends are quite consistent in the seven regions. They are stably positive before the end of the 20th century, decrease after 1995, and change to be negative from the end of the 20th century to the early of the 21st century. In China, the climatically mean WCT decreases from the south to the north, and is the lowest in northern China (including NWC, NEC and NC). The three regions in northern China have the largest increasing trend of WCT in P1, exceeding 0.9 °C per decade, indicating that they are less suffered from the human-perceived cold weather in winter. However, the WCT trends decrease in these three regions in P2. The variations of the 21 year running trends for the extreme WCD are similar, with a significant decreasing trend in P1 but a much weaker trend in P2. In NWC, NEC and NC, the trends in the later period even change to be positive (figure 3(b)). This means all the seven regions have notable human-perceived warming before the slowdown period and a warming pause or colder environment in the new century. The decreasing perceived low-temperature in recent two decades, especially the more extreme events characterized by the increasing extreme WCD, may have adverse effects on human thermal comfort and bring high risks for human health.
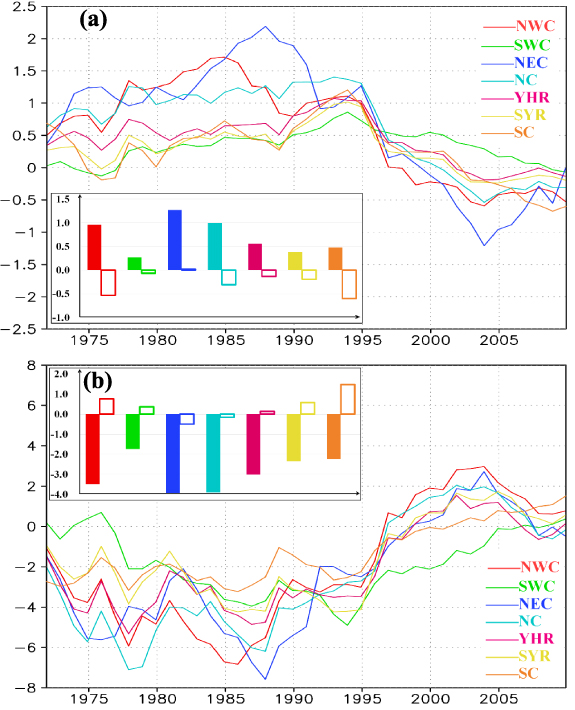
Figure 3. The 21 year running trends of (a) the winter WCT (°C per decade) and (b) the WCD (day per decade) in each climate region of China. The left small panels in figures show the trend for each climate region in P1 (filled bar) and P2 (outline bar), respectively.
Download figure:
Standard image High-resolution image4. Atmospheric reasons for the warming pause of WCT
The WCT is based on the rate of heat loss from the exposed skin caused by wind and cold weather. To measure the combined effects on human thermal comfort, the two meteorological indicators, i.e. the air temperature and wind speed, are taken into consideration together to account for the perceived low-temperature. The spatial distribution of the trends of the mean temperature and wind speed in China in winter during P1 and P2 is depicted in figure 4. The winter temperatures at most stations over China exhibit significant increasing trends in P1 (figure 4(a)). The warming is notably stronger in the northern areas by a rate of exceeding 0.5 °C per decade than that in the southern areas. However, a cooling trend is found over most of China except in NEC and SWC in P2, with some stations deceasing at a rate of −0.5 °C per decade in NC (figure 4(b)).
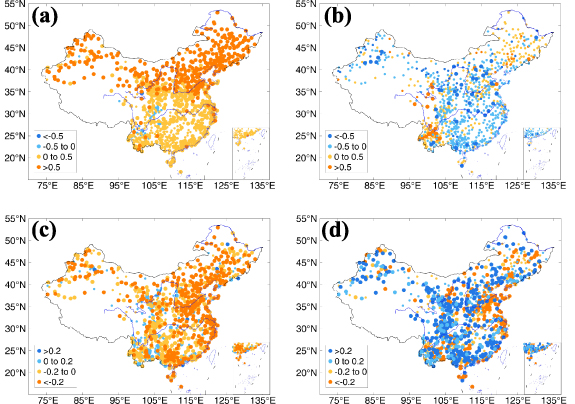
Figure 4. Spatial distributions of the trends of winter mean temperature (°C per decade) and wind speed (m s−1 per decade) in China in P1 (a) and (c) and P2 (b) and (d). Big dots denote the trend significant at the 0.1 level.
Download figure:
Standard image High-resolution imageAs the wind speeds up, it draws heat from the human body, and drives down skin temperature and eventually the internal body temperature. Therefore, at the same temperature, the high wind speed makes us feel much colder in winter. For wind speed, it shows a declining pattern over most regions of China in P1. The largest decline is found in the North China Plain at a rate lower than −0.4 m s−1 per decade. During P2, the wind speed increases significantly over most stations in China. Lin et al (2019) have found a declining wind speed pattern over China during the period of 1961–2014. In the present study, it is found that the wind speed trends in most regions show a reverse spatial pattern during the P2 period compared with the P1 period. Diao et al (2020) have also found a mutation of the wind speed in 1991 in NC, and the largest wind speed increases in the winters of 1992–2017 at a rate of 0.065 m s−1 per decade. The increase of wind speed in winter over China, especially in NC, contributes to the colder feeling of the WCT during P2.
The significant warming trend of mean temperature and the declining trend of wind speed contribute to the warming of the WCT in China during P1, indicating the reducing of the winter wind chill seriousness. However, during P2, the cooling trend of mean temperature and the increasing trend of wind speed contribute to a slowdown of human-perceived warming in winter or even a colder bioclimatic environment since 1999.
Atmospheric circulations of the EAWM systems are the major influencing factors for winter climate in China. As the most important member of EAWM, the SH is regarded as a dominant force to the winter climate in northern hemisphere (Cohen et al 2001, Tian and Fan 2020) as well as in China (Wen et al 2009, Sun et al 2016a, Yu and Sun 2018). The significant influences of SH on both the climate and the weather in China have been widely explored by numerous studies since Tu (1937). To reveal the changes and possible effects of the atmospheric circulation on the WCT variations, spatial distributions of the correlations of the WCT with SLP, 850 hPa temperature and wind during 1961–2019 are displayed in figure 5(a). A significant negative correlation between WCT and SLP is found below −0.5 over a broad region in Siberia, and a significant positive correlation between WCT and 850 hPa temperature is found in East Asia, with a high correlation center above 0.8 in East China. Cyclonic correlation circulations at 850 hPa are found from the western Europe to the Lake Baikal in the north of 50° N, while anticyclonic correlation circulations are found over China. This indicates that the SH plays an important role in the WCT variations in China.

Figure 5. (a) Spatial distributions of the correlations between the WCT over China and the SLP (blue contours, only below −0.5 shown), the 850 hPa temperature (red contours, only above 0.6 shown) and 850 hPa wind speed (arrows) in 1961–2019. Shades indicate the difference centers of trend coefficients of normalized SLP between the P2 and P1 periods. (b) Area averaged SLP in (50–65° N, 60–110° ) (solid line) and the linear trends (dashed lines) in P1 and P2. The black dashed box in figure 5(a) indicates the average area.
Download figure:
Standard image High-resolution image
To reveal the impacts of the SH change on WCT, the difference of trend coefficients of normalized SLP between P2 and P1 is also displayed in figure 5(a). The SLP over Siberia intensifies from P1 to P2, with an increasing center above 1.2 hPa per decade in the west of the Lake Baikal, which is also the most significant negative correlation center between SLP and WCT. The averaged SLP in this region (50–65° N, 60–110° E) decreases at a rate of −1.28 hPa per decade in P1, while it increases at a rate of 1.26 hPa per decade in P2 (figure 5(b)). This indicates that the weakening of the SH causes the WCT warming in P1, and the SH intensification in P2 contributes to the pause of the WCT warming in China in recent decades. The transition of the SH from the weakening to intensification results in the change of WCT in China from the significant warming in P1 to the warming pause in P2.
5. Conclusions and discussions
Low temperature accompanied by strong chill wind is one of the major meteorological disasters in winter, which can be a great risk factor for exposed human body. This paper reveals the pause of the increasing WCT and the raise of extreme low WCT days in China during the recent global warming slowdown in the 21st century, and explores the possible linkage to the changes of the atmospheric circulation over Siberia. The national average WCT shows remarkable interdecadal variations during the study period of 1961–2019. A significant increasing trend of WCT is found over China during 1961–1999 (P1), and the largest warming is mostly discernible in northern China at a rate of above 1 °C per decade, including NWC, NC and NEC. However, a slight decline trend (–0.26 °C per decade) exists in 1999–2019 (P2) with a significant decreasing trend at a rate of 1 °C per decade concentrated in Xinjiang, NC and SC and scattered along the Yangtze River Valley. For the national average extremes, the extreme WCD decreases rapidly in P1 at a rate of 3 d per decade, but rises slightly at a rate of 0.37 d per decade in P2. The 21 year running trends of WCT and extreme WCD are quite consistent in the seven climatic regions of China, with notable human-perceived warming before the global-warming slowdown period and a warming pause or colder environment in the 21st century.
The air temperature and wind speed are taken into consideration together to account for the perceived WCT. Winter temperature at most stations in China exhibits significant increasing trends in P1, and the wind speed also has a declining pattern over most regions in the same period. However, the cooling trend of mean temperature and the increasing trend of wind speed in most of China contribute to the slowdown of the human-perceived warming in winter in P2. The reverse trends of the WCT from P1 to P2 are influenced by the atmospheric circulations of EAWM systems. The significant negative correlation between WCT and SLP is found below −0.5 over a broad region in Siberia. The averaged SLP in this highly-correlated region (usually mentioned as the SH) decreases at a rate of −1.28 hPa per decade in P1, while it increases at a rate of 1.26 hPa per decade in P2. The transition of the SH from the weakening to intensification results in the change of WCT in China from the significant warming in P1 to the warming pause in P2. It should be pointed out here that the human activity may also affect the WCT trend. For example, the increasing aerosol emissions can contribute to the decreasing temperatures (Smith et al 2016, Chen et al 2019, Seong et al 2021). However, the expansion of urban built-up area can induce additional warming to the increase of WCT by magnifying the heating effect and slowing down the surface wind speed (Taha 1997, Zhou et al 2004, Memon et al 2008, Luo and Lau 2018, Lin et al 2019). Deep analyses of the mechanisms need to be carried out in the future, especially the synergistic effect from multi factors.
In the future, China is projected to experience an apparent increase of annual air temperature and a decrease of the frequency and duration of extreme cold events (Zhu et al 2019). However, by considering the combined effect of temperature and wind speed, the perceived temperature in China is projected to decrease by 4.8 °C by the end of the 21st century relative to the observed values in the baseline period (1976–2005), and a trend of extreme cold events is detected with an increase of 21% in the frequency of temperature below −20 °C (Zhu et al 2019). The effect degree of cold waves and freeze injury will be heavy in NWC, NEC, East China, SC and SWC in the 21th century (Qin 2015). The projections of winter temperature, wind speed and SLP are also validated in the second half of the 21st century by the EC-Earth3 model under a scenario of societal development pathways 2–4.5 in Coupled Model Intercomparison Project 6 (O'Neill et al 2016, Massonnet et al 2020). Before the projection, the trends of the three variables in the model in 1961–1999 and 1999–2014 are compared with the observation (figures S1 and S2 in the supplementary materials section (available online at stacks.iop.org/ERL/16/064070/mmedia)). Primary analyses indicate that the EC-Earth3 model can well capture all the changes of the three variables. Projection results show both the wind speed in China and the SH have increasing trends in the second half of the 21st century (figure S3 in the supplementary materials section), which are consistent with the results of Zhu et al (2019). That means human health is prone to experience the negative effects from the increase of cold extremes and disasters, more synergetic response strategies should be considered to strengthen researches on the effect and prevention of disease and to improve the monitoring, early-warning and emergency system for health-related cold extremes.
Acknowledgments
We thank the editors and the two anonymous reviewers who have provided thorough reviews of this paper. This research was funded by the National Key R&D Program of China (Grant Number 2018YFC1505603).
Data availability statement
The data that support the findings of this study are available upon reasonable request from the authors.