

Abstract
A reduction in the overall carbon intensity (CI) of a crop-based biofuel can be achieved by cutting down the CI of the biofuel's feedstock, which in turn correlates significantly to agricultural management practices. Proposals are being made to incentivize low-carbon biofuel feedstocks under U.S. fuel regulatory programs to promote sustainable farming practices by individual farms. For such an incentive scheme to function properly, robust data collection and verification are needed at the farm level. This study presents our collaboration with U.S. private sector companies to collect and verify the corn production data necessary for feedstock-specific CI calculation at the farm level, through a carefully designed questionnaire, to demonstrate the practicality and feasibility of data collection at scale. We surveyed 71 farms that produced 0.2 million metric tons of corn grain in 2018 in a Midwestern U.S. state to obtain information on key parameters affecting corn ethanol feedstock CI, such as grain yields, fertilizer/chemical application rates, and agronomic practices. Feedstock-specific CI was calculated in the unit of grams (g) CO2 equivalent (CO2e) of greenhouse gases per kilogram (kg) of corn produced. Results showed large CI variations—from 119 to 407 g CO2e kg−1 of corn—due to the farm-level inventory, while the production-weighted average CI for all surveyed farms was 210 g CO2e kg−1, comparable to the national average CI of 204 g CO2e kg−1. The nitrogen fertilizer type applied and rate were identified as key factors contributing most to CI variations at the farm level. The estimated N2O emissions from fertilizer and biomass nitrogen inputs to soil accounted for 51% of the overall farm-level CI and therefore need to be better monitored at farm level with high resolution. We concluded that this feedstock-specific, farm-level CI evaluation has the potential to be used to incentivize low-carbon feedstock for biofuel production.
Export citation and abstract BibTeX RIS
1. Introduction
The greenhouse gas (GHG) emission reduction potential of a given biofuel pathway is often evaluated using a life-cycle analysis (LCA) that accounts for all bioenergy pathway stages, including farm input manufacturing (e.g. fertilizer production), feedstock production, conversion at the biorefinery, and land use changes prompted by increased feedstock production. The key result of biofuel LCA is carbon intensity (CI), expressed as grams (g) of carbon dioxide equivalent (CO2e) per megajoule (MJ) of biofuel produced (Liu et al 2018) and a critical driver of public opinion and national policy. The CI of biofuels is especially important for the California Air Resources Board's (CARB's) Low-Carbon Fuel Standard (LCFS), in which California has committed to reducing the state's transportation fuel CI by 20% (compared to that of 2010) by 2030. The CARB program incentivizes lower-CI fuel production from individual fuel production pathways and individual biorefineries. It operates through a system of tradable permits that are monetarily valued based on the CI differences of alternative fuels (e.g. bioethanol and biodiesel) and the fossil fuels they replace (e.g. conventional gasoline and diesel). However, incentives have not been established for feedstock producers, as feedstock certification is not yet allowed by LCFS. As a result, feedstock producers may not be motivated to take the perceived risk of changing farming practices and adopt sustainable, carbon-reducing practices.
Advances in sensors and field-level measurements now allow detailed, field-specific data that can be used to measure and ensure the GHG benefits of sustainably produced feedstocks. This has prompted research efforts among stakeholders and regional policy makers to evaluate the potential for shifting current farming practices to low-carbon ones. For example, using Argonne National Laboratory's Greenhouse gases, Regulated Emissions, and Energy use in Technologies (GREET) LCA model (Wang et al 2020) and regionalized life-cycle inventory data, Liu et al (2020a) analyzed the impact of land management changes, such as the adoption of crop rotation with cover crops and/or conservation tillage, on the CI of corn grains in the U.S. major corn producing states. They showed that the large variations in corn CI associated with different farming and land management practices would lead to significant CI variations in the ethanol produced from the harvested corn grain. This finding further implied that if fuel regulatory programs, such as CARB's LCFS, were to allow feedstock certification in addition to their fuel production facility certification, the monetary credits could incentivize farmers to produce lower-CI feedstocks.
Here we expanded our previous study by further investigating feedstock CI variations using on-farm survey data. For this study, we worked with two U.S. private sector companies to launch a pilot study in which farm-level inventory data were collected and used to calculate corn feedstock CI at the farm level. In particular, we calculated the corn grain CIs from 71 surveyed farms in a small region around an ethanol plant. We further estimated the level of financial incentives available to farmers if carbon markets such as CARB's LCFS were to allow feedstock certification, which might encourage feedstock producers to shift to lower-CI farming practices. Finally, we introduced the transparent and easy-to-use feedstock carbon intensity calculator we developed in this work, so that corn feedstock producers are able to use this publicly available tool (https://greet.es.anl.gov/tool_fd_cic) to quantify corn grain CIs with farm-level input data and management practices (Wang et al 2020).
2. Methodology
2.1. Study area and data collection
According to the U.S. Department of Agriculture (USDA) National Agricultural Statistics Service, the total corn production in the U.S. in 2019 was estimated to be 0.39 billion metric tons, and approximately 40% of the corn grain was used for producing bioethanol (United States Department of Agriculture 2019). Of the 37 million hectares planted for corn in U.S. in 2019, 65% of the total planted area was concentrated in the Midwestern states (figure 1). Our study area was in South Dakota, where the world's largest biofuel producer, POET LLC, is headquartered. In 2019, Argonne National Laboratory teamed up with POET and Farmers Business Networks (FBN), a farmer-to-farmer information network with the mission of promoting better agronomic decisions, to launch a pilot project near POET's Chancellor facility (figure 1).
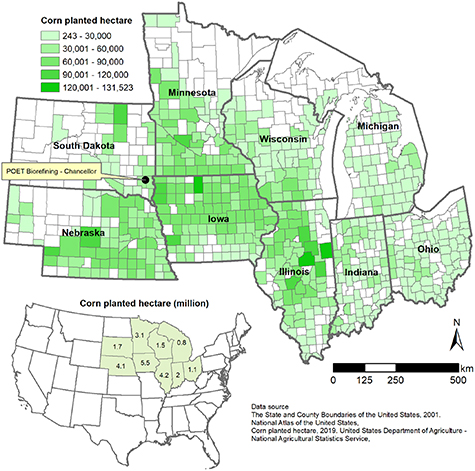
Figure 1. Overview of the study area selected to launch the pilot project. The black dot indicates the location of POET's Chancellor corn ethanol facility in South Dakota.
Download figure:
Standard image High-resolution imageTo obtain farm-level data for corn CI estimation, we designed a questionnaire on key parameters essential for conducting a reliable feedstock LCA. It includes farm size, major crop rotation, corn yield, farm energy use, fertilizer types and rates, other chemical (e.g. herbicide) use, tillage practices, cover crop practices, and animal manure management in the 2017–2018 crop year. The detailed questionnaire is provided in the supporting information (available online at stacks.iop.org/ERL/16/064055/mmedia). POET offered a premium of $2 per metric ton of corn for survey participation, which incentivized 71 farms to participate in the project, achieving a representative sample of farmers at a manageable cost. All farms were located within 100 km of the Chancellor ethanol facility and delivered a percentage of their corn grain to the facility. FBN used the questionnaire to collect information on 0.2 million metric tons of corn grain produced from these farms, which is about 25% of the maximum grain processing capacity at the Chancellor ethanol facility. The surveyed data were further verified by FBN through monitoring machinery data, checking additional documents (e.g. scale tickets, crop insurance, and purchase receipts), and conducting phone or on-farm follow-ups with farmers.
2.2. Farm-level CI calculation
We used the 2019 version of GREET (GREET 2019) to calculate the field-level CI of corn grain, based on the data collected by FBN for 71 farms. The functional unit of this study is one kilogram (kg) of corn harvested at each farm. Our system boundary was cradle-to-farm-gate, and the CI results were calculated in g CO2e of GHGs per kg of corn produced (g CO2e/kg) (figure 2). GHGs include CO2, CH4, and N2O weighted with their global warming potential. Fuel regulatory programs such as CARB's LCFS account for soil organic carbon (SOC) emissions, associated with land use change due to large-scale use of corn feedstock for ethanol production, when calculating corn ethanol CI (Kwon et al 2020). However, since our focus was on the cradle-to-farm-gate activities, we excluded the GHG emissions potentially caused by land use changes in the CI calculations for this analysis (figure 2).
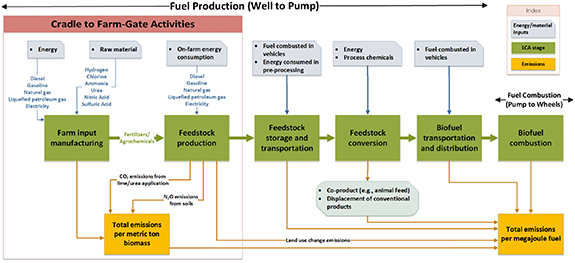
Figure 2. The system boundary of cradle-to-farm-gate activities, compared with a complete supply chain of corn ethanol.
Download figure:
Standard image High-resolution imageWe considered three categories of key parameters affecting corn CI:
- Fertilizer/chemical application types and rates—Used to calculate the embodied GHG emissions in upstream fertilizer/chemical manufacturing and on-field emissions (Liu et al 2020a).
- On-farm energy consumption per unit area—Used to calculate the upstream GHG emissions from producing each energy source, including diesel, gasoline, natural gas, liquefied petroleum gas, and electricity, and on-farm emissions of combusting these fuels during farming. To limit the burden of data collection on farmers, we collected total energy use from all on-farm operations for each farm rather than from individual operations (e.g. field preparation, tilling, fertilizer/chemical application, and harvesting) on each farm.
- Corn yield per unit area—Used to calculate the material/energy inputs per kg of corn, and thus the CI of corn grain. Also used to estimate the total volume of ethanol produced per area of land with the corn-grain-to-ethanol conversion rate.
While key farming inputs were collected and verified through the questionnaire, we applied the default GREET values for parameters that are less influential for cradle-to-farm-gate GHG emissions to ensure a complete system boundary while reducing the burden of data collection. These parameters include the application rates of various types of insecticides and herbicides and energy consumption in irrigation and grain drying, which together contribute approximately 6% of the cradle-to-farm-gate GHG emissions.
We also included questions on various sustainable agronomic practices in the survey to reflect the current interest in evaluating the CI of biofuel feedstock produced using these practices:
- Nitrification inhibitor application—Reduces fertilizer-induced nitrous oxide (N2O) emissions but incurs additional GHG emissions in its upstream production.
- Conservation tillage—Reduces soil erosion, improves SOC contents, and reduces on-farm energy use in tilling (Liu and Bakshi 2019).
- Animal manure application—Improves soil quality by adding organic carbon and nutrients but increases on-farm N2O emissions and energy use.
- Cover cropping—Increases carbon residue and nutrient inputs to soil and reduces soil erosion. Legume cover crops, in particular, fix nitrogen from the air into the soil, reducing the need for synthetic nitrogen fertilizer. However, cover crops require extra herbicide and energy use and have additional on-field N2O emissions due to nitrogen in the cover crop biomass inputs to the soil. The on-field N2O emissions were estimated with an empirical approach, using the N2O emission factors already built into the GREET model, which were taken from the United Nations' Intergovernmental Panel on Climate Change (IPCC) report (Dong et al 2006) and literature review (Xu et al 2019).
We approximated the effect of cover crops on corn CI, using rye as an example. Information on crop yield, nitrogen content, and additional herbicide requirements for rye cultivation was already built into the GREET model (Qin et al 2015). However, since feedstock producers in South Dakota cultivate a wide range of cover crops, similar information would need to be collected for the other cover crops to estimate the farm-level CI more accurately, which was beyond the scope of this analysis.
Information on manure type and application rate was also collected from the survey. Per-area application rates were provided by farmers in either mass or volume units. A manure density of 0.96 kg l−1 was assumed to translate between the mass and volume units reported by farmers (United States Department of Agriculture Natural Resources Conservation Service 2013). If farmers reported manure use but did not specify the amount, the county-level manure application rate was assumed: 44.8 kg ha−1 manure nitrogen for Turner County, South Dakota (Xia et al 2021).
Information on nitrification inhibitor application was also collected. We employed one of the meta-analytic means (assuming 30% lower N2O emissions than conventional nitrogen fertilizer due to double inhibitors) estimated by Thapa et al (2016), where the effect of enhanced-efficiency fertilizers on N2O emissions and crop yields was evaluated across soil and management conditions for corn, wheat, and rice production systems. However, we did not include the GHG emissions associated with the production and transportation of the nitrification inhibitor in this analysis, since their contributions to corn CI are minor (Liu et al 2020a).
Lime needs to be applied when the soil pH becomes low; therefore lime application is a source of on-field CO2 emissions and contributes to the cradle-to-farm-gate GHG emissions in its upstream manufacturing stage. Typically, lime is applied every few years, but our survey collected corn production information from the 71 farms in 2018 only, so information about the frequency of lime application was not available. To compensate for this lack, we assumed that lime was applied every eight years in the region based on the survey results, in which 9 out of the 71 farms (or one out of every eight farms) reported applying lime to soil in 2018. Then, we calculated the production-weighted annualized lime application rate for the nine farms and applied the calculated rate to all 71 farms in the survey.
The production-weighted averages for key farming inputs and corn grain CI were calculated from the data collected from the 71 farms. National average values were estimated by applying the corn areas planted in the main corn production states (figure 1) as weighting factors and used as the comparison base (Liu et al 2020a).
3. Results
3.1. Farm-level data summary
The farm size distribution shows that all surveyed farms were larger than 80 ha, and 80% of them were over 400 ha. Larger farms use agricultural machinery to perform all tasks, facilitating the recording of energy and material usage data through monitors/sensors on tractors. Furthermore, a recent study by Jin et al (2020) indicated that producing corn on large and medium farms in Delaware is more energy-efficient than on small farms. We discovered a similar trend in the survey results, although differences were not statistically significant.
Figure 3 summarizes the survey results. While the weighted average yield from all surveyed farms based on harvested hectares of each farm was 12 metric tons ha−1, which is comparable to the national average of 12.3 metric tons ha−1 (figure 3(a)), the average farm-level energy use of 205.5 kilo-joule (kJ) kg−1 of corn was lower than the national average of 234.9 kJ kg−1 (figure 3(b)), with a minimum usage amount of 136.9 kJ kg−1 and a maximum of 373.3 kJ kg−1.
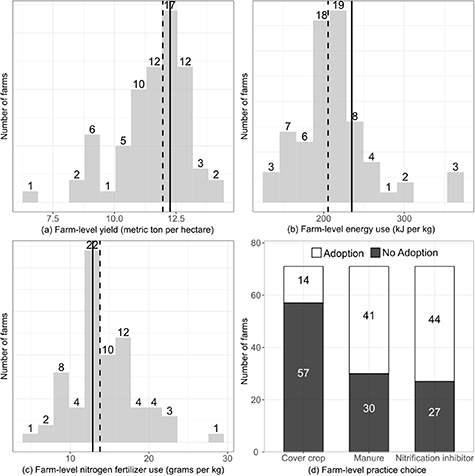
Figure 3. Summary of survey results: (a) farm-level yield distribution, (b) farm-level energy use distribution, (c) farm-level nitrogen fertilizer use distribution, and (d) farm-level practice choice. Solid lines indicate the national average values, and dashed lines are the surveyed farm average values.
Download figure:
Standard image High-resolution imageAlthough the average farm-level nitrogen fertilizer rate of 13.8 g nitrogen (N) kg−1 is close to national average rate (12.9 g N kg−1), the application rates per kg of harvested corn varied significantly among individual farms. Rates ranged from 4.6 to 29.2 g N kg−1 (figure 3(c)) because corn producers determine their N application rates in conjunction with other factors, such as yield goals, soil and climate conditions, and the N benefits from crop rotations and organic amendments. Therefore, there are significant variations in key farming inputs and the resulting yields.
Figure 3(d) summarizes the practice choices of the surveyed farms. More than half of the surveyed farms adopted manure and nitrification inhibitors, but only 20% of the farms planted cover crops in the 2017–2018 crop year. The survey also shows that farmers implemented a combination of different tillage practices on their fields. For the 57 983 ha of land surveyed, 64.8%, 7.6%, and 27.6% are conventionally tilled, not tilled, or less/minimally tilled, respectively.
Even though the benefits of planting cover crops and practicing conservation tillage have been widely reported in the literature (Rugani et al 2019, Liu et al 2020a), these farming practices have not been optimized to reduce feedstock-specific CI. A policy incentivizing low-carbon farming practices could encourage more farmers to make the shift, which would significantly increase the adoption rate of conservation practices.
3.2. CI distribution of 71 surveyed farms
As shown in figure 4, while there was a large variation in farm-level CI due to field-level inventory, the production-weighted average CI score for all surveyed farms was 209.6 g CO2e kg−1, comparable to the national average CI score of 203.8 g CO2e kg−1.
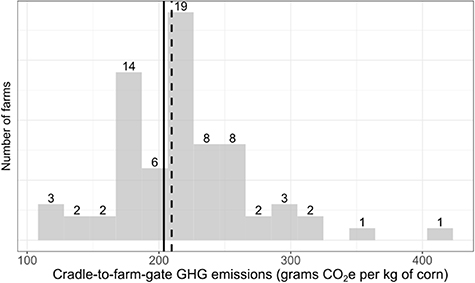
Figure 4. Distribution of CI among 71 farms. The solid and dashed lines indicate the national average CI and the surveyed farm average CI score, respectively.
Download figure:
Standard image High-resolution imageIn 2020, the GHG reduction credits under CARB's LCFS were traded with a price of approximately $200 per metric ton of CO2 reduced/sequestered (California Air Resources Board 2020). We applied this monetary credit to estimate the level of incentives available to feedstock producers for reducing farm-level CI. Among the surveyed farms, the one having the lowest CI (118.6 g CO2e kg−1) with a corn yield of 12.6 metric tons ha−1 would emit 1.49 metric tons of CO2e per hectare, while the one having the highest CI (407.5 g CO2e kg−1) with a corn yield of 6.3 metric tons ha−1 would emit 2.56 metric tons of CO2e per hectare. In a hypothetical scenario in which the farm having the highest CI would shift its agronomic practice to achieve the lowest CI observed in the survey, per-hectare CO2e emissions would be reduced by 1.07 metric tons. Low-CI farming practices, as already shown by lower-CI farms in the survey or otherwise presented in Liu et al (2020a), demonstrate the possibility of achieving such a reduction. In addition, novel technologies currently being developed may further reduce farm-level CI, such as improvements in crop genetics and 4R (right time, right place, right form, and right rate) nitrogen fertilizer management practices. Economic incentives provided by fuel regulatory programs, such as the CARB's LCFS, may encourage high-CI farms to change their practices. For example, the reduction of 1.07 metric tons of CO2e per hectare that it would take for a highest GHG-emitting farm to shift to the lowest CI practice in the survey would be equivalent to a premium of $214 ha−1 with the GHG reduction credit of $200 per metric ton under CARB's LCFS in 2020 (California Air Resources Board 2020).
3.3. Sensitivity analysis
A sensitivity analysis was conducted to evaluate the impacts of key farming inputs on cradle-to-farm-gate feedstock GHG emissions by varying one parameter at a time. We also looked at potential strategies for lowering the GHG emissions from the two largest contributors. Table 1 displays the key farming inputs and their potential ranges considered in the sensitivity analysis.
Table 1. Key farming inputs and their potential ranges considered in the sensitivity analysis.
| Inputs | Unit | Baseline a | Potential range a |
|---|---|---|---|
| Nitrogen fertilizer | g N kg−1 | 13.8 | 4.6–29.2 |
| Manure | metric ton ha−1 | 0 | 0–90 |
| Cover crop | — | No cover crop | Rye cover crop |
| Nitrogen fertilizer share | % | Urea (59), nitrogen solution (25), ammonia sulfate (7), monoammonium phosphate (5), diammonium phosphate (5) | A single nitrogen fertilizer type |
| Nitrification inhibitor use | — | No | Yes |
| Energy use | kJ kg−1 | 205.5 | 136.9–373.3 |
| Phosphate (P2O5) fertilizer | g P2O5 kg−1 | 4.7 | 0–12.9 |
| Energy share | % | Diesel (55), liquefied petroleum gas (35), electricity (2), natural gas (8) | A single energy source |
| Potash (K2O) fertilizer | g K2O kg−1 | 6.8 | 0–19.0 |
a The baseline value and potential ranges of each model input are estimated using the actual data from the 71 surveyed farms.
The baseline case assumes a corn–soybean rotation with no application of cover crop, manure, or nitrification inhibitors. Baseline values for rate data (N fertilizer use, energy use, etc) are defined by the production-weighted or area-weighted averages of the surveyed farms, and baseline values for the share data (N fertilizer share, energy share) are calculated from the survey results based on the production-weighted average for each energy source/nitrogen fertilizer type. The potential ranges for rate data are defined by the minimum and maximum application rates among the surveyed farms, and the ranges for the share data are bounded by the assumption that all nitrogen/energy demand was met by a single nitrogen fertilizer type/energy source.
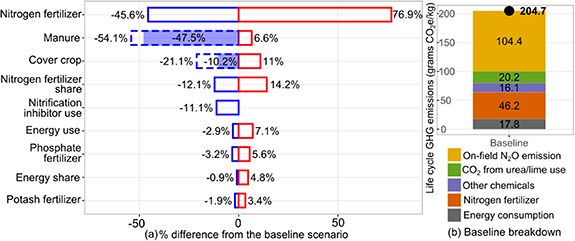
The sensitivity analysis confirms that the total nitrogen fertilizer application rate and the nitrogen fertilizer type are two important factors. The farm with the highest nitrogen fertilizer application rate has 77% higher cradle-to-farm-gate GHG emissions than the baseline, while the one with the lowest nitrogen fertilizer application rate has cradle-to-farm-gate GHG emissions 46% lower than the baseline. If the nitrogen fertilizer demand (13.8 g N kg−1) is met solely by monoammonium phosphate, the cradle-to-farm-gate GHG emissions are reduced by 12%. On the other hand, if the nitrogen fertilizer demand is entirely met by a nitrogen solution mix, the cradle-to-farm-gate GHG emissions increase by 14%. The application rates of other chemicals (lime, phosphate fertilizer, potash fertilizer, herbicides, and insecticides) also contribute to the variations in cradle-to-farm-gate GHG emissions, but with different magnitudes.
While planting cover crops and applying manure lead to increasing on-farm N2O emissions due to the extra nitrogen inputs to soil, these measures enhance the SOC stock. The impacts of rye cover crop and manure application on SOC at the U.S. county level presented in figure 5(a) were evaluated using a sophisticated process-based simulation model, as detailed in Liu et al (2020a). When we accounted for the SOC impact in the cradle-to-farm-gate GHG emissions, a net carbon reduction was obtained compared to the baseline case (figure 5(a)). Note that SOC sequestrated in fields by manure addition should be assessed under clear LCA system boundaries, since manures are often transported from off-site locations (i.e. animal feeding operations) to farms for use (Paustian et al 2019). While the GREET model tracks the carbon sources and fates for manure in other applications (e.g. in the waste-to-energy conversion pathways), we did not track the counterfactual carbon fates of alternative manure management in this paper. For the corn–rye–soybean system, if the positive contribution to SOC stock is accounted for, the net cradle-to-farm-gate GHG emissions are 10% lower than the baseline case. For the manure application scenario, the reduction in net cradle-to-farm-gate GHG emissions can be as high as 47.5%.
Figure 5. Impacts of key farming inputs on cradle-to-farm-gate GHG emissions per kg of corn harvested: (a) varying by parameter and (b) breaking down of baseline cradle-to-farm-gate GHG emissions. In (a), the solid-line red boxes and solid-line blue boxes depict the percentage of corn CI change by varying only the specified parameter to the upper and lower limit of the potential range defined in table 1, respectively, compared to the baseline scenario. The dashed-line blue boxes depict the impact of SOC change on cradle-to-farm-gate GHG emissions associated with rye cover crop and manure application modeled from Liu et al (2020a). In Liu et al (2020a), the SOC change rates were quantified for a 30 year time horizon in the 0–100 cm soil layer using a sophisticated process-based simulation model. The solid-area blue boxes indicate the net impacts of rye cover crop and manure on cradle-to-farm-gate GHG emissions if the changes in SOC are accounted for. In (b), the 'other chemicals' category includes GHG emissions from phosphate and potash fertilizer, lime, herbicide, and insecticide manufacturing.
Download figure:
Standard image High-resolution image
Changing farming practices to increase SOC stock has not been incentivized by regulatory programs, due to the lack of protocols for monitoring/verifying this variable and the permanency issue associated with SOC. Nonetheless, without properly accounting for the impacts of SOC change, farms shifting to conservation practices tied to carbon sequestration and abatement may not be adequately incentivized.
Figure 5(b) gives a breakdown of the baseline cradle-to-farm-gate GHG emissions to show which categories contribute the most. The largest contribution (51%) was on-field N2O emissions from fertilizer and biomass nitrogen inputs to soil. A potential strategy for reducing emissions in this category is to apply a nitrification inhibitor, which reduces N2O emissions from nitrogen fertilizer application by 30% (Thapa et al 2016) and reduces the CI of corn to 181.9 g CO2e kg−1, an 11.1% reduction over the baseline case.
The second largest contributor was nitrogen fertilizer manufacturing, adding 22.5% to the cradle-to-farm-gate GHG emissions. A potential strategy for reducing emissions in this category is to use nitrogen fertilizers produced from low-carbon ammonia. Ammonia serves as the building block for all nitrogen fertilizer types and is conventionally produced from steam methane reforming of natural gas, generating 2.55 g CO2e g−1 ammonia. Low-carbon alternative technology that produces ammonia using N2 from air separation and H2 from renewable-electricity-powered electrolysis of water is being demonstrated at pilot scale (Liu et al 2020b). The process from cradle-to-plant-gate emits only 0.22 g CO2e g−1 ammonia produced. By using low-carbon ammonia as the nitrogen fertilizer building block, the CI of corn is reduced by 19%, from 204.7 g CO2e kg−1 (the baseline case) to 165.6 g CO2e kg−1.
4. Discussion and ongoing work
4.1. Tool development and policy implications
If fuel regulatory programs like CARB's LCFS were to allow feedstock certification, the incentives, which would depend on the CI differences between farm-level and benchmark feedstock production, can be higher than the fixed incentives offered in this project. The potential for higher monetary rewards would likely drive more farmers to participate in such a market and change their practices to achieve lower-CI farming. To support this type of decision-making, we have developed a new tool—the feedstock carbon intensity calculator—that takes in farm-level inventory data and outputs feedstock-specific GHG emissions from cradle-to-farm-gate activities (Wang et al 2020, Liu et al 2020c). This tool will help stakeholders quantify farm-level CI variations in the corn feedstock produced under different farming practices and farming inputs. Currently, two versions of the tool are available: the dynamic version and the standalone version. The dynamic version interacts with the GREET model by directly reading the life-cycle inventory (LCI) data of key farming inputs from the model, which works well when users want to change the default settings of the GREET model related to farming inputs. The standalone version is well-suited to users who are not familiar with the GREET model and contains the default LCI data for key farming inputs from the GREET model. Both versions are available online at https://greet.es.anl.gov/tool_fd_cic.
Currently, LCFS certification is petitioned by individual biofuel production facilities. If feedstocks are allowed in LCFS CI certification, the contribution of feedstock CIs to biofuel CIs can be certified and realized by biofuel producers. We anticipate that the issued credits associated with CI reduction in feedstock will be partially passed onto farmers, though the degree of such passing-on is uncertain. We hope that by offering a tool such as the feedstock carbon intensity calculator we developed in this study, farmers and biofuel producers can together quantify the contribution of feedstock CI reduction to overall biofuel CI reduction. Such a transparent quantification will allow the issued credits to be fully passed on to farmers along the biofuel supply chain.
Farm-level feedstock certification could work in the same way as the current biofuel facility-level certification. With both levels of certification, low-carbon fuel regulations would incentivize low-carbon feedstock production as well as low-carbon fuel production. Historically, only low-carbon fuel production has been allowed in the LCFS certification, using a national averaged feedstock CI value to represent the contribution from feedstock CI to biofuel CI.
Concerns have been raised about LCFS credits being awarded to feedstock producers without actual GHG reductions through 'shuffling' and 'cherry-picking' low-CI feedstocks and ignoring high-CI feedstocks. 'Shuffling' means that biofuel producers sourcing lower-CI corn would sell their fuel in California for LCFS credits, while producers sourcing high-CI corn would sell their fuel to the rest of the U.S. without a penalty. 'Cherry-picking' means that corn ethanol producers sourcing corn from low-CI farms would report their low CIs to generate LCFS credits, while producers sourcing corn from high-CI farms would not report the feedstock-specific CI and use the default national-average value instead.
However, it is noteworthy that the default CI value for corn feedstock currently employed by the LCFS and the Renewable Fuel Standard was determined in 2009 with data collected for corn farming before 2009. Thus, the currently used default values in the two regulations do not reflect advances in corn farming since then. If this conservative default CI value is used as the benchmark, and the farm-level feedstock certification is based on the improved CI from recent agricultural advancements, farmers opting out of feedstock certification by choosing the default conservative CI value would help mitigate the adverse effects of shuffling. From this perspective, it is reasonable to expect that even though shuffling and cherry-picking may occur during the initial deployment of feedstock certification, the effects may be mitigated to some extent and could be transitory as feedstock producers gradually realize the monetary value of applying sustainable farming practices and participating in feedstock certification with CIs lower than default CI values. However, we acknowledge that the extent of shuffling and cherry-picking with the introduction of feedstock certification is not clear, and estimating it is beyond the scope of this analysis. Shuffling and cherry-picking could potentially be reduced with the introduction of an additional requirement that credits CI reduction resulting from a specific change in farming practice. This indeed poses a new opportunity to reach lower CIs for biofuels and incentivize leaders of farming.
In addition, it is worth mentioning that while in the early years of LCFS there may have been shuffling and cherry-picking related to biofuel production from facility-level certification, the trend of ten years of LCFS biofuel facility-level certification has demonstrated that facility-level certification has certainly had positive effects: driving down biofuel CIs from 2011 to 2019 in California, as shown in Rosenfeld et al (2020), and from 2005 to 2019 nationwide, as shown in Lee et al (2021).
Feedstock certification will open additional opportunities to reduce biofuel CI and thus help reduce California transportation fuel CI. While some view LCFS's goal of reducing CI by 20% between 2010 and 2030 as aggressive, accounting for the contribution from low-CI feedstocks by LCFS will introduce the role of sustainable farming practices in reducing biofuel CI, increasing the odds of achieving the 20% reduction goal.
4.2. Data monitoring and verification
Some data, such as fertilizer application rates, number of tillage passes, and yields were automatically recorded by the monitors on tractors. Other data, including cover crop mix and use of nitrification inhibitor, was collected through a more manual process, in which FBN's sustainability team called the farmers or visited their farms to collect data. As a result, an additional data verification step was required, including cross-checking with sales tickets, crop insurance, and purchase receipts.
FBN leveraged its online platform to perform digital audits and identified farms potentially reporting erroneous data. These data collection and verification protocols support an accurate and robust accounting of the GHG benefits of sustainable, low-carbon farming practices.
In this analysis, on-field N2O emissions were empirically estimated using IPCC and/or GREET emission factors along with nitrogen inputs from fertilizers and crop residues, while the changes in SOC were evaluated using a sophisticated process-based simulation model (Kwon et al 2020, Liu et al 2020a). A recent research program, Systems for Monitoring and Analytics for Renewable Transportation Fuels from Agricultural Resources and Management (SMARTFARM), developed by the U.S. Department of Energy's Advanced Research Projects Agency—Energy (ARPA-E), supports research to develop advanced sensors and monitoring technologies to monitor and measure on-field N2O emissions, which can eventually displace the estimated ones. The modeling approach to estimate SOC changes has been employed to provide the SOC implications of corn ethanol production (Dunn et al 2013, Qin et al 2018, Liu et al 2020a) and calibrated with measured SOC changes from the field (Kwon and Hudson 2010, Kwon et al 2017). In fact, this approach has also been used by the U.S. Environmental Protection Agency in its annual effort to estimate U.S. GHG emission/sink inventory (United States Environmental Protection Agency 2020) and by USDA for its voluntary carbon trading program (United States Department of Agriculture Natural Resources Conservation Service 2011). Building on its efforts to measure on-field N2O emissions, ARPA-E's SMARTFARM program is developing novel technologies to measure SOC fluxes at high spatial and temporal resolutions in a reliable, accurate, and cost-effective manner. As a result, the categories contributing most to the on-farm GHG emissions—on-field N2O emissions and SOC sequestration, which vary significantly with time and location—can be measured and verified at farm level rather than estimated using an empirical and/or process-based modeling approach.
4.3. Soil carbon sequestration potential
Although the SOC sequestrated by shifting farming practices has a high potential to mitigate GHG emissions from biofuel feedstock production, important issues regarding SOC quantification/measurement and permanency still need to be addressed when designing policy (Thamo and Pannell 2016). In our previous work, SOC change was quantified as the difference in SOC levels between farms adopting alternative farming practices and those maintaining baseline practices (Qin et al 2015, Liu et al 2020a). However, the determination of the baseline case itself is also subject to uncertainties. For example, for our sensitivity analysis, as in our previous study (Liu et al 2020a), we set the baseline practice as corn–soybean rotation with no application of cover crop, manure, or nitrification inhibitor (figure 5). According to the survey results, even though cover cropping was adopted by only 20% of the farms, the manure and nitrification inhibitor adoption rates were over 50% (figure 3(d)). If the baseline scenario is defined as the practices adopted by most of the surveyed farms, then the alternative baseline scenario would be corn–soybean rotation with application of manure and nitrification inhibitor but no application of cover crop. With different baseline scenarios, the SOC change value relative to the baseline scenario would be different as well. Thus, the SOC sequestration potential estimated from our previous study (Liu et al 2020a) and presented in this study in the sensitivity analysis should be interpreted with caution.
5. Conclusions
In this study, we collaborated with private sector companies to launch a pilot project in which farm-level operations data were collected for the calculation of feedstock-specific CI. Field-level data on 0.2 million metric tons of corn produced from 71 farms were collected by leveraging existing monitoring technologies, demonstrating the feasibility of operating such a program at scale. We found significant feedstock CI variations among the farms located close to POET's Chancellor ethanol plant—from 119 to 407 g CO2e kg−1 of corn—while the production-weighted average CI for all surveyed farms was 210 g CO2e kg−1, comparable to the national average CI of 204 g CO2e kg−1. We also identified nitrogen fertilizer application types and rates as key factors affecting the feedstock CI and proposed potential strategies for lowering the GHG emissions from these two largest contributors. Ongoing research to develop more accurate field-level monitoring and measurement tools/models of N2O and SOC fluxes will provide a more comprehensive portfolio for assessing the GHG impacts of biofuels.
Acknowledgments
This research was supported by the U.S. Department of Energy, Advanced Research Projects Agency–Energy, under Contract No. 18/CJ000/01/01. The authors thank Bob Whiteman from POET and Steele Lorenz from FBN for their collaboration on data collection and verification. The views and opinions of the authors expressed herein do not necessarily state or reflect those of the U.S. Government or any agency thereof. Neither the U.S. Government, nor any agency thereof, nor any of their employees, makes any warranty, expressed or implied, or assumes any legal liability or responsibility for the accuracy, completeness, or usefulness of any information, apparatus, product, or process disclosed, or represents that its use would not infringe privately owned rights.
Data availability statement
While aggregated data used in this study are presented in this paper, the data generated and analyzed for the 71 individual farms during the current study are not publicly available in order to protect individual farm proprietary information.
The data generated and/or analysed during the current study are not publicly available for legal/ethical reasons but are available from the corresponding author on reasonable request.