


Abstract
Heat and water stress can drastically reduce crop yields, particularly when they co-occur, but their combined effects and the mitigating potential of irrigation have not been simultaneously assessed at the regional scale. We quantified the combined effects of temperature and precipitation on county-level maize and soybean yields from irrigated and rainfed cropping in the USA in 1970–2010, and estimated the yield changes due to expected future changes in temperature and precipitation. We hypothesized that yield reductions would be induced jointly by water and heat stress during the growing season, caused by low total precipitation (PGS) and high mean temperatures (TGS) over the whole growing season, or by many consecutive dry days (CDDGS) and high mean temperature during such dry spells (TCDD) within the season. Whole growing season (TGS, PGS) and intra-seasonal climatic indices (TCDD, CDDGS) had comparable explanatory power. Rainfed maize and soybean yielded least under warm and dry conditions over the season, and with longer dry spells and higher dry spell temperature. Yields were lost faster by warming under dry conditions, and by lengthening dry spells under warm conditions. For whole season climatic indices, maize yield loss per degree increase in temperature was larger in wet compared with dry conditions, and the benefit of increased precipitation greater under cooler conditions. The reverse was true for soybean. An increase of 2 °C in TGS and no change in precipitation gave a predicted mean yield reduction across counties of 15.2% for maize and 27.6% for soybean. Irrigation alleviated both water and heat stresses, in maize even reverting the response to changes in temperature, but dependencies on temperature and precipitation remained. We provide carefully parameterized statistical models including interaction terms between temperature and precipitation to improve predictions of climate change effects on crop yield and context-dependent benefits of irrigation.
Export citation and abstract BibTeX RIS

Original content from this work may be used under the terms of the Creative Commons Attribution 4.0 license. Any further distribution of this work must maintain attribution to the author(s) and the title of the work, journal citation and DOI.
1. Introduction
The harvest we reap from our crop fields depend to large extent on the climatic conditions and their fluctuation (Porter and Semenov 2005). Temperature and precipitation explain one-third of global yield variation (Ray et al 2015). Climate change is expected to put pressure on crop production (IPCC 2019) and has already caused yield losses (Lobell et al 2011). Increased frequency of co-occurring high temperatures and low precipitation (Mazdiyasni and AghaKouchak 2015, Alizadeh et al 2020) suppresses crop yields by causing heat and water stress in the crop plants (Lesk et al 2016, Zscheischler et al 2017). Carefully parameterized yield models that include interaction terms between temperature and precipitation hold potential to improve predictions of climate change impacts on crop yield (Carter et al 2018).
Plant physiology and small-scale field and controlled-environment experiments tell us that stress combinations can have synergistic effects on yield formation (Suzuki et al 2014). Reduced water availability limits the plant's ability to regulate its temperature via evaporative cooling, thereby increasing its vulnerability to high temperatures (Siebert et al 2014, Neukam et al 2016). Experiments demonstrate how yields are more suppressed when heat and water stresses are combined than their summed effects when occurring in isolation (Prasad et al 2011, Mahrookashani et al 2017, Cohen et al 2021). Analyses of yields from arable fields with detailed climatic data show that interactive effects of precipitation and temperature or precipitation and vapor pressure deficit are needed to explain yield variation (Urban et al 2015, Carter et al 2018). Yet, the combined effects of heat and water stress on yields have often been overlooked in field-scale experiments and modeling (Rötter et al 2018).
The combined effects of precipitation and temperature have been examined for national crop yields. Yields across Europe were better explained with the bivariate return period of warm or cold temperatures and high or low precipitation total, compared with models relying only on temperature and precipitation (Zscheischler et al 2017). National maize and soybean yield losses were exacerbated in hot and dry seasons globally, in the USA and India (Matiu et al 2017), the American Midwest (Carter et al 2018, Kukal and Irmak 2018), and France (Hawkins et al 2013). But aggregating yields over vast geographical areas, such as with national data, can mask and average out adverse climatic conditions that often have more limited geographic range (Matiu et al 2017).
Crops respond to both seasonal average conditions and unfavorable conditions of shorter duration. Climatic conditions integrated over the growing season, such as precipitation totals and temperature means, are well correlated with crop yield across nations and regions (Lobell et al 2011, Osborne and Wheeler 2013, Challinor et al 2014, Zhao et al 2017). But averaging over the growing season can mask short-term but potentially damaging conditions, which can cause substantial yield losses (Lobell et al 2012, 2013, Troy et al 2015, Lesk et al 2016, Vogel et al 2019) depending on timing, duration, and intensity of the unfavorable conditions (Tack et al 2017). Analyses with a finer spatial and temporal resolution across large geographic areas and long time series, with climatic indices based on knowledge of plant physiological response to environmental stressors, could improve our understanding and predictions of climate impacts on yield.
Although crops are exposed to the same climatic conditions, yield can be differently affected under irrigated and rainfed cropping (Siebert et al 2017). Irrigation can, at least partially, mitigate negative effects from adverse climatic conditions on crop yields (Troy et al 2015, Leng 2017, Li and Troy 2018, Zhu et al 2019), directly by alleviating crop water stress (Zipper et al 2016) and indirectly by reducing heat stress through evaporative cooling (Siebert et al 2017, Tack et al 2017, Luan and Vico 2021). However, yield data collected across nations and regions are usually not separated into irrigated and rainfed yields. And, even where these data are available (as in parts of the USA), there is a lack of large-scale analysis of the interactive effects of temperature and precipitation on yield, explicitly considering the role of irrigated or rainfed cropping. Analyzing irrigated and rainfed crop yields from the same geographic location will elucidate the mitigating effects of irrigation on yields and how these effects might be linked to temperature and precipitation.
We explored the interactive effects of temperature and precipitation and the role of irrigation on fine-resolution (i.e. county-level) crop yields from the USA 1970–2010. We combined, for the first time, all of these factors in the same analysis, using county-level data, distinguishing irrigated and rainfed yields, and considering the interactive effects of temperature- and precipitation-related climatic indices. We considered two sets of climatic indices to capture different physiological mechanisms: (a) mean climatic conditions during the whole growing season (subscript GS), i.e. growing season precipitation total, PGS, and mean air temperature, TGS, and (b) shorter-term intra-seasonal conditions, as represented by maximum number of consecutive days with precipitation <2 mm during the growing season, CDDGS, and mean daily air temperature during this dry period, TCDD. We hypothesized that (a) there are compounded damaging impacts of combined high temperature and reduced water availability, which correspond to potential negative effects of heat and water stress, (b) irrigation reduces negative impacts of the two climatic stresses, both when occurring separately and when combined, and (c) measures of within-season conditions explain crop responses to heat and water stress at least as well as the whole season indices.
2. Materials and methods
2.1. Crop yields
We selected two staple crops, soybean and maize, grown both rainfed and irrigated, with a wide geographical distribution in the USA (supplementary information, SI, figure S1 (available online at stacks.iop.org/ERL/16/064023/mmedia)). County-level grain yield data for the period 1970–2010, separated for rainfed and irrigated cropping, were obtained from the US Department of Agriculture National Agricultural Statistical Service (Quick Stats; for details see SI S1.1).
2.2. Climatic indices and their calculations
We selected four climatic indices as candidate explanatory variables for crop yields to represent variation in air temperature and plant soil water availability during the growing season. The growing season was defined as the period between the local mean planting and harvesting dates (SI S1.3).
Two climatic indices were chosen to reflect air temperature and soil water availability during the whole growing season (subscript GS): mean daily air temperature averaged over the growing season (TGS), and total precipitation over the growing season (PGS), reflecting the input to the soil water balance.
Two climatic indices were chosen to represent conditions of shorter duration but linked to potential water and heat stresses within the growing season. The maximum number of consecutive dry days with daily precipitation less than 2 mm within the growing season (CDDGS) reflects the length of each season's longest dry spell, during which soil water availability is gradually reduced: the longer the period, the more likely the occurrence of water stress. The second intra-seasonal index was the mean daily air temperature during CDDGS (TCDD). While CDDGS can also fall in periods other than the warmest part of the growing season, CDDGS and TCDD describe conditions occurring at the same time, including the combination of potentially damaging heat and water stress. We repeated analyses described below also setting as threshold for a dry day daily precipitation of 0 and 1 mm, reaching similar conclusions.
To calculate the climatic indices, we used daily gridded data of precipitation and air temperature at 1/8° spatial resolution (Maurer et al 2002) and information on the timing and duration of the growing season at spatial resolution of 1/2° (Sacks et al 2010). These data were spatially aggregated at the county scale, before calculating the seasonal and intra-seasonal climatic indices (SI S1.2).
2.3. Statistical analyses and model predictions
We explored how crop yields varies with selected climatic indices and management (i.e. irrigated or rainfed cropping), via mixed effects statistical models explicitly including interactions of these drivers (e.g. Gałecki and Burzykowski 2013).
For each crop, the seasonal and intra-seasonal indices were analyzed in two separate statistical models, with yield (either maize or soybean yield) as dependent variable. Yields and climatic indices were not de-trended prior to analysis. Instead, the effect of likely trends from climate change and technological advances were considered by including time as the continuous variable t, as years elapsed from 1969. The fixed factors also included the precipitation-related index PGS for the seasonal and CDDGS for the intra-seasonal analysis, and the temperature-related index TGS for the seasonal and TCDD for the intra-seasonal analysis. Management M was included as categorical variable, for either irrigation or rainfed cropping. The two- and three-way interactions among the factors temperature, precipitation and management were added as fixed parts to the model. The resulting fixed part of the model reads:
where t is years elapsed from 1969, M is the management (M = 0 for rainfed and M = 1 for irrigated), and xP = PGS and xT = TGS for the seasonal statistical model and xP = CDDGS and xT = TCDD for the intra-seasonal one, i.e. two models were fitted for each crop. Regarding the coefficients, β0 is the model intercept and Δ0 the change in intercept from a shift from rainfed to irrigated cropping. Further, βi and Δi are the slopes describing the changes in yield explained by precipitation- and temperature-related indices (i = P or T respectively) and their interactions (i = PT), for rainfed cropping (βi ) and how these slopes are changed by a shift from rainfed to irrigated cropping (Δi ). To these models, we added as random factors the interaction between county and management M, to allow for different responses to irrigation and rainfed cropping in each county. We also added year as categorical variable to the random part of the model, to account for the covariance across large geographic areas in climatic conditions within a year. The model was fitted to the data across all counties, as detailed in SI, S2.1. No model simplification was done, because treatment interactions were an inherent part of this study.
The model estimates in table 1 enable calculations of yield outcomes under any temperature and precipitation within the explored range of climatic indices (SI S2.2). Below, we first explored the sensitivity of yield to changes in temperature- and precipitation-related indices. Second, we showed how the model can be used to predict impacts on yield from changes of climatic conditions in line with climate change projections. We show results for a 2 °C increase in both temperature indices, accompanied by reduced, unchanged or increased precipitation indices. We used currently observed climatic conditions each year and county as baseline. The percentage change was averaged over the years within each county.
Table 1. Model estimates, their standard errors (SE) and significance (p) from the linear mixed effects model for maize and soybean, for (a) whole growing season and (b) intra-seasonal indices, where M is water management and t is years elapsed from 1969. The model estimates (equation (1)) are presented with rainfed cropping as the baseline level for the categorical variable of management M. The marginal and conditional R2 give information on the goodness of fit of the model to data, i.e. the variation explained by the fixed factors alone and by the entire model including fixed and random factors, respectively.
| Maize | Soybean | ||||||
|---|---|---|---|---|---|---|---|
| Predictor | Symbol in equation (1) (units) | Estimate | SE | p | Estimate | SE | p |
| (a) Whole growing season results where xP = PGS and xT = TGS | |||||||
| Intercept | β0 (ton ha−1) | 4.184 | 5.912 × 10⁻¹ | <0.001 | 6.214 | 3.134 × 10⁻¹ | <0.001 |
| xP | βP (ton ha−1 cm−1) | 7.772 × 10⁻² | 1.055 × 10⁻² | <0.001 | −3.908 × 10⁻³ | 6.188 × 10⁻³ | 0.528 |
| xT | βT (ton ha−1 °C−1) | −1.921 × 10⁻¹ | 2.720 × 10⁻² | <0.001 | −2.463 × 10⁻¹ | 1.348 × 10⁻² | <0.001 |
| t | βt (ton ha−1 yr−1) | 1.057 × 10⁻¹ | 8.030 × 10⁻³ | <0.001 | 2.788 × 10⁻² | 2.486 × 10⁻³ | <0.001 |
| M | Δ0 (ton ha−1) | 2.612 | 7.201 × 10⁻¹ | <0.001 | −9.421 × 10⁻¹ | 3.696 × 10⁻¹ | 0.0108 |
| xP × M | ΔP (ton ha−1 cm−1) | −1.082 × 10⁻¹ | 1.431 × 10⁻² | <0.001 | −1.355 × 10⁻² | 8.076 × 10⁻³ | 0.0935 |
| xT × M | ΔT (ton ha−1 °C−1) | 1.551 × 10⁻¹ | 3.473 × 10⁻² | <0.001 | 1.108 × 10⁻¹ | 1.618 × 10⁻² | <0.001 |
| xP × xT | βPT (ton ha−1 cm−1 °C−1) | −1.925 × 10⁻³ | 5.051 × 10⁻⁴ | <0.001 | 7.125 × 10⁻⁴ | 2.724 × 10⁻⁴ | 0.00892 |
| xP × xT × M | ΔPT (ton ha−1 cm−1 °C−1) | 3.575 × 10⁻³ | 6.884 × 10⁻⁴ | <0.001 | 4.751 × 10⁻⁶ | 3.580 × 10⁻⁴ | 0.989 |
| Number of observations | 15 580 | 10 148 | |||||
| Marginal R2 | 0.723 | 0.657 | |||||
| Conditional R2 | 0.883 | 0.829 | |||||
| Maize | Soybean | ||||||
| Predictor | Symbol in equation (1) (units) | Estimate | SE | p | Estimate | SE | p |
| (b) Intra-seasonal results where xP =CDDGS and xT = TCDD. | |||||||
| Intercept | β0 (ton ha−1) | 2.575 | 2.526 × 10⁻¹ | <0.001 | 1.662 | 1.052 × 10⁻¹ | <0.001 |
| xP | βP (ton ha−1 d−1) | −9.323 × 10⁻³ | 4.923 × 10⁻³ | 0.0583 | −7.997 × 10⁻³ | 3.871 × 10⁻³ | 0.0389 |
| xT | βT (ton ha−1 °C−1) | −1.660 × 10⁻² | 6.535 × 10⁻³ | 0.0111 | −8.702 × 10⁻³ | 3.660 × 10⁻³ | 0.0174 |
| t | βt (ton ha−1 yr−1) | 1.087 × 10⁻¹ | 8.606 × 10⁻³ | <0.001 | 2.836 × 10⁻² | 2.410 × 10⁻³ | <0.001 |
| M | Δ0 (ton ha−1) | 4.296 | 1.992 × 10⁻¹ | <0.001 | 7.095 × 10⁻¹ | 1.184 × 10⁻¹ | <0.001 |
| xP × M | ΔP (ton ha−1 d−1) | −2.323 × 10⁻² | 6.731 × 10⁻³ | <0.001 | 2.198 × 10⁻³ | 5.179 × 10⁻³ | 0.671 |
| xT × M | ΔT (ton ha−1 °C−1) | −1.754 × 10⁻² | 9.048 × 10⁻³ | 0.0525 | 6.161 × 10⁻⁴ | 4.978 × 10⁻³ | 0.902 |
| xP × xT | βPT (ton ha−1 d−1 °C−1) | −3.342 × 10⁻⁴ | 2.559 × 10⁻⁴ | 0.192 | −3.523 × 10⁻⁴ | 1.672 × 10⁻⁴ | 0.0352 |
| xP × xT × M | ΔPT (ton ha−1 d−1 °C−1) | 1.807 × 10⁻³ | 3.519 × 10⁻⁴ | <0.001 | 5.607 × 10⁻⁴ | 2.252 × 10⁻⁴ | 0.0128 |
| Number of observations | 15 580 | 10 148 | |||||
| Marginal R2 | 0.695 | 0.577 | |||||
| Conditional R2 | 0.874 | 0.794 | |||||
3. Results
As expected, increasing temperature reduced rainfed yields (negative coefficient for TGS in table 1(a)). Precipitation increased yields in both crops, but more so in maize than soybean (table 1, figure 1). Irrigated crops yielded consistently more than rainfed crops (figure 2). There were also several significant two- and three-way interactions among management, precipitation and temperature, for both whole season and intra-seasonal climatic indices (table 1). Hence, yields depended on the combination of temperature and precipitation, which also altered the benefit from irrigation (figures 3 and S7 in the SI). Yields increased over the years (positive coefficient for t in table 1). The explanatory powers of the whole season and intra-seasonal models were similar, although models based on whole season climatic indices explained somewhat more of the yield variation (marginal R2 in table 1).

Figure 1. Crop yields as a function of temperature- and precipitation-related climatic indices for (a) whole growing season total precipitation (PGS) and mean daily temperature (TGS), and (b) for intra-seasonal largest number of consecutive dry days (CDDGS) and mean daily temperature during this period (TCDD). The contour plots are based on the fixed part of the statistical model (equation (1)), with coefficient estimates for maize and soybean (table 1), and are relative to rainfed (left) and irrigated (right) cropping. Yields refer to year 1991, i.e. the middle-point of the period considered. The ranges of the climatic indices correspond to those of the observations (SI, figure S3).
Download figure:
Standard image High-resolution image
Figure 2. Crop yield gain by irrigation, i.e. percent change in crop yield with irrigation, using rainfed yield obtained under the same climatic conditions as baseline, as a function of seasonal (left) and intra-seasonal (right) climatic indices, for maize (top) and soybean (bottom). The contour plots are based on the fixed part of the statistical model (equation (1), estimates in table 1), calculated for irrigated (M = 1) and rainfed (M = 0) cropping, for the year 1991. The white area in the top left corner of (c) depicts conditions for which rainfed yield was very low (figure 1), leading to increases in yields with irrigation greater than 250%.
Download figure:
Standard image High-resolution image
Figure 3. Response of crop yield Y to a unitary change in (a) whole seasonal mean daily temperature (TGS), (b) total growing season precipitation (PGS), (c) mean temperature during the longest dry spell within the season (TCDD), and (d) duration of the longest dry spell within the season (CDDGS), for maize (solid arrows) and soybean (dotted arrows), and for rainfed (dark green) and irrigated (light blue) cropping, as predicted by the fixed effects of the model (equation (1)) table 1; see also SI, equations S1 and S2). For each climatic index, i.e. in each panel, the response is calculated at two values of the other climatic index included in the model (denoted with subscript 0): these values correspond to the 20th (left four arrows) and 80th (right four arrows) percentiles of the values of the climatic index in the data, averaged between maize and soybean. Other choices of percentiles lead to similar patterns, albeit not identical arrow lengths due to the interactions of precipitation and temperature indices.
Download figure:
Standard image High-resolution image3.1. Rainfed yield responses to whole growing season climatic conditions
The mean seasonal daily temperature (TGS) and seasonal accumulated precipitation (PGS) affected rainfed yields in both maize and soybean (table 1(a)), where high temperature and low precipitation gave the lowest yields (table 1(a), figure 1(a)). The interaction xP ×xT was significant, i.e. the effects on yield of temperature and precipitation were not equal across their respective ranges (table 1(a), figure 3). For instance, at a seasonal precipitation of 280 mm there was a loss of 0.25 ton ha−1 of maize per °C rise in temperature, while at 490 mm precipitation the loss increased to 0.29 tons ha−1 °C−1 (solid green arrows in figure 3(a)). Hence, a 1 °C rise in temperature had a larger negative impact on maize yields at higher precipitation totals. The reverse was true for soybean. At 280 mm precipitation 0.23 ton ha−1 soybean were lost for °C increase in temperature, but at 490 mm precipitation the loss was 0.21 ton ha−1 °C−1 (dotted green arrows in figure 3(a)).
Precipitation increased maize yields more at low than at high temperatures: a 10 mm increase in precipitation at 19 °C increased maize yield by 0.041 ton ha−1, while the same precipitation increase at 23 °C increased the yield by 0.033 ton ha−1 (solid green arrows in figure 3(b)). Again, the reverse was true for soybean, where 10 mm more precipitation increased yield only by 0.0096 ton ha−1 at a low temperature, but 0.012 ton ha−1 at a high temperature. The difference between maize and soybean can also be seen in the curvature in the surface plots, convex in maize and concave in soybean (figure 1(a)).
3.2. Rainfed yield responses to intra-seasonal climatic conditions
Long dry spells (high CDDGS) and high mean temperatures during the dry spell (high TCDD) reduced yields in both soybean and maize (table 1(b), figure 1(b)). For each °C rise during dry spell, yields were reduced more during longer dry spells for soybean, but not significantly so for maize (table 1(b), green arrows in figure 3(c)).
A lengthening of the dry spell by 1 d reduced yields at both low and high temperatures (green solid arrow figure 3(d)), but yields were slightly more reduced per day of dry spell lengthening at high compared with low temperatures during the dry spell for maize, but not significantly so for soybean (xP × xT in table 1(b), green dotted arrow figure 3(d)).
3.3. Irrigated yield responses to whole growing season climatic conditions
Irrigation increased both maize and soybean yields (figures 1 and 2, table 1(a)), except under the lowest and wettest conditions (dark red area figure 2). Irrigation dampened and sometimes reversed the effects of temperature and precipitation changes on yield, but the interactive effects of temperature and precipitation remained for maize, but not for soybeans (xP × xT × M in table 1(a); figures 2 and 3). For instance, at a seasonal precipitation of 280 mm there was an increase of 0.0092 ton ha−1 of irrigated maize per °C rise in temperature, but a 0.044 ton ha−1 °C−1 increase at 490 mm precipitation (solid blue arrows in figure 3(a)). Hence, irrigation reverted negative impacts of high temperature in rainfed maize. Irrigated soybean continued to lose yield with increasing temperature, but less so compared with rainfed cropping. Irrigation benefits were larger at high precipitation (figure 2(b), dotted blue arrows in figure 3(a)).
Irrigation reduced the effects of precipitation changes. A 10 mm increase in precipitation resulted in a maize yield increase smaller than in rainfed cropping, and the increase was higher at warmer temperatures (solid blue arrows in figure 3(b)). Irrigated soybean yields instead declined by 0.0038 ton ha−1 at low and 0.00096 ton ha−1 at high temperatures per 10 mm added precipitation (dotted blue arrows in figure 3(b)).
3.4. Irrigated yield responses to intra-seasonal climatic conditions
Irrigation enhanced yields in both maize and soybean across dry spell lengths and temperatures (table 1(b), figure 2), and dampened and sometimes reversed effects of changes in dry spell length and temperature on yield, with significant three-way (xP × xT × M) interactions in both crops (table 1(b), figure 3). In maize, irrigation increased yields with a rise in temperature during longer, but not shorter, dry spells (blue solid arrows in figure 3(c)). Irrigation reduced soybean yield loss per °C increase during the dry spell slightly more at long compared with short dry spells (blue dotted arrows in figure 3(c)). The patterns were the same for a lengthening of the dry spell, at low or high dry spell temperatures (figure 3(d)).
4. Discussion
Based on detailed crop yield information from counties across the USA, in which rainfed and irrigated cropping co-exist, we provide climatic models that explain up to 72% and 66% of maize and soybean yield variability. This is an improvement compared with other analyses (e.g. Ray et al 2015, Zampieri et al 2017, Zhu et al 2019), we believe at least partially thanks to the use of county-level data, separately observed rainfed and irrigated yields, and explicitly including the interactions between precipitation- and air temperature-related climatic indices. As expected, high temperatures reduced rainfed maize and soybean yields (Schlenker and Roberts 2009, Schauberger et al 2017). These declines were accelerated by low precipitation (Lobell and Field 2007, Zscheischler et al 2017, Feng and Hao 2020). Maize and soybean yields decreased particularly under warm and dry weather. In addition, interaction terms between whole season temperature and precipitation indices were significant for rainfed yields, except for soybean yields explained by intra-seasonal climatic indices (table 1). This was in agreement with previous results in four states in the USA (Carter et al 2018), but not with an analysis based on national yield data, where interactions were found for some crops and nations, but not for soybean and maize in the USA (Matiu et al 2017). The interaction terms signify that the yield change due to rising temperature or precipitation differs depending on how warm and dry the conditions are (figure 3). For instance, rainfed soybean yields declined faster with rising temperature in dry conditions and benefitted more by precipitation increase under warmer conditions.
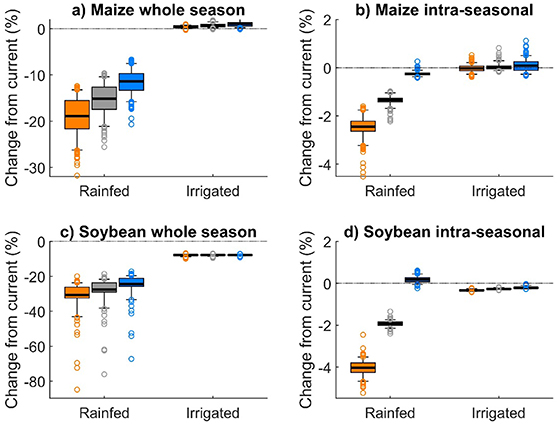
Compared with soybean, maize has higher total evapotranspiration (Suyker and Verma 2009) and optimal precipitation requirement (Dietzel et al 2016), but lower optimal temperature for grain filling and critical temperature for yield reduction (Schlenker and Roberts 2009, Hoffman et al 2020). Soybean yield was indeed less responsive than maize to an increase in growing season temperature and precipitation (figures 3(a) and (b)), but responses were similar for changes in intra-seasonal indices (figures 3(c) and (d)). In relative terms, the mean yield reduction for the USA per degree warming has been estimated to 10.3% for maize and 6.8% for soybean (Zhao et al 2017). Other analyses suggest losses up to 30% (Rose et al 2017) and extreme variability across states (Mourtzinis et al 2015). For maize, the first set of estimates fits well our predicted mean yield reduction across counties of 15.2% with a 2 °C temperature increase given no change in precipitation (figure 4 gray boxes). However, the corresponding relative loss in rainfed soybean amounted to 27.6%. This loss is larger than the estimates mentioned above, but our estimation does not account for the potential mitigation from enhanced air CO2 concentration, which will be greater in C3 species, such as soybean, than in C4 species (Makowski et al 2020). For both crops, the losses due to an increase in temperature were exacerbated by a concurrent reduction in precipitation or lengthening of dry spells (figure 4 orange boxes). The exact mechanism for the different sensitivities to combined changes in temperature and precipitation are complex and mediated by the timing of heat and water stress, with some particularly sensitive crop phenological stages (Hoffman et al 2020).
Figure 4. Distribution of county-average percent changes in yield, as calculated based on the fixed part of the statistical model (equation (1), estimates in table 1) for three expected effects of climate change on temperature and precipitation for maize (top) and soybean (bottom), based on climatic indices describing growing season (left, PGS and TGS) and intra-seasonal (right, CDDGS and TCDD) conditions. We present yield changes predicted by the statistical model in equation (1) from a 2 °C increase in temperature-related indices (TGS in the left column and TCDD in the right column). To this warming, we superimpose three shifts in precipitation: (a) a 10% reduction in PGS and increase in CDDGS (orange box, left), (b) unaltered PGS and CDDGS (gray box, center), and (c) a 10% increase in PGS and reduction in CDDGS (blue box, right). In all cases, the relative change in yield is calculated using as baseline the yield predicted by the model under currently observed climatic conditions in the same year and county. A single data point per county is included in the box plots, representing the percentage change averaged over all the years for which data are available. Horizontal bars are means, boxes extend from the 1st to the 3rd quartile, whiskers from the 5th to the 95th percentiles, and symbols are points outside this range.
Download figure:
Standard image High-resolution image
The two analyses, based on whole growing season or intra-seasonal climatic indices, provide complementary information. The intra-seasonal model had high explanatory power, just slightly lower than the whole season model (70% vs 72% variation explained for maize and 58% vs 66% for soybean, table 1), showing that unfavorable conditions with short duration are important determinants of yield. The slightly lower performance can be partially explained by the larger role of soil moisture at the beginning of the longest dry spell compared with that at the beginning of the growing season. Further, the timing of the longest dry spell was spread during the growing season, i.e. the longest dry spell did not necessarily co-occur with the warmest seasonal temperatures (SI, figure S4). Considering the timing and shift in timing of dry spells (Breinl et al 2020) might improve predictions and support management decisions (Zipper et al 2016).
The choice of whether to irrigate or not has large impacts on crop yields and their dependence on climatic conditions, underlining the importance of explicitly evaluating the outcomes of rainfed and irrigated agriculture when assessing the role of climatic conditions. In general, irrigation increases yields by reducing the negative effects of dry and hot weather conditions or both (Zhang et al 2015, Leng 2017, Tack et al 2017, Li and Troy 2018). Here, irrigation was most effective in enhancing yields under conditions of low precipitation or extended dry spells and high temperatures (figure 2), when water shortage is most likely and extreme and rainfed yields were low (figure 1). In the central USA, irrigation was able to reduce the combined effects of precipitation and accumulated extreme temperatures in maize and soybean (Zhang et al 2015), as well as the effects of dry spells, precipitation totals and several types of temperature extremes in isolation (Troy et al 2015). In another analysis, the marginal gain of irrigation was reduced as seasonal precipitation increased in both maize and soybean, but temperature had a less definite effect (Li and Troy 2018).
Irrigation also reduced the dependence of crop yields on climatic conditions (shorter blue than green arrows in figure 3) and in some cases even reverted the direction of response. Irrigation mitigated and in the case of maize reverted the effects of increased temperature, pointing to the importance of water availability to alleviate also heat stress by supporting evaporative cooling. In the case of soybean, irrigation mitigated, but did not cancel the negative effects of increased temperature (figure 3(a)), in agreement with local and global analyses (Tack et al 2017, Agnolucci et al 2020). This underlines the importance of reducing water stress to increase the optimal temperature for crop yield and stave off the negative effects of high temperatures (Siebert et al 2017, Agnolucci et al 2020). Irrigation also reduced the positive effects of an increase in precipitation in maize, while a shift from positive to negative dependence of yields on precipitation when shifting from rainfed to irrigation cropping emerged in soybean (figure 3(b)). We speculate that maize, with its higher water demands and lower optimal temperature for grain filling, always benefited from enhanced water availability. Conversely, irrigation in soybean fulfilled its lower water demands and allowed it to exploit the additional sunshine provided by reduced precipitation (Zhang et al 2015).
Although being an effective adaptation strategy to increasingly dry and hot climates (figures 2–4), irrigation is in many regions unsustainable to expand or impossible to implement due to water scarcity (Wada et al 2012, Rosa et al 2020). In the American Midwest, for instance, irrigation relies on groundwater, which is already overexploited (Scanlon et al 2012). Irrigation can also lead to soil salinization and exacerbate pollution of surface- and ground-water via salt mobilization and nutrient leaching (Scanlon et al 2007). To avoid these issues, and with expected higher temperatures, more intermittent precipitation and reductions in summer precipitation totals, soil and crop management other than irrigation will be required to minimize the need for migration from exposed crop cultivation areas (Sloat et al 2020). Adaptation practices include growing drought- and heat-tolerant varieties and crops (Tack et al 2016), altering sowing dates (Lobell et al 2014, Mourtzinis et al 2019), enhancing soil water retention capacity through, for instance, conservation tillage, cover crops and organic soil amendments (e.g. Lal 2004, Pittelkow et al 2015, Kaye and Quemada 2017) and diversifying crop rotations (Bowles et al 2020, Marini et al 2020).
5. Conclusions
We confirm drastic yield reductions of maize and soybean under combined hot and dry conditions, which are likely to induce heat and water stress in the crops. Both maize and soybean yields declined with increased temperature and decreased precipitation. The interaction terms between temperature and precipitation in the statistical models showed that yield changes from increasing temperature or decreasing precipitation differed depending on climatic conditions, where rainfed yields were reduced more rapidly with warmer temperatures in dry conditions for soybean and wet conditions for maize. Irrigation increased and stabilized yields and alleviated both water deficit and high temperatures.
Acknowledgments
This research was funded by the Swedish Research Council Vetenskapsrådet Grant 2016-04910 to G V and X L, and Grant 2016-06313 to G V and A S; by the Swedish Research Council for Sustainable Development FORMAS Grant 2018-02872 to G V and R B; and by the Bolin Centre for Climate Research (RA7) to A S.
Data availability statement
No new data were created or analyzed in this study.