

Abstract
Over 70% of the 62 million hectares of cropland in the Midwestern United States is grown in corn-based rotations. These crop rotations are caught in a century-long simplification trend despite robust evidence demonstrating yield and soil benefits from diversified rotations. Our ability to explore and explain this trend will come in part from observing the biophysical and policy influences on farmers' crop choices at one key level of management: the field. Yet field-level crop rotation patterns remain largely unstudied at regional scales and will be essential for understanding how national agricultural policy manifests locally and interacts with biophysical phenomena to erode—or bolster—soil and environmental health, agricultural resilience, and farmers' livelihoods. We developed a novel indicator of crop rotational complexity and applied it to 1.5 million fields across the US Midwest. We used bootstrapped linear mixed models to regress field-level rotational complexity against biophysical (land capability, precipitation) and policy-driven (distance to the nearest biofuel plant and grain elevator) factors. After accounting for spatial autocorrelation, there were statistically clear negative relationships between rotational complexity and biophysical factors (land capability and precipitation during the growing season), indicating decreased rotation in prime growing areas. A positive relationship between rotational complexity and distance to the nearest biofuel plant suggests policy-based, as well as biophysical, constraints on regional rotations. This novel RCI is a promising tool for future fine-scale rotational analysis and demonstrates that the United States' most fertile soils are the most prone to degradation, with recent policy choices further exacerbating this trend.
Export citation and abstract BibTeX RIS
1. Introduction
Biological simplification has accompanied agricultural intensification across the world, resulting in vast agricultural landscapes dominated by just one or two crop species. The US Midwest is a prime example [1], where corn currently dominates at unprecedented spatial and temporal scales. An area the size of Norway is planted in corn in the Midwest in any given year [2] with little variation in crop sequence; over half of Midwestern cropland is dedicated to corn-soy rotations and corn monoculture [3]. Directly and indirectly, this agricultural homogeneity causes environmental degradation that harms ecosystem health [4–7] while also contributing to climate change [8] and increasing vulnerability to climate shocks [9].
Agricultural diversification in space and time reverses this trend towards homogeneity with practices like crop rotations that vary which harvested crops are grown in a field from year to year. Crop rotations are a traditional agricultural practice with ample evidence that complex rotations—ones that include more species that turn over frequently—benefit farmers, crops, and ecosystems [10–12]. As one of the principles underlying soil health, diverse crop rotations promote soil properties that provide multiple ecosystem services, including boosting soil microbial diversity [13, 14], enhancing soil fertility [15, 16], improving soil structure [17–20] and reducing pest pressure [7, 21]. These soil benefits combine to increase crop yields [17, 22–24] and stabilize them in times of environmental stress [25–27]. Crop rotation's environmental and economic benefits typically increase with the complexity of the rotation [11, 28, 29] (as defined by the number of species in rotations and the frequency of their turnover), while conversely, biophysical aspects like soil structure and microbial populations are degraded as rotations are simplified [12, 20, 30, 31].
Despite its benefits, crop rotational complexity continues its century-long decline in the US Midwest [32–36]. Corn-soy rotations increasingly dominate over historical crop sequences that included small grains and perennials, with corn monocultures (corn grown every year) also on the rise [1]. This increasing simplification is in part the result of a set of interlocking, long-standing federal policies aimed at maximizing production of a handful of commodity crops that distort farmers' economic incentives.
Regional rotation simplification is clear from analyses of crop frequency [33, 34], county-level data [7], and farmer interviews [35]. However, fine-grained patterns that more completely reflect farmers' rotational choices across the region, and how those choices relate to influences from policy and biophysical factors that play out across agricultural landscapes, remain largely unstudied. This knowledge is essential for understanding how national agricultural policy manifests locally and interacts with biophysical phenomena to erode—or bolster—soil and environmental health, agricultural resilience, and farmers' livelihoods.
Biofuel mandates [32, 37–39] and concerted efforts to craft industrial livestock systems as end-users of these corn production systems [40, 41] make corn lucrative above other commodities, while federal crop insurance programs push farmers to limit the number of crops grown on their farms [42–44]. These policies, along with the current corporate food regime [45], drive pervasive economic incentives to grow corn, and farmers must increasingly choose between growing corn as often as possible to provide a source of government guaranteed income [35], and maximizing soil benefits and annual yields through diversified rotations. These policies both alter agricultural economics at a national level by boosting corn prices and manifest locally in grain elevators and biofuel plants that create pockets of high corn prices with rising demand closer to each facility [37].
Biophysical factors like precipitation and land capability (an area's capacity to grow crops based on soils and geography) that are highly localized and spatially heterogeneous can catalyze or impede this simplification trend. For example, increasing rotational complexity is one strategy that farmers may employ to manage marginal soils or greater probability of drought, while ideal soil and climate conditions allow for rotation simplification to be profitable, at least in the short run [5].
As these top-down and bottom-up forces combine, we ask: how do farmers optimize crop rotational diversity in complex social-ecological landscapes, with top-down policy pressures to simplify intertwined with bottom-up biophysical incentives to diversify? (figure 1). Because biophysical factors and even policy influences (e.g. high prices near biofuel plants) vary greatly at the field scale at which management decisions occur, an approach is needed to assess patterns of crop rotation that can capture simplification and diversification at this scale. Though remotely sensed data on crop types can now show fine-scale crop sequences, previous approaches to quantify rotational complexity have relied on classifying rotations based on how often a certain crop appears in a region over a given time period [33, 34], aggregating over large areas [7], or examining short (3–4 years) sequences [33, 34, 46]. To date, methods to capture rotational complexity have therefore been unable to address management decisions at the field scale (in the case of aggregation), and/or lose valuable information about the number of crops present in a sequence and the complexity of their order (in the case of crop frequency and short sequences). At the other end of the spectrum, farmer surveys have impressively detailed the economic and biophysical considerations that go into farmers' rotation decisions [35], yet are limited by the number of farmers they can reach and who chooses to respond.
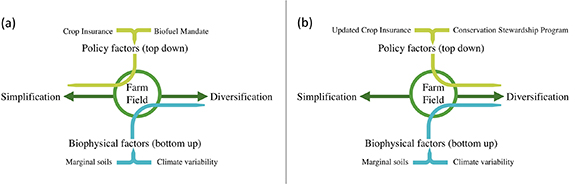
Figure 1. Schematic of diversification vs simplification drivers. Schematic of diversification vs simplification drivers in the current policy climate (a), and if policies are reformed to encourage crop system diversification (b). In this study, we ask how farmers optimize crop rotational diversity as top-down policy pressures and bottom-up biophysical limits combine on farm fields in the US Midwest.
Download figure:
Standard image High-resolution imageHere, we explore how aspects of farm landscapes influence field-scale patterns of crop rotational complexity across the US Midwest. We developed the first field-scale dataset of rotational complexity in corn-based rotations, covering 1.5 million fields in eight states across the Midwest and ranking crop sequences based on their capacity to benefit soils. We examined rotations from 2012 to 2017 to coincide with the introduction of the renewable fuel standard, or 'biofuel mandate', which took full effect in 2012. We then correlated fields' rotational complexity with biophysical factors (land capability and rainfall during the growing season) and policy outcomes (proximity to biofuel plants and grain elevators), using bootstrapped linear mixed models to account for spatial autocorrelation in the data. By identifying spatially explicit predictors of rotational complexity, we illuminate how top-down policy pressures combine with biophysical conditions to create fine-scale simplification patterns that threaten the quality and long-term productivity of the United States' most fertile soils.
2. Methods
We focused our analysis on the eight Midwestern states with the highest corn acreage (Illinois, Indiana, Iowa, Kansas, Minnesota, Missouri, Nebraska, and Ohio) [2]. We considered the 6 year period from 2012 to 2017, which coincides with the introduction of the renewable fuel standard in 2012. After deriving a novel field-scale rotational complexity index (RCI), we used spatially blocked bootstrapped regression to assess how key landscape factors associated with this indicator. These statistical methods account for overly confident parameter estimates that arise in naïve models due to spatial autocorrelation in the data. All analyses were conducted in R [47].
2.1. Calculation of RCI
We compiled a dataset that shows the crop sequence (cash crops only; cover crops are not detected by the Cropland Data Layer) on each field in the study area (see 'datasets' below) and used these sequences as a proxy for crop rotation to derive a novel indicator of rotational complexity that could be applied at the field scale. To date, no metric exists that can supply both the flexibility of quantifying different length rotations that occur in the same time period, and the specificity of operating at the field level.
We adapted the rotational diversity index (d) of previous studies [25, 48] that quantifies the diversity of a known rotation as a function of the length of the rotation (l, in years) and the number of crops in the rotation (n):

to accommodate large-scale, remotely-sensed data (see supplement for further details). Instead of trying to identify common rotations of a known length, we observed a fixed-length sequence (in our case, 6 years) of crops in a given field, and replaced rotation length (l) with species turnover from year to year (T1), and turnover every 2 years (T2). For example, in a 6 year crop sequence ABABAB, T1 = 5 and T2 = 0, while for ABCABC, T1 = 5 and T2 = 4. We also added a pseudo-turnover (Tp) equal to the number of times a duplicate perennial appears in a field in two consecutive years (e.g. alfalfa–alfalfa), as perennial crops typically provide soil benefits [49–52] but would otherwise be penalized by the metric for their low turnover. For example, in a 6 year crop sequence APPAAA, where A is an annual crop and P is a perennial, T1 = 2, T2 = 3, and Tp = 1 for a total turnover score of 6, whereas if P were an annual the total turnover would be 5. This adjustment makes the turnover term for consecutive perennials equivalent to the turnover if different annuals were grown in each year that the perennial is repeated.
The resulting metric:
yields a single value that can compare rotational complexity across any crop sequence of a given length and can be applied at fine scales with low computational costs (figure 2). The metric is able to cut through 'messy' data with unusual or unexpected crop rotations to sort sequences in terms of their expected potential to benefit soils (see representative RCI values in table 2).
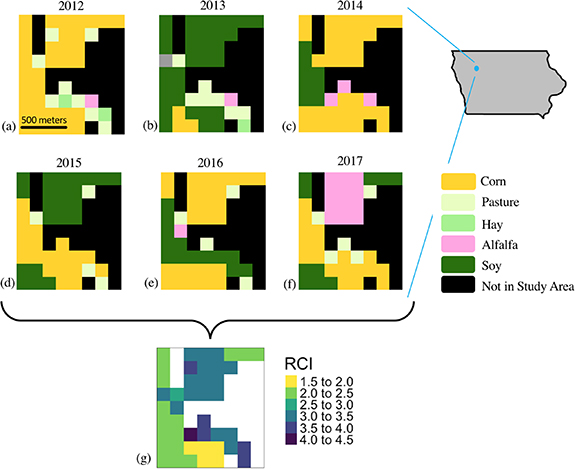
Figure 2. Construction of the RCI. Example of a small area out of the eight focal US Midwest states for which a metric of crop rotation complexity (RCI) was calculated. This section of Northwestern Iowa, USA shows 6 years of crops (a–f), as determined by the cropland data layer, grown in the same area. Each individual pixel sequence is combined into an RCI score (g) using equation (2). Any pixel that does not include corn in its sequence in any of the 6 years is not included in the analysis (areas in black). Each pixel represents 2.25 ha.
Download figure:
Standard image High-resolution imageTable 1. Datasets used in the analysis.
| Variable | Description | Resolution (for rasters) | Source |
|---|---|---|---|
| Land capability (NCCPI) | National Commodity Crop Productivity Index (NCCPI), highest value from corn/soy, cotton, and small grain submodels | 30 × 30 m | gSSURGO [53] |
| Grain elevator distance (km) | Distance to the nearest grain elevator | 30 × 30 m | Businesses with SIC code 51530100, 51530102, 51539901, or 51530204 in the 8 focal and 11 surrounding states; data queried in 2019 [54] |
| Biofuel distance (km) | Distance to biofuel production plant | 30 × 30 m | Businesses with NAICS code 325193 in focal and surrounding states; data queried in 2019 [55] |
| Mean rainfall (in) | Mean precipitation during the 2012–2017 growing seasons | 0.05° | CHIRPS [56] |
| Rainfall variance (in2) | Variance in precipitation during the growing season in the 2012–2017 study period | 0.05° | CHIRPS [56] |
| Field size (ha) | Area of field | 30 × 30 m | Yan and Roy [57] |
| State | US state | NA | US Census Bureau [58] |
Table 2. Summary of RCI values and associated attributes. Across the study area there were 19 unique RCI values ranging from corn monoculture (0) to a different crop grown in each of the 6 years (5.2). Each RCI value (other than zero) can correspond to multiple crop sequences, e.g. CCCCSC, CCSCCC, and CCWCCC would all have an RCI of 1.73. We give an example from the dataset of a sequence that corresponds to each RCI level; however, the options are nearly limitless. In these example rotations, C = corn, S = soy, O = oats, W = wheat, A = alfalfa (perennial), P = pasture (perennial).
| RCI | RCI area (ha) | Percent of study area | Percent of fields | Example rotation |
|---|---|---|---|---|
| 0.00 | 1 974 302 | 4.49% | 3.26% | CCCCCC |
| 1.41 | 802 458 | 1.83% | 1.79% | CCCCCS |
| 1.73 | 1 142 046 | 2.60% | 2.53% | CCCCSC |
| 2.00 | 2 554 793 | 5.82% | 5.50% | CCCCAA |
| 2.24 | 24 951 911 | 56.80% | 53.12% | CSCSCS |
| 2.45 | 4 589 477 | 10.45% | 10.65% | CSCSSC |
| 2.65 | 82 270 | 0.19% | 0.26% | CAAACC |
| 2.74 | 305 785 | 0.70% | 0.92% | CPCSSS |
| 2.83 | 3 201 | 0.01% | 0.01% | AACAAC |
| 3.00 | 1 941 698 | 4.42% | 5.75% | CPCSCS |
| 3.24 | 2 038 480 | 4.64% | 6.25% | SCPCSC |
| 3.46 | 1 134 947 | 2.58% | 3.30% | CPPSPP |
| 3.67 | 600 854 | 1.37% | 1.53% | OCSOCS |
| 3.74 | 394 328 | 0.90% | 1.17% | CPCOCA |
| 4.00 | 725 024 | 1.65% | 2.15% | APAACS |
| 4.24 | 494 406 | 1.13% | 1.23% | COSAAC |
| 4.47 | 83 723 | 0.19% | 0.26% | PCOASA |
| 4.74 | 104 083 | 0.24% | 0.30% | SPOACS |
| 5.20 | 6 725 | 0.02% | 0.02% | CSPOAW |
2.2. Datasets
We identified publicly available datasets with a spatial component that might predict rotational complexity. Biophysical predictors included land capability, and magnitude and variability of precipitation during the growing season; policy predictors included distance from the nearest grain elevator and biofuel plant (table 1). We then compiled rasters from these datasets (figure S1 (available online at stacks.iop.org/ERL/16/054045/mmedia)).
As done in previous analyses [59–61], we used the NCCPI as a proxy for inherent land capability. The NCCPI combines soil properties (e.g. cation exchange capacity, bulk density, and slope) to form an index that shows agricultural land capacity, with submodels for corn/soy, cotton, and small grains [62]. In the present analysis, we use the highest NCCPI value out of the three submodels for each pixel.
2.2.1. Cropland data layer (CDL)
We used the USDA's CDL from 2012 to 2017 to quantify crop rotational complexity in our focal regions [63]. The CDL uses remote sensing to identify the crop species present in a given year on all US cropland at a 30 × 30 m resolution. We aggregated the CDL to 150 × 150 m with a majority filter to avoid small-scale accuracy errors inherent in the dataset. From these aggregated pixels, we included only 'corn-based' rotations, defined as pixels that were categorized as corn in at least one of the 6 years in the study period, in subsequent analyses (71% of total cropland).
2.2.2. Field-level aggregation
We aggregated the above datasets using a remotely sensed dataset of agricultural field boundaries produced by Yan and Roy [57] to avoid over representing large fields. Each variable was averaged over the field (mode for RCI and state, median for rainfall variance, and mean for all remaining), and a new field size variable was created by summing the pixels in each field. Fields were included if the CDL showed them as being at least 50% corn in one or more of the focal years.
2.3. Spatially blocked bootstrap regression
To test for a relationship between RCI and predictive factors, all variables were centered and RCI was regressed against a set of covariate data (table 1) in a linear mixed model (LMM) including US state as a random effect to account for regional differences (see supplement). We included interactions for which we had a priori hypotheses (see table 3 for full list of terms included). The model was estimated using the R package 'lme4' [64].
Table 3. Regression coefficients. Coefficients from LMMs of RCI on various biophysical and social variables, with state as a random effect. Estimates are given from a naïve (non-bootstrapped) model, while confidence intervals are obtained from spatially blocked bootstrap regressions. After running 1000 bootstrapped models, the 2.5 percentile was used as the lower limit of the 95% confidence interval, while the 97.5 percentile was the upper limit. Interactions were chosen conservatively and a priori by author expectations about possible important interaction processes. Because variables were unscaled, magnitudes of coefficients are not directly comparable. Coefficients whose 95% confidence interval does not include zero are shown in bold.
| Variable | Estimate | 95% CI |
|---|---|---|
| Intercept | 2.47 × 10⁻² | −4.43 × 10⁻² to 6.99 × 10⁻² |
| Land capability | −2.84 × 10⁻¹ | −5.20 × 10⁻¹ to −6.63 × 10⁻² |
| Grain elevator distance (km) | 6.68 × 10⁻⁴ | −2.21 × 10⁻³ to 3.63 × 10⁻³ |
| Biofuel distance (km) | 1.09 × 10⁻³ | 2.47 × 10⁻⁴ to 1.82 × 10⁻³ |
| Mean rainfall (in) | −4.12 × 10⁻² | −5.93 × 10⁻² to −1.07 × 10⁻² |
| Mean rainfall squared (in2) | 3.82 × 10⁻³ | −2.54 × 10⁻³ to 9.08 × 10⁻³ |
| Rainfall variance (in2) | 2.40 × 10⁻³ | −3.04 × 10⁻³ to 4.12 × 10⁻³ |
| Field size (ha) | −2.70 × 10⁻³ | −2.99 × 10⁻³ to −1.93 × 10⁻³ |
| Land capability × biofuel distance | −2.78 × 10⁻⁴ | −2.86 × 10⁻³ to 3.81 × 10⁻³ |
| Land capability × grain distance | −3.26 × 10⁻³ | −1.85 × 10⁻² to 7.21 × 10⁻³ |
| Land capability × mean rainfall | −8.98 × 10⁻² | −1.73 × 10⁻¹ to 1.02 × 10⁻¹ |
| Land capability × rainfall variance | −1.75 × 10⁻² | −2.48 × 10⁻² to −4.08 × 10⁻³ |
| Land capability × field size | 6.27 × 10⁻³ | 1.31 × 10⁻³ to 7.81 × 10⁻³ |
| Biofuel distance × field size | 5.57 × 10⁻⁶ | −5.67 × 10⁻⁶ to 1.28 × 10⁻⁵ |
| Grain distance × field size | −1.31 × 10⁻⁵ | −4.49 × 10⁻⁵ to 2.82 × 10⁻⁵ |
| Mean rainfall × rainfall variance | 1.86 × 10⁻³ | −1.43 × 10⁻⁴ to 3.87 × 10⁻³ |
State random effect ( ) ) | 4.52 × 10⁻² | 2.52 × 10⁻² to 8.59 × 10⁻² |
Two model assumptions are violated in the above model, requiring updated estimates of the parameters' standard errors. First, because RCI is a derived statistic with an unusual domain, the index is not distributed according to a known distribution family and violates the assumption of normality in the residuals. Second, residuals showed high spatial autocorrelation at multiple scales (Global Moran's I = 0.23, p-value < 1 × 10⁻¹⁵, 20 nearest neighbors weights matrix) and with an unknown structure, necessitating a nonparametric approach. Both violations are likely to shrink standard errors of the estimated parameters, leading to overconfident estimates; to illustrate, in the case of spatial autocorrelation, if the explanatory variables are randomly located in relation to crop rotation, spatial autocorrelation in crop rotation would falsely inflate significance. We used nonparametric spatial block bootstrapping to correct for this overconfidence [65, 66]. An algorithm for sparsely distributed spatial data, derived by Lahiri 2018, was implemented in R (see supplement).
Spatial block bootstrapping involves iteratively resampling data in spatial blocks to mimic the generation of autocorrelated data. Choice of block size is nontrivial, and choosing the optimal block is an open question [67], but blocks should be larger than the scale at which autocorrelation operates. Using the R package 'gstat' [68, 69] to compute a variogram of the residuals generated by the naïve LMM, we determined that range (distance at which spatial autocorrelation falls off sufficiently) was 400 815 m. We used this as the dimension of each (square) spatial block (figure S2).
We repeated this bootstrap with a range of possible spatial block sizes and found that this inference on parameters was robust to the choice of block size (table S1).
3. Results
3.1. Complexity of corn-based rotations in the US Midwest
RCI values calculated for corn-based rotations create the first map, to our knowledge, that quantifies field-scale rotational complexity across the US Midwest (figure 3).

Figure 3. Rotational complexity in the US Midwest. The 6 year crop sequence of each pixel in the eight-state focal region was analyzed to produce an RCI score (a); 0 indicates monoculture corn, 5.2 indicates a different crop grown in each of the 6 years. Only fields that grew corn in at least one of the six focal years were given a score. The area covered by each RCI score (b) shows a small peak at 0 (corn monoculture), and 2.24 (RCI value corresponding to a corn-soy rotation).
Download figure:
Standard image High-resolution imageRCI values from 2012 to 2017 range from 0 to 5.2 (median = 2.2), and are positively skewed (figure 3(b)). Corn monoculture (i.e. corn every year for the 6 year period; RCI = 0) accounts for 4.5% of the study area and 3.3% of fields, suggesting that larger fields are more likely to be managed as monocultures (table 2). The mode RCI score (2.24) corresponds to a corn-soy rotation and dominates the region, covering over half of the study area. Two thirds of the area with this score was a CSCSCS or SCSCSC sequence, while the remaining third corresponds to other rotations that yield the same RCI (e.g. substituting soy for another crop, or a 3 year perennial followed by 3 years of corn).
3.2. Predictors of rotational complexity
RCI scores have statistically clear correlations with land capability, mean rainfall, distance to the nearest biofuel plant, and field size, as well as with several interactions between these variables (table 3; conditional R2 = 0.14). Standard errors from the spatially blocked bootstrap were much larger than uncorrected naive confidence intervals, reflecting that accounting for spatial non-independence is necessary to estimate uncertainty of parameter estimates.
Rotational complexity decreased with NCCPI, a proxy for land capability. We find that land of higher inherent capability (flatter slopes, lower bulk density, etc) is more likely to be used for lower complexity rotations.
Rotational complexity decreased with average rainfall during the growing season. Fields with ample precipitation during the growing season are more likely to have simplified rotations.
Though the relationship between the proximity of the nearest grain elevator and a field's rotational complexity is not statistically clear (95% CI includes zero), RCI showed a clear increase with distance to the nearest biofuel plant. Fields that are closer to biofuel plants are therefore more likely to have simplified rotations.
Rotational complexity decreased with field size, with larger fields more likely to have simplified rotations.
Two of the interactions included in the model show statistically clear relationships. There is a positive interaction between land capability and field size, with higher quality land associated with decreasing RCI on small fields and slightly increasing RCI on large fields (figure 4(a)). The interaction between land capability and rainfall variance shows a negative effect on RCI, with highly variable rainfall accentuating land capability's impact on RCI (figure 4(b)).

Figure 4. Effects of variable interactions on RCI. The effect of the interaction between field size and land capability (a), and rainfall variance and land capability (b) on predicted RCI while holding all non-interacted variables constant. Focal variables range from two standard deviations below to two standard deviations above their means.
Download figure:
Standard image High-resolution image
Interpretations of the relationship that each variable has with rotational complexity are shown in table 4. Though each change is associated with a small shift in average RCI across the region, these can represent massive shifts in regional land management.
Table 4. Interpretations of regression coefficients. Predicted effect on RCI after changing each statistically clear predictor of RCI from its 10th to 90th percentile value in the dataset, while keeping all other variables constant (at their median values). We give context to the resulting changes in RCI by asking what percent of the study area would need to switch from a corn-soy rotation to the most diverse rotation (a different crop grown in each of the six focal years) in order for the predicted RCI change to occur.
| Variable | Change in variable (from 10th to 90th percentile) | Resulting predicted effect on RCI | Context for change in RCI |
|---|---|---|---|
| Land capability | 0.35 | −0.11 | An increase of 0.35 in land capability is equivalent to 3.7% of the study area (1.6 million ha) switching from growing a different crop in each year to a corn-soy rotation. |
| Mean precipitation | 5.2 in | −0.21 | An increase of 5.2 inches in mean precipitation is equivalent to 7.2% of the study area (3.2 million ha) switching from growing a different crop in each year to a corn-soy rotation. |
| Biofuel distance | 79 km | 0.06 | An increase of 79 km in distance to the nearest biofuel plant is equivalent to 2.1% of study area (920 000 ha) switching from corn-soy rotation to growing a different crop in each year. |
| Field size | 51 ha | −0.12 | An increase in field size of 51 ha is associated with the equivalent of 4.1% of the study area (1.8 million ha) switching from growing a different crop in each year to a corn-soy rotation. |
4. Discussion
As crop rotations continue to simplify in the US Midwest despite robust evidence demonstrating yield and soil benefits from diversified rotations, our ability to explain and understand these trends will come in part from observing the biophysical and policy influences on farmers' crop choices at one key scale of management: the field. By developing a novel metric, RCI, that can classify rotational complexity over large areas at the field scale, we open the door to regional analyses that can address the unique landscape conditions that impact farmers' field-level management choices and their subsequent influence on rotational simplification. We find that as farmers are pushed towards simplification by broad federal policies (e.g. the biofuel mandate), physical manifestations of these policies like biofuel plants are correlated with intensified simplification pressures. Similarly, we see that the pressure to build soils and boost crop yields through diversified rotations intensifies in fields with lower land capability, while conversely the negative effects of cropping system simplifications are accentuated on the region's best soils.
4.1. Crop rotational complexity in the US Midwest at the field scale
RCI uses the sequence of cash crops on a given field as a proxy for crop rotation, and sorts these sequences into scores based on the sequence's complexity and potential for agro-ecosystem health. Because this metric has not been used in previous analyses, we verified RCI's validity through comparisons to previous estimates of rotational prevalence in the region. For example, two separate surveys of farmers in the US Midwest showed that between 24% and 46% report growing 'diversified rotations' [35, 70] which we consider to be an RCI of greater than 2.24 (i.e. corn-soybean). In the present study, 34% of fields had an RCI greater than 2.24. This and further comparisons of RCI to previous work (see supplement) show that RCI is capable of capturing previously-noted trends in the region [3, 34, 35, 63, 71].
4.2. Influence of landscape factors on crop rotational complexity
The ability to analyze rotations at the field scale across the entire US Midwest allows us to ask how farmers optimize their rotations in complex economic and biophysical landscapes that include pressures to both simplify and diversify. Several biophysical and policy variables show statistically clear relationships with rotational complexity: high land capability, high rainfall during the growing season, and proximity to biofuel plants are all associated with rotational simplification.
Given policy incentives, farmers often find that 'corn on corn on dark dirt usually pencil out to be the way to go', with farmers growing corn year after year when high quality soil is available [35]. However, when that proverbial 'dark dirt' is not available, calculations are not so simple. If growing conditions are sufficiently poor (low land capability and low rainfall), these intensive corn systems may not be profitable, and farmers will have to rely more heavily on non-corn crops (or else inputs that eat into their profits) to maintain crop health and profitability in their fields.
We see this dynamic at play with land capability in the present analysis. Despite—or rather because of—the fact that more diverse rotations improve soils, the most degrading cropping systems counterintuitively tend to occur on the highest quality land. Highly capable lands can be farmed intensively without dipping into a production 'danger zone' in years with weather that is historically typical for the region, creating a pattern of land use that is likely to degrade these high quality lands in the long term and potentially jeopardize future yields, particularly in the face of climate change [25].
Recent analyses show that enhanced drought tolerance and resilience for crops is one of the key benefits of diverse crop rotations [25, 27, 72]. In the present analysis, mean rainfall during the growing season correlates positively with rotational simplification. Farmers may therefore be employing crop rotation in areas of low rainfall to achieve production levels that will keep a farm solvent, as was seen with rotational complexity increases in Nebraska during a drought period from 1999 to 2007 [73]. This trend is further accentuated by the negative interaction between land capability and rainfall variance in our analysis, where higher rainfall variability leads to even more diverse rotations on marginal lands.
Proximity to biofuel plants, the main policy indicator in our model, showed a statistically clear trend towards rotational simplification, likely due to increased economic profits. Local corn prices increase by $0.06–$0.12/bushel in the vicinity of a biofuel plant, amplifying incentives to grow corn more frequently [37]. Wang and Ortiz Bobea [39] were surprised not to find an impact of biofuel plant proximity on county-level frequencies of corn cropping in their own analysis, and the present analysis—done at a field rather than county scale—shows exactly this expected effect: corn-based rotations are simplified when in closer proximity to a biofuel plant.
In the current economic and policy landscape, farmers are pushed to simplify rotations through more frequent corn cropping, especially in proximity to biofuel plants, while marginal soils and low rainfall pull fields towards more diverse rotations.
5. Conclusion
5.1. Opportunities and recommendations for future RCI use
RCI's ability to classify rotational complexity across large regions at the field scale and with low computational cost opens doors to future analyses that explore the interplay between localized landscape conditions, management choices, and agricultural, environmental, and economic outcomes. We see a strong potential to employ this metric not only in new regions, but in analyses that address how results from field experiments with crop rotation may scale up to regional levels [33].
We also note that the metric should be used with caution. For example, because RCI cannot recognize functional groups in crop sequences (e.g. legumes vs grains), it cannot capture the added benefits that diverse functional groups often add to a rotation. In addition, though RCI includes a perennial correction that avoids penalizing multiple consecutive years of perennials, the metric likely still underestimates the benefits of perennials in rotations. RCI is neutral to the soil benefits of annuals vs perennials, while in practice the year-round cover and crop species mixes (which are coded as a single crop in the CDL) that often accompany perennials may boost soil benefits beyond those of annuals [74]. Consecutive years of perennials are uncommon in our study area (e.g. less than 5% of studied crop area in Iowa), and we encourage caution before applying the metric to regions with a more substantial perennial presence.
We therefore recommend using RCI in studies that explore a wide range of cropping sequences where large differences in RCI are very likely to be meaningful, rather than as a tool to rank sequences that give similar scores. It is also important to note that, though the index can be applied to data of any sequence length, RCI values from different sequence lengths cannot be compared to each other; a rotation that results in a 2.2 from examining a 6 year sequence will not be a 2.2 when examining a 5 or 7 year sequence.
We also note that in using crop sequence as a proxy for crop rotation, RCI cannot fully capture the cyclical nature of true crop rotations. Because RCI examines a fixed number of years, it may 'split up' identical rotations in ways that give slightly different scores (for example, an 'AABB' rotation might appear as either AABBAA (RCI = 2.4) or ABBAAB (RCI = 2.6) in a 6 year sequence). As these discrepancies will decrease when longer sequences are considered, we recommend applying RCI to sequences that are as long or longer than the longest expected rotation in the study region.
We hope to see RCI used in future analyses that extend beyond the Midwest; however, regional and historic patterns of crop production likely influence farmers' rotational decisions and may render RCI scores calculated from disparate geographical regions difficult to interpret when called into direct comparison. We therefore see great promise in RCI as a rotational metric, and caution against applications that are overly narrow (e.g. comparing very similar RCI scores) and overly broad (e.g. comparing RCI scores across regions).
5.2. Policy implications
The time period chosen in this study, 2012–2017, coincides with the introduction of the Renewable Fuel Standard, or 'biofuel mandate', which took full effect in 2012. This policy mandates that 7.5 billion gallons of biofuel be blended with gasoline annually, and caused biofuel plants to open and local corn prices to soar across the US Midwest [75, 76]. Now in 2021, there is significant political pressure both to maintain the biofuel mandate in its current state and to relax the standards, and new exemptions to the mandate have already caused several biofuel plants to close in the region [77, 78]. Given the link between biofuel plant proximity and rotational complexity, our analysis suggests that these closures, if continued, would likely be associated with an increase in mean RCI in the US Midwest. Using our current model, simulations (n = 100) of randomly closing 20 of the 198 biofuel plants in the region lead to an increase of 0.003 in average RCI in the region, driven by greater distance to the nearest biofuel plant. In turn, increasing average RCI by 0.003 represents, for instance, the equivalent of 41 000 ha of cropland switching from corn-soy rotations to the most diverse rotation possible (six different crops grown across 6 years).
Rotational simplification near biofuel plants is a pertinent example of the influence that policy can have on farm management decisions and its landscape repercussions. Biofuel mandates are one of several policies, including crop insurance and research funding priorities [79], that currently maintain the profitability of corn production; however, these policies need not be the ones that define rotational landscapes, and increased funding for policies such as the USDA Conservation Stewardship Program could better align farmers' economic incentives with improved environmental health [80] (figure 1(b)).
When strong economic incentives encourage rotational simplification, our analysis suggests that it is more likely to occur on land with favorable biophysical conditions for corn growth. With our current policy structure, the highest quality lands in the US Midwest therefore become the most prone to degradation through intensive management.
Acknowledgments
We would like to thank Marty Schmer for his insights into Midwestern rotational complexity, Carl Boettiger for generous access to computational resources, Ian Wang for his early encouragement, and the Berkeley Agroecology Lab and two anonymous reviewers for helpful comments. TMB acknowledges NIFA Grant # 2017-67013-26254 for supporting this work. This work used the Extreme Science and Engineering Discovery Environment (XSEDE), which is supported by National Science Foundation Grant No. ACI-1548562.
Data Availability Statement
The input datasets analyzed in this study are openly available (see table 1).
The data that support the findings of this study are available upon reasonable request from the authors.