

Abstract
Disturbed African tropical forests and woodlands have the potential to contribute to climate change mitigation. Therefore, there is a need to understand how carbon stocks of disturbed and recovering tropical forests are determined by environmental conditions and human use. In this case study, we explore how gradients in environmental conditions and human use determine aboveground biomass (AGB) in 1958 national forest inventory (NFI) plots located in forests and woodlands in mainland Tanzania. Plots were divided into recovering forests (areas recovering from deforestation for <25years) and established forests (areas consistently defined as forests for ⩾25 years). This division, as well as the detection of year of forest establishment, was obtained through the use of dense satellite time series of forest cover probability. In decreasing order of importance, AGB in recovering forests unexpectedly decreased with water availability, increased with surrounding tree cover and time since establishment, and decreased with elevation, distance to roads, and soil phosphorus content. AGB in established forests unexpectedly decreased with water availability, increased with surrounding tree cover, and soil nitrogen content, and decreased with elevation. AGB in recovering forests increased by 0.4 Mg ha−1yr−1 during the first 20 years following establishment. Our results can serve as the basis of carbon sink estimates in African recovering tropical forests and woodlands, and aid in forest landscape restoration planning.
Export citation and abstract BibTeX RIS

Original content from this work may be used under the terms of the Creative Commons Attribution 4.0 license. Any further distribution of this work must maintain attribution to the author(s) and the title of the work, journal citation and DOI.
1. Introduction
Tropical forests store approximately 55% of the world's forest carbon (C) stocks, acting as C sinks through a positive balance of tree growth, recruitment and mortality (Pan et al 2011). While forest C stocks and sinks in the tropics have primarily been studied in structurally intact, undisturbed forests in humid ecosystems (Brienen et al 2015, Qie et al 2017, Hubau et al 2020), disturbed and recovering forests are both increasing in extent (Aide et al 2013, Lewis et al 2015). Given their rapid growth, recovering forests have higher instantaneous C sink capacities per unit area in comparison with capacities in old-growth forests under similar conditions (Rutishauser et al 2015, Poorter et al 2016, N'Guessan et al 2019).
African tropical forests and woodlands cover approximately 636 million ha, are inhabited by approximately 284 million people (FAO 2018, 2020), and experience disturbances followed by recovery (Mitchard and Flintrop 2013, McNicol et al 2018). African forests and woodlands are partial sources of income and act as safety nets for rural and semi-rural communities in situations of poverty, economic instability, and/or under the effects of climate change (Chomitz 2007, Djoudi et al 2015). Due to their vast extent, their unique composition and their ability to support surrounding human and non-human populations, while at the same time being under constant use, understanding the role that African forests and woodlands have in climate change mitigation is of utmost importance.
The determinants of C stocks in disturbed and recovering tropical forests and woodlands in Africa remain mostly understudied (Marunda and Bouda 2010, Schimel 2010, Becknell et al 2012, Pennington et al 2018). Forest C stocks are often estimated by measuring standing aboveground biomass (AGB; Mg ha−1), which in undisturbed forests is determined mainly by local environmental conditions. Across undisturbed forests and woodlands in Africa, AGB is likely to be higher in areas with low elevation and gentle slopes (Ensslin et al 2015, Yohannes and Soromessa 2015), high levels of water availability throughout the year (Becknell et al 2012, Ensslin et al 2015) and on older, fertile soils (Lewis et al 2013) In disturbed and recovering forests, AGB is additionally influenced by natural or human disturbances. AGB tends to be higher under lower intensities of human activities such as wood extraction, land conversion (Bonner et al 2013, Pelletier et al 2017, McNicol et al 2018), and when not affected by forest fires (Ryan and Williams 2011, Tarimo et al 2015). In addition, AGB in recovering forests is expected to increase with time since forest establishment (Pelletier et al 2018, N'Guessan et al 2019, Requena Suarez et al 2019).
Large-scale efforts such as national forest inventories (NFIs) have the potential to identify which environmental conditions and degrees of human use are associated with AGB across large areas in forest ecosystems in Africa. NFIs provide valuable in situ observations of AGB, covering broad gradients in environmental conditions and degrees of human use, and can therefore be used for this purpose. Although NFIs seldom provide a quantitative metric of disturbance or recovery of their plots, through the use of validated methodologies of forest cover change detection using time series of satellite images (Sexton et al 2013, 2015, 2016a, Feng et al 2016, Lembani et al 2019, Hamunyela et al 2020), it is possible to estimate time since forest establishment in recently recovered forests. The integration of AGB estimated from NFI plots, spatial datasets of environmental conditions and human use (including time since establishment) opens the opportunity to identify the major determinants of AGB stock in disturbed and recovering forests across large scales.
In this study, we use an extensive NFI dataset across Tanzania's forests and woodlands—consisting mainly of open and closed woodlands, including miombo woodlands and degraded forests—and integrate it with spatial datasets to identify the determinants of AGB. Tanzanian forests are currently under use throughout the country (URT 2016), with fuelwood and charcoal use contributing to 92% of the country's energy consumption (Malimbwi and Zahabu 2009). At the same time, efforts for their sustainable management have been underway for at least three decades (Blomley et al 2011), as well as forest conservation, through the establishment of protected areas in 36% of its mainland area (Gizachew et al 2020). Understanding how AGB varies along gradients in environmental conditions and human use can aid forest landscape restoration planning in Tanzanian forests and woodlands as well as in similar ecosystems in other areas.
Here, we use forest cover time series to divide forest plots into established and recovering forests. For recovering forests, we used time since forest establishment—derived from satellite time series—as a quantitative indicator to assess AGB recovery and therefore the C sink capacity of Tanzania's recovering forests. We hypothesize that (a) AGB is higher in areas with low elevation and gentle slopes, with high levels of water availability, in fertile soils, and with low intensity of human use, and that (b) AGB in recently recovering forest plots increases with time since forest establishment, and therefore that recovering forests act as partial C sinks.
2. Methods
To test our hypotheses, we used a mixed-effects modelling approach to identify the main environmental and human use determinants of AGB in Tanzania's forests, which we divided into recovering and established forests. For this study, we define recovering forests as areas with forests or woodlands that have been regrowing for less than 25 years, and established forests as areas that have been consistently defined as forests or woodlands for at least the last 25 years. We used the same covariations for environmental and human use to test the first hypothesis (determinants of AGB at a specific point in time) in both types of forests. Additionally, for recovering forests, we tested the second hypothesis (effect of time on AGB) through the inclusion of time since forest establishment.
2.1. Study site and forest plot data
Forest plots were measured across Tanzania (figure 1(a)) from 2010 until 2012 as part of the NAFORMA (National Forest Monitoring and Assessment of Tanzania Mainland) project led by the Tanzania Forest Services Agency, in collaboration with the FAO-Finland forestry programme (TFS 2015). A stratified sampling design was followed to account for variability in forests and land use (Tomppo et al 2014). Forest plots were arranged in L-shaped clusters of up to ten plots (average = 9.5), with 250 m between plots (figures 1(b) and (c)). A total of 30 382 plots grouped in 3208 clusters were measured as part of the inventory, including plots outside forests and woodlands.
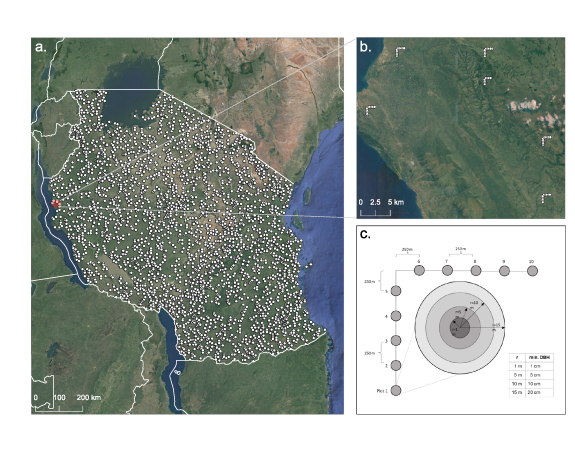
Figure 1. Distribution of NAFORMA clusters and plots. (a) White dots represent the cluster locations in Tanzania, (b) close-up of clusters (red inset in (a)) in which individual plots can be distinguished, and (c) NAFORMA cluster and plot design.
Download figure:
Standard image High-resolution imageNAFORMA uses circular forest plots of 0.0707 ha (figure 1(c)). Within these plots, the total height (H; in m) and diameter at breast height (DBH; in cm) of all trees with a DBH above 1, 5, 10 or 20 cm—based on sub-plot radii of 1, 5, 10 and 15 m, respectively (figure 1(c))—were measured. Species-specific or regional allometric equations were used to calculate tree-level volume (m3) (Malimbwi 1987, Haule and Munyuku 1994, Malimbwi et al 1998, 2000). Tree-level AGB (Mg) was calculated by multiplying tree-level volume estimates with species-specific or regional wood densities (TFS 2015). These values were used to estimate total AGB (Mg ha−1) per plot. We included 16 630 plots in natural forests and woodlands, and excluded plots located in plantations, mangroves, bushlands, grasslands, cultivated land and inland water areas. In order to include a plot in the analysis, AGB estimates had to be >0 and <400 Mg ha−1 to exclude plots with AGB values higher than those expected in undisturbed closed-canopy forests (Brown and Gaston 1995, Lewis et al 2013).
2.2. Estimation of time since establishment
The time since establishment (in years) of each forest plot was determined based on a time-series analysis of Landsat multispectral imagery. Time since establishment was estimated by detecting changes in the probability of forest cover derived from the estimate and uncertainty of tree-canopy cover (Sexton et al 2013, 2016b) at plot locations based on the full Landsat image archive at the time—from 1984 to 2018. For this region, pixels with >10% tree cover were defined as forest. This threshold was chosen due to the predominance of low-biomass tropical forests and woodlands in the study area, coinciding with Tanzania's definition of 'forest' (URT 2016). With this threshold, we generated a forest reference baseline corresponding to 2018, and plots in locations that did not exceed the threshold in 2018 were excluded from further analysis. Year of forest gain at each plot location was detected through a kernel analysis of a time-series of forest-cover, expressed as the probability of the class forest in a given pixel in a given year. A kernel spanning 7 years, including 3 years before and 3 years after a given year, was run retrospectively through the series beginning in 2018. The mean and variance of forest probabilities in before- and after-kernel samples around the focal year (i.e. the year in which forest probability surpassed 50%) were calculated, and the difference between groups was tested using a variant of the two-sample z-test. If a statistically significant (p < 0.05) difference was identified between the two ascending groups, the focal year was labelled as forest gain. If multiple significant gains were detected in the series, the location was labelled with the year of most recent gain. Plots in locations for which forest gain was detected during the study period were regarded as recovering forests, and plots in locations for which the forest probability was over 50% throughout the whole period were regarded as established forests.
For plots in recovering forests, the establishment year was assumed to occur 2 years prior to the detection of forest gain. Time since forest establishment was calculated by subtracting the year of forest establishment from the year in which the plot of the given location was measured (i.e. measurement year). Two additional criteria were applied for recovering forest plots: first, the plot needed to have been measured at least one year after the year of forest establishment; second, we included plots for which the probability of forest gain was at least 20%.
2.3. Environmental and human use predictors
To test the effect of topography, water availability, soil fertility and degree of human use on AGB in the selected forest plots, we gathered ten relevant environmental and human use predictors for all plot locations (table 1). Due to the extent of the study area, plots spanned broad gradients in environmental conditions and human use.
Table 1. Environmental and human use predictors for the NAFORMA forest plots. Time since establishment was derived from this study only for plots in recovering forests.
| Code | Variable | Unit | Min | Max | Mean | SD | Original source | Original spatial resolution |
|---|---|---|---|---|---|---|---|---|
| yrs_since_est | Time since establishment (only for recovering forests) | yr | 1.0 | 24.0 | 11.0 | 7.4 | This study | — |
| elevation | Elevation | m | 13.0 | 2123.0 | 1108.8 | 393.8 | Jarvis et al (2008) | 90 m |
| slope | Slope | º | 0.0 | 17.2 | 1.4 | 2.1 | Jarvis et al (2008) | 90 m |
| CWD | Climatic water deficit | mm yr−1 | −1312.5 | −372.0 | −891.4 | 156.1 | Chave et al (2014) | 2.5' |
| soilP | Total phosphorus (P) content of the soil fine earth fraction for 0–30 cm depth. | ppm | 73.0 | 1163.0 | 255.8 | 123.5 | Hengl et al (2017) | 250 m |
| soilN | Total nitrogen (N) content of the soil fine earth fraction for 0–30 cm depth. | ppm | 373.0 | 2336.0 | 811.7 | 284.8 | Hengl et al (2017) | 250 m |
| tree_cover | Surrounding tree cover in 2010 (500 m radius) | % | 3.3 | 65.9 | 26.7 | 10.0 | Hansen et al (2013) | 30 m |
| dist_roads | Distance to nearest road | km | 0.0 | 121.2 | 23.5 | 23.8 | OpenStreetMap Contributors (2019) | — |
| dist_settl | Distance to nearest settlement | km | 0.2 | 78.5 | 21.7 | 15.2 | OpenStreetMap Contributors (2019) | — |
| fire_duration | Average fire duration per month | days | 0.0 | 11.8 | 4.3 | 1.9 | Andela et al (2019) | 500 m |
The effect of topography was evaluated through elevation (m) and slope (°) extracted or calculated from the shuttle radar topography mission digital elevation model (Jarvis et al 2008) at 90 m resolution. To evaluate effects of water availability, we extracted climatic water deficit (CWD; in mm yr−1) from Chave et al (2014) at a resolution of 2.5', defined as the sum of the differences between monthly rainfall and monthly evapotranspiration in the months where evapotranspiration exceeded rainfall, thus only in periods of water deficit. To evaluate the effect of soil fertility, we included nitrogen (N) and phosphorus (P) soil content data at 0–30 cm depth (in ppm) from Hengl et al (2017) at a resolution of 250 m.
To test for the effect of human use, we included metrics of surrounding tree cover, forest accessibility and fire disturbances. We calculated the percent surrounding tree cover in the landscape based on percent tree cover data for 2010 (%), which was extracted from Hansen et al (2013) at 30 m spatial resolution within radius of 500 m of the plots' locations. Degree of forest accessibility was included as distance of plots to roads and settlements. This was done by calculating the Cartesian distance (in km) to the nearest primary, secondary or tertiary road and to the nearest city, village or town using road and settlement vector data for Tanzania (OpenStreetMap Contributors 2019). To account for the effect of fire, we evaluated intensity of fire disturbances (Trapnell 1959, Chidumayo 1997, Kennard et al 2002) through the inclusion of average fire duration per month which was extracted for the 2003–2012 period from Andela et al (2019) at 500 m resolution.
Predictors were extracted or calculated in R v.3.4.0 (R Core Team 2017), using the raster, spatialEco, and rgeos packages (Bivand and Rundel 2017, Evans 2018, Hijmans 2019). Four plots with unrealistically high soil N (n = 1; 5505 ppm) and soil P (n = 3; 2260–2455 ppm) content were excluded from further analysis.
2.4. Statistical analysis
To identify the determinants of AGB in recovering and established forests, we modelled plot-level AGB (in Mg ha−1) for recovering and established forests separately as a function of elevation, slope, CWD, soil P content, soil N content, surrounding tree cover, distance to roads, distance to settlements and average fire duration using a linear mixed-effects model. An interaction between CWD and average fire duration was included, in line with Lehmann et al (2014) who describe a strong relationship between water availability and fires affecting biomass in African sparse woodlands. For recovering forests, we additionally included time since establishment, which was ln-transformed to account for the non-linear AGB increase over time. The aforementioned predictors were included as fixed effects, and plot clusters were regarded as random effects, for which random intercepts were included. Model performance was evaluated using Akaike's information criterion and model fits were evaluated based on their marginal (fixed-effects only) and conditional (fixed and random effects) R2 (Nakagawa and Schielzeth 2013). All predictors were standardised by subtracting the mean and dividing the difference by 1 SD (Gelman and Hill 2007) to compare effect sizes. We used the lme4 package (Bates et al 2015) to fit mixed-effects models in R.
3. Results
3.1. Spatial distribution and stand age of forest plots
A total of 1479 plots in recovering forests and 479 plots in established forests were included in the analysis (figure 2). Thirty-nine percent of the plots were located within 10 km of a road and 27.4% of the plots were located within 10 km of a human settlement (figure 2(a)). Recovering forests comprised a similar percentage of the total number of plots within 10 km of roads and settlements (40.0% and 28.1%, respectively) as plots in established forests (36.1% and 25.3%, respectively).
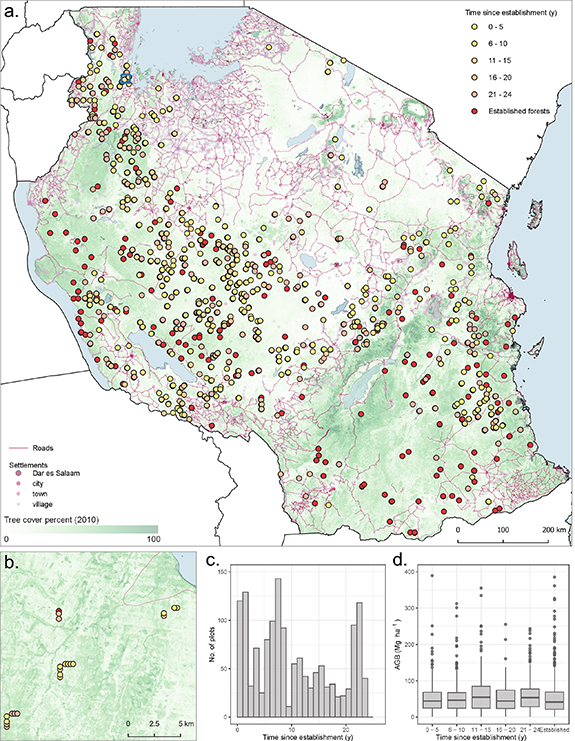
Figure 2. Stand age and AGB distribution of forest inventory plots in Tanzania. (a) Spatial plot distribution, (b) close-up of plot composition per cluster at a given location (blue inset in (a)), (c) distribution of inventory plots in recovering forests per time since establishment and (d) plot-level AGB per time since establishment category.
Download figure:
Standard image High-resolution imageFor plots in recovering forests, time since establishment varied from 1 to 24 years (figure 2(c)), with the majority (54.2%) established 1–10 years before field measurement. The majority (88.5%) of AGB values for recovering and established forests did not exceed 100 Mg ha−1. The overall mean AGB for established forests (56.0 Mg ha−1) was 0.5 Mg ha−1 higher than for recovering forests.
3.2. Environmental and human use determinants of AGB
AGB varied along environmental and human use gradients in both recovering and established forests. In recovering forests (figure 3(a)), in decreasing order of importance, AGB decreased with increasing CWD, increased with higher percentages of surrounding tree cover, decreased with elevation, distance to roads, soil P content, with the interaction between CWD and average fire duration, and increased with time since forest establishment. In established forests (figure 3(b)), in decreasing order of importance, AGB decreased with increasing CWD, increased with surrounding tree cover and with soil N content, and decreased with elevation. The effects of slope, distance to settlements and average fire duration were not significant for either forest category. The marginal (fixed effects only) and conditional (both fixed and random effects) R2 were 0.08 and 0.24, respectively, for the model describing recovering forests and 0.10 and 0.19 for the model describing established forests.

Figure 3. Effects of environmental and human use determinants of AGB in Tanzanian forests. Effects of all predictors tested for (a) recovering forests and (b) established forests. Time since establishment was not considered in established forests. Standardised coefficients of the predictors' effects and confidence intervals (95%) are indicated. Significant responses are indicated with filled symbols; non-significant responses with open symbols.
Download figure:
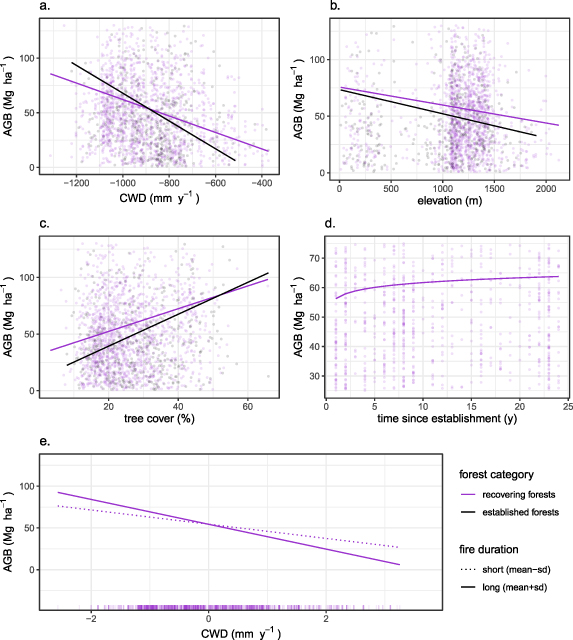
Standard image High-resolution imageThe effects of CWD, elevation and surrounding tree cover were significant and similar in direction in both recovering and established forests (figures 4(a)–(c)). The unexpected negative effect of CWD on AGB, which suggests that lower water deficit results in lower AGB, was the largest absolute effect in both forest categories, followed by the expected effects of surrounding tree cover (positive) and elevation (negative).
Figure 4. Observed and predicted AGB values in relation to individual effects (a)–(d) and interactions (e) in Tanzanian forests. The effect of (a) CWD, (b) elevation and (c) tree cover on AGB in recovering and established forests are indicated as purple and black lines, respectively. The effect of (d) years since forest establishment on AGB was only observed in recovering forests. Symbols represent original AGB values in recovering (purple) and established (black) forests. (e) Effect of fire duration on AGB-CWD relationships are shown for long (mean + SD; continuous line) and short (mean − SD; dotted line) fire durations in recovering forests, original CWD values are included at the bottom of the panel. Note the different y-axis range for (d). For all panels, other predictors were kept constant at the mean.
Download figure:
Standard image High-resolution image
In recovering forests, the effect of time since forest establishment was small yet significant (figure 4(d)). Based on the predicted AGB at 1 and 20 years after forest establishment, and keeping all other predictors constant, the overall AGB recovery rate during the first 20 years was 0.4 Mg ha−1 yr−1.
4. Discussion
4.1. Environmental and human use determinants of AGB in Tanzanian forests
Forests and woodlands in Tanzania occur mostly in areas with highly seasonal rainfall, and are subject to dryland-specific ecological, environmental and anthropogenic dynamics (Timberlake et al 2010). Because of this, AGB values in this study greatly varied, aligning with AGB estimates for miombo forests, which overlap with the western part of the Tanzanian forest area covered in this study, which range from 1.3 to 95.7 Mg ha−1 (Gumbo et al 2018), and with AGB estimates in seasonally dry tropical dry forests in Africa, which range from 39 to 334 Mg ha−1 (Becknell et al 2012). The aforementioned studies evaluated how climate and disturbance affect AGB in these regions, but they are complicated by combining limited plot data from different methodologies. The spatial extent and methodological consistency of the NAFORMA dataset allowed consistent evaluation of AGB stocks along environmental and human use gradients.
For both recovering and established forests, the selected environmental and human use predictors determined less than 24% and 19% of the variation, respectively. Among these predictors, AGB was most strongly determined by, unexpectedly, a negative effect of CWD. While dry periods are a major AGB-limiting factor (Eamus 1999), the negative effect of CWD on AGB in both forest categories, surprisingly, suggests that seasonality characterised by very dry periods might positively influence AGB. This might be due to increasing periods of water deficit inhibiting the proliferation of herbaceous species, which could potentially limit forest establishment in dry forests and woodlands (Vieira and Scariot 2006, Bhadouria et al 2017); however to test this hypothesis, more studies on the initial stages of forest establishment are needed. Moreover, given that, overall, effects of environmental conditions and human use evaluated in this study were weak, additional research on determinants of AGB is needed. The significant interaction between CWD and fire duration in recovering forests suggests that tree establishment in recovering forests might be positively affected by recurrent, longer fires and very dry periods. This interaction was not significant for established forests, and while fires might benefit seedling establishment (Khurana and Singh 2001), consistently recurring fires ultimately simplify the composition of a forest community (Vieira and Scariot 2006), causing further forest degradation.
As expected, elevation had a negative effect on AGB for both forest categories. The effect of slope, on the other hand, was not significant. While Tanzania has broad elevational gradients across its territory, gentle slopes are common, with steeper slopes mostly found in the Eastern Arc Mountains, which transect Tanzania from northeast to southwest. The great majority of plots (93.2%) used in this study had a slope of 0°–5°, suggesting that small changes in gentle slopes have little to no effect on AGB.
The effect of soil fertility, which we hypothesised to be positive, varied for both recovering and established forests, suggesting that higher AGB is found in recovering forests on soils with lower P content and in established forests on soils with higher N content. While the positive effect of soil N content on AGB was expected (Davidson et al 2007), this was not observed for recovering forests, indicating that AGB during the first years is not significantly determined by the amount of soil N. Soil P content, considered a limiting nutrient in tropical forests growing on weathered soils (Murphy and Lugo 1986, Ceccon et al 2006, Davidson et al 2007), had a negative effect on AGB in recovering forests. Soils may have weathered, and/or further degraded due to lack of soil moisture, current and previous land use, recurrent resource extraction, constant herbivory and recurrent human-induced fires. Furthermore, recent local studies have suggested that AGB stocks are more strongly related to soil hydromorphy rather than to soil fertility (Gourlet-Fleury et al 2011). Lastly, these confounding relationships could be a consequence of using gridded spatial predictions for assessing soil nutrient effects, as opposed to using field data, which were not available.
Overall, our results reveal a complex underlying relationship between human activity and forest recovery, which has been reported previously in African forests and woodlands (Timberlake et al 2010). For both forest categories, the predictor of human use which mainly drove AGB was surrounding tree cover, an indicator of the extent of land conversion. This is expected, as the presence of nearby forests benefits tree establishment through natural regeneration and tree growth; however, high rates of degradation and deforestation in African woodlands (McNicol et al 2018) limit this effect. In recovering forests, distance to roads had a negative effect on AGB, suggesting that forest recovery tends to occur in more accessible areas (Malimbwi et al 2005). Land conversion is often done through induced fires, which on their own did not have a significant effect on either recovering or established forests.
Other determinants, for which no spatially explicit information was available are influencing forest recovery and degradation in Tanzania's forests. The effect of herbivory, be it by wildlife or livestock, could provide insight into tree establishment and mortality (Sankaran et al 2013), tree cover and forest structure (Asner et al 2009), as well as competition with herbaceous (grass) species (Riginos 2009). Megafauna has also been linked to the proliferation of fires (Foster et al 2020) and competition with herbaceous species (Bhadouria et al 2017). Prevalence of natural regeneration through tree resprouting, common in dry forest ecosystems (Ewel 1980, Timberlake et al 2010), and its interaction with constant human use (Vieira and Scariot 2006), might also provide insight into recovery from degradation. Finally, local information on previous land use preceding forest establishment, as well as current levels of forest use, both of which have proven to determine AGB stocks in miombo forests (Jew et al 2016, Pelletier et al 2017), could also provide insight into the varying levels of AGB in both recovering and established forests.
4.2. AGB recovery in Tanzanian recovering forests
Time since establishment had a significant, positive effect on AGB in recovering forests, indicating that, even though recovering forests in Tanzania experience disturbance, through biomass accumulation over time they can act as partial C sinks. Our estimate (0.4 Mg ha−1 yr−1) is comparable to, albeit lower than, local estimates obtained through repeated remeasurements in permanent plots in the woodlands of south-eastern Africa. For example, coppiced miombo woodland in Mutupa, Zambia, evaluated during 1982–1988, had a mean annual increment (MAI) of 1.97 Mg ha−1 yr−1 (range: 0.41–2.91 Mg ha−1 yr−1) for woodlands aged 3–29 years (Chidumayo 1990). In miombo woodlands in Kitulangalo, Tanzania, for the period of 3 years (1996–1999), MAI was estimated as 2.35 m3 ha−1 yr−1 (Malimbwi et al 2005), which roughly translates to 1.18 Mg ha−1 yr−1. In Kilwa, Tanzania, regrowing forests after land disturbance accumulated AGB at a rate of 0.83 Mg C ha−1 yr−1 (McNicol et al 2015). A recent national study of vegetation change for all forests and woodlands in Zambia (Pelletier et al 2018) estimated annual biomass gain rates of 1.17 Mg ha−1 yr−1 (mean) and 0.31 Mg ha−1 yr−1 (median). While our rate is lower, it accounts for varying types of disturbance during recovery, such as fires and extraction of wood, which is not fully the case in the aforementioned studies, which either account for specific disturbances, or select sites with no signs of disturbance after abandonment.
Our AGB accumulation rate estimate was one-tenth as large as the 2019 continent-level IPCC Tier 1 estimate for African recovering tropical dry forests (3.9 Mg ha−1 yr−1) which is based on values estimated for Central and South American dry forests due to limited data availability in Africa; however it aligns with AGB accumulation estimates suggested for African recovering tropical shrublands (0.2–0.7 Mg ha−1 yr−1) (IPCC 2019). Continent-level estimates, which are being used for national greenhouse gas reporting of C sinks, are based on a limited number of locations in tropical dry forests and woodlands, with a major gap in Africa (Requena Suarez et al 2019). Region-level estimates are usually based on sites with recovery pathways with little to no disturbance during the first years, and while this could be a common pathway for recovering humid forests (Chazdon et al 2007, N'Guessan et al 2019), this is not the case for African recovering dry forests and woodlands, which are under constant use. While reporting on the C sinks in African dry forests and woodlands, recurrent disturbance of recovering forests must be taken into consideration.
4.3. Methodological implications and next steps
Given the predominance of low-biomass, sparse forests and woodlands in the study area, the use of dense time series to detect forest cover gain is challenging. Nevertheless, Landsat-derived dense time series have been used before in this region for detection of forest cover change (Lembani et al 2019, Hamunyela et al 2020). The Tanzanian NFI plot size (15 m radius; 0.0707 ha) and spacing within clusters (250 m) allowed us to derive this metric per plot; however we can expect some error estimating AGB due the small plot size (Tomppo et al 2008, Kachamba et al 2017), as well as the pixel-level uncertainty in forest establishment year.
For recovering forests, we used a space-for-time substitution to estimate AGB recovery. This chronosequence approach has been used elsewhere in the tropics (Chazdon et al 2007, Poorter et al 2016, N'Guessan et al 2019) and, since it requires plots to be measured only at a single point in time, it is a practical way to estimate AGB recovery without having to remeasure forest plots over several decades. In this study, we have employed this approach by detecting time since establishment in forest plot locations, thus deriving information on time since recovery based on 1479 plots embedded in 543 clusters treated as chronosequences.
Chronosequences require having field AGB measurements at known times since major disturbances or abandonment. Time has to be estimated in a precise, consistent, and straightforward manner, and usually relies on interviews with land owners or occasionally on aerial images (Ruiz et al 2005, Chazdon et al 2007, Piotto et al 2009). This greatly limits the number of forest plots that can be used, as many forest plots do not have information on the beginning of recovery or on land use history, unless they have been measured for the main purpose of studying recovery or regrowth. However, as remote sensing technologies improve, and satellite image archives become available, monitoring forest cover dynamics over several years enables the use of forest plots measured for different purposes, for which time since establishment in recovering forests is unknown. With this, using the first round of NFIs to assess forest recovery across large scales becomes possible. Since NFIs strive to systematically sample large forest areas, they are a valuable source of on-the-ground data, which, in combination with satellite time series, can be utilised to study AGB stocks in recovering forests at a national scale. Studies that use remeasured NFIs, such as the case of Pelletier et al (2018), offer the opportunity to examine AGB accumulation into more detail.
Satellite-based estimates of time since forest establishment, critical to assess forest recovery, can be applied to other forest inventories for which no field data on stage of recovery is available. As countries refine their estimates of forest C stocks through the implementation of NFIs, satellite time series can serve as an alternative method for repeated measurements over time to estimate C sinks in recovering forests. Many countries with (sub)tropical forests have recently conducted, or are currently in the process of designing or carrying out NFIs (Romijn et al 2015), generating large-scale field data which could be appropriate for this approach.
5. Conclusions
AGB in Tanzanian forests and woodlands is partially determined by gradients in environmental conditions and human use. We found that, in spite of constant use, recovering forests have the potential to act as partial C sinks through biomass accumulation. In this respect, recovering forests in Tanzania have a climate change mitigating value, in addition to the already-essential ecosystem services that they provide to surrounding communities. Carefully planned ecosystem restoration, designed with awareness of the particularities of forest and woodland ecosystems in Africa, could assist with climate change mitigation and sustainable development. In this respect, considering only environmental determinants such as climate and topography is not enough; human use determinants of biomass, such as forest accessibility and degree of forest use, must be taken into account to provide a comprehensive picture of the potential of forest and woodland restoration.
More generally, while integrating plot data and spatial data remains a challenge, we have demonstrated how combining these data sources improves analysis of forest recovery and forest-related climate change mitigation activities. This offers new pathways to integrate forest information in national assessments and planning for climate change mitigation actions. In this respect, large-scale ecological questions which merge environmental and human contexts can be answered through the combination of national field endeavours, satellite time series and spatial datasets.
Acknowledgments
This research is part of CIFOR's Global Comparative Study on REDD+ (www.cifor.org/gcs). The funding partners that have supported this research include the Norwegian Agency for Development Cooperation (Norad), the International Climate Initiative (IKI) of the German Federal Ministry for the Environment, Nature Conservation, Building and Nuclear Safety (BMUB) and the CGIAR Research Program on Forests, Trees and Agroforestry (CRP-FTA) with financial support from the CGIAR Fund Donors.
Disclaimer
The views expressed in this information product are those of the author(s) and do not necessarily reflect the views or policies of FAO.
Data availability statement
The data that support the findings of this study are available upon reasonable request from the authors.