


Abstract
As more countries commit to emissions reductions by midcentury to curb anthropogenic climate change, decarbonization of the electricity sector becomes a first-order task in reaching this goal. Renewables, particularly wind and solar power, will be predominant components of this transition. How availability of the wind and solar resource will change in the future in response to regional climate changes is an important and underdiscussed topic of the decarbonization process. Here, we study changes in potential for wind power in China and India, evaluating prospectively until the year 2060. To do this, we study a downscaled, high-resolution multimodel ensemble of CMIP5 models under high and low emissions scenarios. While there is some intermodel variability, we find that spatial changes are generally consistent across models, with decreases of up to 965 (a 1% change) and 186 TWh (a 2% change) in annual electricity generation potential for China and India, respectively. Compensating for the declining resource are weakened seasonal and diurnal variabilities, allowing for easier large-scale wind power integration. We conclude that while the ensemble indicates available wind resource over China and India will decline slightly in the future, there remains enormous potential for significant wind power expansion, which must play a major role in carbon neutral aspirations.
Export citation and abstract BibTeX RIS

Original content from this work may be used under the terms of the Creative Commons Attribution 4.0 license. Any further distribution of this work must maintain attribution to the author(s) and the title of the work, journal citation and DOI.
1. Introduction
Human-induced climate change represents one of the most pressing issues of this century, demanding dramatic lifestyle adjustments in order to curb greenhouse gas emissions. The Paris Agreement in 2015 was an important effort by 195 member states (as of November 2020, signed by 194 countries and ratified by 188) to commit to significant decarbonization of their energy systems over the coming decades. While an ambitious first step, these aims have been considered not significant enough to limit potential warming to 1.5 °C above pre-industrial levels by the end of the century (UNEP 2019). A report from the Climate Action Tracker (CAT 2019) suggests that many of the world's largest emitters are not on pace to reach their Paris Agreement targets, with some countries improving too slowly (most of East Asia), others not improving at all (Russia, Argentina) and some withdrawing from the agreement altogether (USA). Coal represents a significant component of both China and India's contemporary primary energy supplies, with plans for it to remain important for the coming decades. Serious action must be taken to reverse these trends. In September 2020, China pledged to be carbon neutral—that is, to have net-zero carbon emissions—by 2060 if not earlier. In order to reach these ambitious targets, renewables must play a major role in the electricity sector. China has already committed important investment into the development of onshore wind power, with recent additional growth in offshore wind. Over the past decade, installed onshore wind capacity in China has risen from 18 GW to 205 GW (IRENA 2020). Offshore wind capacity in China is at present 6 GW, but is expected to expand rapidly because of cheapening costs and an abundant available resource (Sherman et al 2020a). India, by comparison, has only 35 GW of wind power presently installed, but has large available physical potential. In addition, India is expected to build 86% less coal power capacity than expected last year (IEA 2020) an unprecedented and positive pivot. In order to achieve deep reductions in CO2 emissions, renewables need to dominate growth in India, particularly, because of the country's growing population and expanding middle class; the share of electricity in the overall energy system is predicted to rise from the current level of 16% to 25%–29% in 2047 (NITI Aayog 2017).
Many papers have investigated significant integration of renewables to achieve carbon neutral or decarbonizing energy economies in both China and India (Anandrajah and Gambhir 2014, Mittal et al 2016, Gadre and Anandrajah 2019, Pachouri et al 2019, Lu et al 2020). These studies are obviously important from a policy perspective, but ignore a potentially critically important detail: the locally available wind and solar resource may be subject to significant changes in the future as a consequence of regional climate change. Lu et al (2020), for example, investigate large-scale integration of wind and solar power assuming the available resource at present day is the same as what will be available in 2040. This assumption could miss important changes to the local climatology and consequent impacts on the available renewable resource, such as potential changes to the South Asian Monsoon in response to changing aerosol forcing (Ramanathan et al 2005, Kim et al 2007, Meehl et al 2008, Bollasina et al 2011, Saha and Ghosh 2019, Sherman et al 2020b). Karnauskas et al (2018) evaluate onshore wind power potential in high and low emission future scenarios and detect declining trends over most of the northern hemisphere. However, these results were detected in data that was both spatially and temporally coarse, which may not be suitable for wind power analysis, particularly for grid integration purposes. Detailed analysis of climate model projections at higher spatial and temporal resolutions would provide important insight into a renewables-dominant electricity system as will likely be the case in many countries in East and South Asia by midcentury.
Here, we study downscaled CMIP5 projections of on- and offshore wind power potential in China and India under historical and future emissions scenarios in order to determine if and how regional climate changes could impact plans for wind power growth. We choose to compare simulations of the historical period with simulations of the period 2030–2060, acknowledging that these three decades will be critical to China and India reaching their emissions targets. Regions are spatially filtered to account for physical constraints in on- and offshore wind installation. We focus on how wind power potential is projected to change in aggregate over these two countries, but also study changes in seasonal and diurnal variability. Future changes in variability, particularly to the hourly profile, represent important considerations for large-scale integration of renewables. The rest of the paper is structured as follows: section 2 discusses the simulations used in the analysis and explains the process of obtaining wind power potential from near-surface wind speeds, section 3 presents and analyzes wind power potential over China and India and changes to its variability and section 4 summarizes the study and highlights needs for future work.
2. Methods
2.1. CORDEX description
The wind data used in the study were derived based on the Coordinated Regional Climate Downscaling Experiment (CORDEX). The CORDEX program is run by the World Climate Research Program, which provides high-resolution, statistically and dynamically downscaled regional climate projections forced by lower resolution general circulation models (GCMs) (details of the processing can be found in Giorgi et al (2009)). Given that the study here focuses on China and India's potential for wind in the future, we study the East Asia EAS-22 regional downscaled experiments for all CMIP5 models with near-surface wind speeds available on the publicly available Earth System Grid Federation (ESGF) repository: HadGEM2, MPI-ESM and NorESM1. This database defines 3 h wind speeds with a spatial resolution of a 0.44° by 0.44° for three CMIP5 simulations: historical (running from 1970 to 2005), Representative Concentration Pathways (RCPs) 2.6 (a low-emissions future scenario running from 2006 to 2100) and RCP8.5 (a high-emissions future scenario from 2006 to 2100). We focus our wind analysis on two 30 year periods, 1970–2000 for the historical simulations and 2030–2060 for the RCP scenarios. All figures in the main text compare the historical simulations with RCP8.5 to identify the largest bounds of changes in wind in the models. Results from RCP2.6 are presented in the SI and discussed for the purpose of scenario sensitivity in the main text.
2.2. Wind power analysis
Three-hourly wind speeds at 100 m were extrapolated from 10 m CORDEX data using the vertical profile of the power law described by Archer and Jacobson, assuming a friction coefficient of 1/7 as indicated in their analysis. Wind power was computed on a three-hourly basis using the power curve for the GE 2.5 MW wind turbine onshore and 8.0 MW Vestas wind turbine offshore. The ratio of power output to the nameplate capacity of turbines was used to compute relevant capacity factors (CFs).
Onshore areas that are forested, urban, or covered with water or ice were filtered according to data from the NASA MODIS (Moderate Resolution Imaging Spectroradiometer) satellite MCD12Q1 dataset (NASA 2012). Altitude and offshore depth measurements were taken from the General Bathymetric Chart of the Oceans One Minute Grid, a global bathymetric grid providing data at a 1 arcminute resolution (Becker et al 2009). Grid points characterized by heights of more than 3000 m were excluded as inappropriate for deployment of onshore wind power systems. To determine locations suitable for fixed-bottom offshore wind turbines in China, we included locations only within its exclusive economic zone (EEZ). Boundaries for China's EEZ were taken from Marine Regions, a database which aggregates information from a number of regional and national providers (Flanders Marine Institute 2018). Another filter adopted was to consider only fixed-bottom turbines, which require offshore depths of less than or equal to 60 m. The filters were regridded to the CORDEX resolution in order to manage differences in resolution. We choose not to include discussion of offshore wind in India because its potential is much smaller relative to China, in large part because of the deeper waters surrounding India's coasts which are not suitable for fixed-bottom turbines.
Following Lu et al (2020), we assume that the spacing appropriate to minimize turbine-turbine interference for onshore wind is approximately 9 × 9 rotor diameters (0.64 km2) and 7 × 7 rotor diameters (1.04 km2) for offshore wind. The area for each latitude/longitude grid cell was divided by this value to compute the number of turbines that could fit maximally into a given cell. Note that this spacing does not account for the downstream wake effect, which is on too small a scale to be modeled accurately using the CORDEX data. Given that the average downstream power loss is on the order of 5% (Wang et al 2019), the wake effect should not have a significant bearing on the present results. The potential installed capacity (in gigawatts) is computed by multiplying the number of turbines in a cell by the turbine power (2.5 MW for land-based turbines, 8 MW for those installed offshore).
The next step is to quantify the power that could be supplied to individual regions. These regions, along with the mean percent difference in CF between the future and historical periods, are indicated in figure 1. From the installed capacity and CF data, estimates of annual available energy E(lat,lon,t) (in kilowatt hours) were computed using the equation

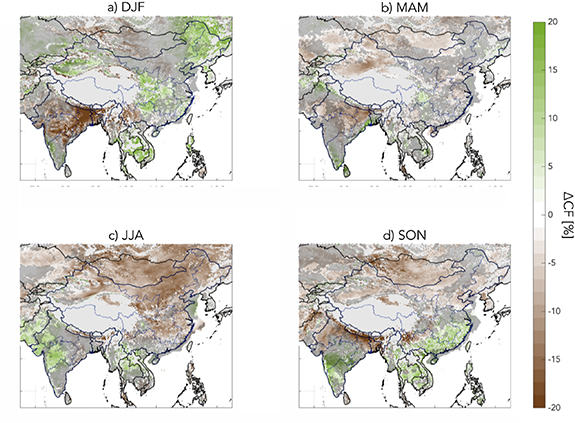
Figure 1. Multimodel mean relative difference in seasonally averaged capacity factor (CF) in the studied regions over the period 2030–2060 in the RCP8.5 simulations relative to the period 1970–2000 in the historical simulations in the three models studied here. (a) Represents December–January–February, (b) March–April–May, (c) June–July–August and (d) September–October–November. Dark blue borders within India and China denote the different regions studied in our analysis. Offshore wind areas are shown only for China. Light gray areas (e.g. over the Himalayas) indicate land unsuitable for onshore wind installations and dark gray areas indicate regions where the three studied models do not agree on the direction of the change in mean CF.
Download figure:
Standard image High-resolution imagewhere C(lat,lon) represents the available capacity at a given location in kilowatts, CF(lat,lon,t) is the CF at the location, and 8760 defines the number of hours in a year. Available energy for the regions in China and India indicated in figure 1 will be assessed later in this paper.
3. Results
3.1. Historical and projected wind energy distributions
As indicated earlier, our estimate for the potential source of power from wind in China and India assumes deployment of a fleet of 2.5 MW GE turbines onshore and 8.0 MW Vestas turbines offshore. The yield of power from individual turbines was calculated on a 3 h basis over the periods 1970–2000 and 2030–2060 based on publicly available CORDEX regionally downscaled climate simulations. The approach used to calculate wind speeds at elevations appropriate for the rotor blades and to estimate relevant annual mean CFs is described in the Methods Section. The quality of the available wind resource can be represented by the CF. The multimodel mean seasonal changes in CFs between the historical and RCP8.5 scenarios, allowing for physical constraints on wind turbine installation, are indicated in figure 1. While CF decreases in winter and spring over most of continental India, changes are largely spatially inhomogeneous in summer and fall. Regions with the largest onshore wind resource in India are in the South and West (Lu et al 2020), which both exhibit an increase in CF (on the order of 10%) in the summertime, when the winds are strongest because of the South Asian Summer Monsoon. Changes to the aerosol and greenhouse gas forcings between the historical and future scenarios could alter the position and strength of the monsoon, allowing for greater wind resource over the wind-rich regions of India. This increase in CF is also found in all seasons over Southeast Asia—where the seasonal monsoons play a notable role in determining the local climate. It is also noteworthy that we find a decline in CF in North China, particularly Inner Mongolia in spring, summer and fall. This region coincides with most of China's current onshore wind capacity and its most abundant resource of wind potential. This declining trend in the future period is consistent with results from Sherman et al (2017), which found that a weakened land-sea temperature gradient as a consequence of anthropogenic climate change reduced wind potential in Inner Mongolia over the historical record in assimilated meteorological data. Of note also is the general consistency in the direction of the CF change for RCP2.6 over most regions (albeit, weaker in magnitude for RCP2.6; figure S1 (available online at stacks.iop.org/ERL/16/034057/mmedia)), suggesting that the trends indicated in figure 1 are consistent across the scenario spread. There are largely no notable trends in offshore wind, consistent with historical analysis for China in Sherman et al (2020a).
3.2. Seasonal and diurnal wind changes
Intermittency of electricity generated from wind power is often a concern with large-scale integration; the wind does not blow all the time. This can create issues with the grid that can persist even with abundant installed capacities for wind—in particular, shortages when winds are weak and curtailment when wind power produces more than the demand for electricity. There are many approaches that could be used to address this problem, for example installation of dispatchable sources such as hydroelectric or natural gas power plants. To know how large-scale integration of wind power would impact grid flexibility in the future, however, we should assess how seasonal and diurnal variability of wind potential might change. Changes in the spatial patterns of seasonally-aggregated three-hourly variability are indicated in figure 2. The three-hourly variability decreases over northern China year-round. In contrast, India's wind-rich regions in the west and south exhibit greater seasonal variability, with decreases in variability in winter and spring and increases in summer and fall. Generally, the variability shown in figure 2 correlates highly with the changes in mean CF shown in figure 1. This makes sense because regions with an increase in mean CF may have higher peaks and therefore greater variability throughout the day. These results are again consistent with those from RCP2.6 (figure S2), which indicate similar spatial seasonal patterns that are weaker in magnitude relative to the RCP8.5 counterpart.

Figure 2. Multimodel mean difference in seasonally-aggregated three-hourly variability in capacity factor (CF) in the studied regions over the period 2030–2060 in the RCP8.5 simulations relative to the period 1970–2000 in the historical simulations in the three models studied here. (a) Represents December–January–February, (b) March–April–May, (c) June–July–August and (d) September–October–November. Variability is defined here as one standard deviation. Dark blue borders within India and China denote the different regions studied in our analysis. Offshore wind areas are shown only for China. Light gray areas (e.g. over the Himalayas) indicate land unsuitable for onshore wind installations and dark gray areas indicate regions where the three studied models do not agree on the direction of the change in CF variability.
Download figure:
Standard image High-resolution imageChanges in the hourly profile can more clearly be seen in figure 3, which shows the difference between the historical period and RCP8.5 in the onshore wind frequency spectrum. Two frequencies are particularly notable for both China and India: at 1 and 2 d−1. Decreases in the amplitude at these two frequencies indicate that signals at these frequencies are weaker in RCP8.5 than over the historical period. These frequencies correspond to diurnal variability, implying that the difference between peaks and troughs in the day–night cycle is projected to be weaker in the future. So while there may be a decline in potential for both countries, a weaker diurnal variability may actually be beneficial in terms of balancing the power system. It is therefore not as clearly beneficial to have an increase in wind resource as one may think—such an increase may also be linked to greater diurnal variability, demanding grid flexibility to allow for wind power to be a significant contributor. Similarly, the converse is true. For example, a slightly weaker wind resource in northern China may allow for less variable electricity generation in the region and easier large-scale grid integration of onshore wind.
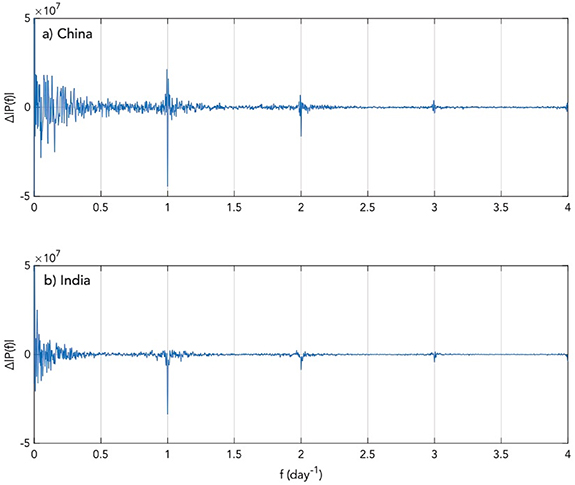
Figure 3. Changes in the single-sided amplitude spectrum of aggregated onshore wind power between the historical (1970–2000) and RCP8.5 (2030–2060) periods for (a) China and (b) India. The y-axis indicates the change in the signal's amplitude at a given frequency; negative values indicate frequencies where the power of the signal weakens in the RCP8.5 period (i.e. at f = 1 d−1 and 2 d−1, the amplitude of the signal decreases, implying a weakening of the diurnal cycle relative to the historical period).
Download figure:
Standard image High-resolution image3.3. Available potentials in China and India
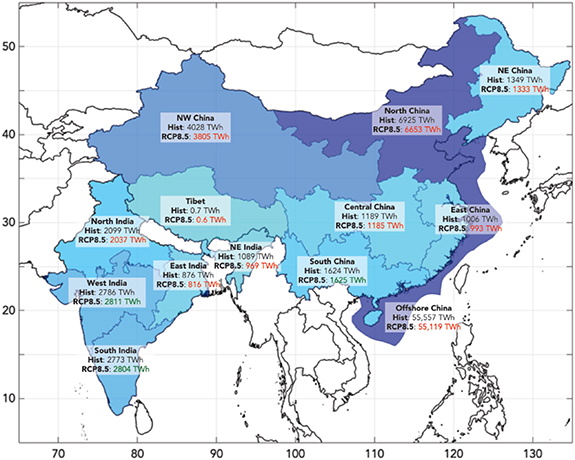
While we find changes in wind CF for some regions in China and India as indicated in figure 1, it is important to understand how this actually is manifest in terms of changes in the annual wind power potential over the region. Figure 4 shows the CORDEX historically-averaged (1970–2000) and RCP8.5-averaged (2030–2060) annual on- and offshore wind potential aggregated regionally. In six of the seven regions in China, there is a decline in wind potential projected in RCP8.5, with the largest percent decrease in northwest China of almost 6% (223 TWh). The percent magnitude of this trend is consistent generally with the analysis in Sherman et al (2017), which found a decrease in northwest China of 3.41% per decade in the historical assimilated meteorological data. Also consistent with Sherman et al (2017) is the fact that China's regions with the best wind resource (north and northwest) exhibit the greatest decline in potential. The overall potential in China is projected in the CORDEX models to decrease by 1% (965 TWh), larger in magnitude than the present-day electricity generation from wind power in China (366 TWh; IRENA). Similar to China, India is also projected to have an overall decline in wind potential of 2% (186 TWh). However, a distinct difference between India and China is the fact that India's two optimal wind regions (the west and south) are actually projected to increase their available resource in the future, by roughly 56 TWh (1%). Given the climatological sensitivity of south and west India to the summer monsoon, there is reason to suspect that changes to the regional aerosol emissions could play a role in India's future wind resource. That is to say, regional aerosol emissions can influence the land-sea temperature gradient, which modulates the strength and position of the summer monsoon. Changes in the monsoon's strength and position could then impact the spatial pattern of near-surface winds, affecting the available wind resource of the region. Regardless, we note that the magnitudes of these changes generally are small, on the order of a few percent even for the largest regions. This is an important and positive consideration, as it indicates that because the overall available wind resource is so large for both China and India changes in wind potential associated with anthropogenic climate change should not present a major concern for future wind installation over these regions. In the context of future wind farm construction, China has plans to expand its onshore wind capacity in Gansu and Inner Mongolia, both of which are located in the north and may be susceptible to lower CFs in the summer and fall. As with the rest of the region, these CF changes are on the order of a few percent (as indicated in figure 1) and therefore should not be used as a reason to impede progress in wind farm construction. India has plans to expand its onshore wind capacity, with major manufacturers considering development in Maharashtra, a state whose potential is expected to increase slightly in the summer and fall, with less notable changes in the winter and spring.
Figure 4. Map of regional wind power potential changes (TWh) for India and China. Shading of the region is ordered by potential, with highest values being represented by darker blue. The CORDEX multimodel mean historical (over the period 1970–2000) potential is noted as 'Hist' for each region, and the mean RCP8.5 (2030–2060) is noted as 'RCP8.5'. Red text indicates a decrease relative to the historical values and green indicates an increase. The wind power potential values indicated here all represent annual figures.
Download figure:
Standard image High-resolution image
4. Discussion and conclusions
The purpose of this study was to assess changes to wind power potential over China and India under future emissions scenarios. We used the assembly of models publicly available from the regionally-downscaled high-resolution data from CORDEX to study changes in on- and offshore wind potential and variability between historical (1970–2000) and future (2030–2060) periods.
There are a number of key results revealed by this study which could have important bearing on grid integration of wind in China and India for future electricity systems planning. Consistent with past work studying historical changes, we find that wind in China's optimal resource regions (northern China, particularly Inner Mongolia) is expected to decline in the future. Overall, the available annual electricity generation potential from on- and offshore wind in China could decrease in aggregate by 965 TWh (1%), a larger magnitude than what is presently generated with China's onshore wind installations. Projected changes in India are more spatially variable, with its high-resource regions (the west and south) actually expected to increase in the future. Aggregated over all of India, a small decline, of roughly 186 TWh (2%), is still expected. It is of note that slightly weaker negative trends are found over China in RCP2.6, but the positive trends in India's west and south regions are not found at all (figure S3). Compensating for the declining resource are weakened seasonal and diurnal variabilities, allowing for easier large-scale wind power integration by potentially lowering dependence on dispatch technologies in a renewables-dominated electricity system. We conclude that while the multimodel ensemble indicates available wind resource over China and India may decline slightly in the future, there remains impressive potential for significant wind power expansion, which must play a major role in carbon neutral aspirations. Additionally, the changes between the historical period and future scenarios are subject to uncertainty from year-to-year variability. The ratio of the mean seasonal CF change to the seasonal variability (figure S4) indicates that the seasonal changes observed in figure 1 are minor relative to the interannual variability. For these reasons, we find therefore that future regional climate change should not have significant bearing on the projected available wind resource and should thus not present itself as a major concern for future wind power integration studies.
Future analysis should explore projections for solar potential, another technology that could also be subject to regional climate changes. Changes in solar potential are likely more difficult to project given the difficulty in simulating microphysical cloud processes in GCMs which can have large bearing on the available solar resource (Bergin et al 2017). Comparison of the CORDEX results with other climate models would provide an important point of reference for any model biases here. It is difficult to appropriately handle bias correction in models; observations in conjunction with bias correction approaches have recently been used, for example, to adjust reanalysis wind speeds in Mexico (Morales-Ruvalcaba et al 2020), though the improvement of the reanalysis was location dependent with regions near complex orography being particularly problematic. This challenge is, of course, exacerbated further by the fact that we are considering future climate scenarios, where adjustment techniques applied for present-day climate may not be appropriate in the future. Notably, the CORDEX group has developed a few bias adjustment simulations ('CORDEX-Adjust'; IPCC 2015), though simulations for the region studied here are not presently available. While future research should further validate and adjust the CORDEX simulations used here, it should be noted that the mean and standard deviation of the multimodel CORDEX CF are largely spatially consistent with ERA reanalysis over the studied region (figure S5). There are some regions where the CORDEX ensemble and ERA differ, for example the mean offshore CF for China is larger in CORDEX than ERA, and the standard deviation is slightly smaller. Bias adjustments could improve the CORDEX data, though we would not expect these corrections to have bearing on our results; if anything, a larger standard deviation in CF to be consistent with the reanalysis product would further validate our conclusion that future changes are small relative to interannual variability. Additionally, as aerosol load is projected to decrease in China and increase in India over the coming decades (Samset et al 2019), it is expected that the available solar resource could change in the future. However, if the solar power trends are consistent with the expected trends for wind power addressed in this paper, the changes should be minor relative to the abundant, untapped resource available.
Acknowledgments
This study was supported by the Harvard Global Institute.
Data availability statement
The data that support the findings of this study are openly available at the following URL/DOI: https://esgf-data.dkrz.de/search/cordex-dkrz/.
Author contributions
All authors contributed equally to the genesis of this manuscript.
Conflict of interest
The authors declare no competing interests.