

Abstract
Rivers are essential to human livelihoods and agricultural production, yet human usage and irrigation are jeopardizing river sustainability. It is thus crucial to investigate the fine-scaled spatiotemporal dynamics of anthropogenic pressures on rivers. Most research, however, is conducted at the grid-scale, which impedes detailed investigations. In this study, by tracking anthropogenic pressures at the scale of river reaches (the length of river between river confluences) in South and Southeast Asia from 1990 to 2014, we provide new insights into anthropogenic pressures on river reaches using a simple and straightforward approach. We selected human usage (represented by built-up area) and irrigation (represented by irrigated area) as two fundamental indicators of anthropogenic pressure. We divided the study area into 5 × 5 km grids and calculated anthropogenic pressures on each grid to its nearest river reach. Pressures were calculated as the ratio of built-up and irrigated area to the distance between grids and reaches. Groundwater was also included to adjust for additional irrigation-induced pressures on reaches. Anthropogenic pressures on each reach were then calculated by summing pressures from the two indicators of all grids attached to it. Results indicate that >50% of reaches are affected by anthropogenic activities and that average pressures increase by ∼15% from 1990 to 2014, with hotspots concentrated in eastern Pakistan and northern India. Irrigation is the dominant pressure on ∼33% of reaches, while human usage is dominant for ∼24% of reaches. Anthropogenic pressures within transboundary river basins vary longitudinally, increasing as distance from the ocean declines. Pressures also vary significantly with reach size. Although large rivers suffer from greater anthropogenic pressures, they are rising more rapidly for small rivers. Empirically, this study reveals the increasing and heterogeneous nature of anthropogenic pressures on river reaches in South and Southeast Asia. Methodologically, it suggests that reach-scale river sustainability assessment can serve as a promising approach for researching and managing regional and transboundary rivers.
Export citation and abstract BibTeX RIS

Original content from this work may be used under the terms of the Creative Commons Attribution 4.0 license. Any further distribution of this work must maintain attribution to the author(s) and the title of the work, journal citation and DOI.
1. Introduction
Rivers have long played a vital role in the development of human civilization (Smith 2020). While taking up only ∼0.58% of the Earth's non-glaciated land surface (Allen and Pavelsky 2018), rivers are a crucial source of clean water, food, sanitation, agricultural production, and energy generation. Throughout history and especially since the first Agricultural Revolution ∼12 000 years ago, human settlements have tended to form in close proximity to rivers (UNESCO 2009, Kummu et al 2011, Ceola et al 2015, Fang and Jawitz 2019). Now, with rapid urbanization, continued population growth, and rising demand for food, many rivers are experiencing intensifying anthropogenic pressures, jeopardizing their sustainability (Dudgeon et al 2006, Haddeland et al 2014, Veldkamp et al 2017, Best 2019).
Activities including human usage (both domestic and industrial use) and irrigation depend significantly on river flow and place enormous anthropogenic pressures on rivers (Haddeland et al 2006, Gerten et al 2008, Döll et al 2009, Biemans et al 2011). Pressures from such activities can thus impact river sustainability (Döll et al 2012, Elliott et al 2014, Wada and Bierkens 2014, Dieter et al 2018). Impacted rivers face problems such as decreasing runoff (Kezer and Matsuyama 2006, Wang et al 2009), low river connectivity status (Grill et al 2019), aquatic pollution (Mekonnen and Hoekstra 2018), and biodiversity loss (Benchimol and Peres 2015, Lees et al 2016). Such problems will impede progress in achieving the sixth United Nations Sustainable Development Goal, which is clean water and sanitation (UN 2015). Therefore, it is imperative to assess anthropogenic pressures on rivers, particularly in terms of determining their changes over space and time and the locations of rivers experiencing the most significant pressures—in other words, the 'hotspots' of anthropogenic pressures.
South and Southeast Asia are two regions facing particularly severe socio-hydrological issues. Their rivers, most of which originate in Himalayan glaciers (Brookfield 1998), are under intense anthropogenic pressures for various reasons. First, two billion people live in this densely but unevenly populated area, with residents placing varying demands on river resources (Kummu et al 2014, Biemans et al 2019). Second, South and Southeast Asia have a long history of irrigation. Together, they form the world's most irrigated area (Mukherji et al 2011), with irrigation accounting for 80% of freshwater withdrawals in the region (Xiao et al 2006). The sources of irrigation within South and Southeast Asia are diverse: Most of South Asia is irrigated by groundwater, while Southeast Asia is irrigated by surface water (Siebert et al 2010). The difference of irrigation water sources exerts heterogeneous pressures on rivers. Third, several large transboundary rivers flow through South and Southeast Asia, crossing the borders of countries such as China, India, and Pakistan. For example, the Mekong river in Southeast Asia runs through six countries: China, Vietnam, Laos, Thailand, Cambodia, and Myanmar. Given these rivers' geopolitical complexity and competing societal, economic, and environmental demands, conflicts frequently emerge over transboundary river management (Wolf et al 2003, De Stefano et al 2017, Gleason and Hamdan 2017). In an effort to better inform management and improve the sustainability of the region's rivers, assessing spatiotemporal variations in anthropogenic pressures on South and Southeast Asia's waterways is crucial. Such research may provide lessons for both future scientific investigations and policymaking regarding regional and transboundary river management, too.
Most existing river sustainability assessments focus on water scarcity, or whether existing freshwater resources are able to fulfill human demands. The distinct and variegated impacts of anthropogenic activities receive relatively less attention (Vörösmarty et al 2000b, Gosling and Arnell 2016, Kummu et al 2016, Mekonnen and Hoekstra 2016). In the 2000s, an estimated 3.8–4 billion people—more than half the world's population—faced water scarcity issues (Kummu et al 2016, Mekonnen and Hoekstra 2016). Although studies of water scarcity combine several indicators including water availability and demand and consider freshwater from a number of sources (e.g. lakes, rivers, and groundwater), changes in anthropogenic pressures on rivers with different sizes may be obscured in water scarcity analyses due to variable water availability (Rockström et al 2009, Liu et al 2017). With South and Southeast Asia experiencing rapid population growth and irrigation expansion (Zhao et al 2020), it is necessary to separate the impacts of anthropogenic pressures on rivers.
A number of key studies investigate the spatiotemporal dynamics of anthropogenic pressures on rivers. Vörösmarty et al (2010) find that in 2000, 65% of global rivers faced moderate to high human threats. Grizzetti et al (2017) determine that only a third of European rivers are in good ecological status. Using nighttime lights imagery, Ceola et al (2019) estimate that anthropogenic pressures on rivers increased globally from 1992 to 2013. Grill et al (2019) reveal that >500 km free-flowing rivers are largely absent from densely populated areas. All of these studies underscore the deterioration of global river sustainability over space and time due to intensifying human activities.
Nevertheless, existing river sustainability assessments are primarily carried out at the grid scale (Vörösmarty et al 2010, Ceola et al 2019), particularly at a resolution of 0.5° (∼55 km at the equator). In contrast, less work focuses on reach-scale rivers (Grill et al 2019). River reaches are defined as the length of river between river confluences (Grill et al 2019, Lin et al 2019, 2020). Compared to studies using low-resolution grids, reach-scale analysis can more precisely incorporate data on river hydrography including width, flow, and stream order. Moreover, small rivers, which form crucial components of river networks and which play a vital role within wider land-atmosphere interactions including greenhouse gas emission dynamics (Benstead and Leigh 2012, Butman et al 2016, Allen et al 2018, Lu et al 2020), may not be represented within low-resolution grids. Consequently, our understanding of the sustainability of small rivers based on grid-scale analysis is severely limited. Reach-scale analysis can better resolve small rivers and add to our knowledge of small river sustainability. For these reasons, examining river reaches rather than gridded rivers allows for more accurate delineation of spatiotemporal anthropogenic pressures on different sections of rivers, shedding light on changes to socio-hydrological systems.
In this study, we conduct a simple and straightforward assessment of the spatiotemporal dynamics of anthropogenic pressures on river reaches in South and Southeast Asia from 1990 to 2014 with particular attention to the variations in pressures on low-order small rivers and transboundary rivers. We aim to estimate potential water demand at reach-scale, selecting human usage (comprising both domestic and industrial use) and irrigation as our two fundamental indicators of anthropogenic pressures. Irrigation sources are also included to account for irrigation-induced pressures on river reaches. Then, to estimate these anthropogenic pressures on river reaches and identify hotspots, we incorporate several new remotely sensed datasets: the Multi‐Error‐Removed‐Improved‐Terrain (MERIT) Basins dataset for river networks, the European Space Agency's Climate Change Initiative (ESA-CCI) land cover product for irrigated area, and the Global Human Settlement (GHS) dataset for anthropogenic activities. We analyze the status change of rivers from 'healthy' (i.e. unaffected by anthropogenic pressures from human usage or irrigation) to 'unhealthy' and discuss the dominant pressure affecting river sustainability. Lastly, we examine the variations in anthropogenic pressures depending on the distance of the river reach from the ocean, termed 'longitudinal anthropogenic pressures,' in transboundary river basins within South and Southeast Asia.
2. Study area
We choose South Asia and Mainland Southeast Asia as our study area (figure 1), a region that includes 13 countries (China, Pakistan, India, Nepal, Bhutan, Bangladesh, Sri Lanka, Myanmar, Laos, Thailand, Cambodia, Vietnam, and Malaysia). We use the HydroBASINS database (Lehner and Grill 2013) to identify the largest river basins ('Level 3 Basins') within this region: the Indus, Ganges-Brahmaputra, Salween-Irrawaddy, and Mekong river basins (figure A1). These four are all transboundary river basins originating in the Tibetan Plateau (Brookfield 1998, Clift 2002, Ziv et al 2012). At the end of our study period in 2014, irrigated area covered nearly 1.2 × 10⁶ km2 (∼13.9% of the total study area), concentrated primarily in eastern Pakistan, northern India, Bangladesh, and the areas near the river outlets of the Salween-Irrawaddy and Mekong rivers (figure 1). Irrigation water in South and Southeast Asia is commonly taken from groundwater and surface water, with India and Pakistan depending on groundwater (Siebert et al 2010, 2013). Although built-up area is sparsely distributed and covered only 7.5 × 10⁴ km2 (∼0.9% of the total study area) in 2014, it increased by 80.7% between 1990 and 2014.

Figure 1. Study area. Four transboundary river basins (Indus, Ganges-Brahmaputra, Salween-Irrawaddy, and Mekong) and their main rivers are presented. The red and yellow pixels represent built-up and irrigated areas in 2014.
Download figure:
Standard image High-resolution image3. Data and method
3.1. Data
We use the MERIT Basins to represent river networks. This new dataset created by Lin et al (2019) reconstructs the global river networks from MERIT Hydro at a 3-arc-second resolution (∼90 m at the equator) (Yamazaki et al 2019). A 25 km2 drainage area threshold was selected for channels to derive river flowlines as per Lin et al (2019). Although there are currently several river network datasets (Vörösmarty et al 2000a, Allen and Pavelsky 2018), we use MERIT Basins because it includes numerous low-order small rivers. The bankfull width of low-order small rivers ranges from 32.7 to 2444.5 m (Lin et al 2020). We clip MERIT Basins using the study area boundary to obtain a total of 155 443 river reaches, yielding a drainage density of 0.2 km−1 and an average reach length of 9.6 km (figure A1).
We use the GHS built-up area dataset to estimate anthropogenic pressures from human usage (both industrial and domestic use). Built-up area describes the distribution of industry and human settlement (i.e. human presence), and represents human usage on river water (Vörösmarty et al 2010). Developed by the European Commission's Joint Research Centre, the GHS dataset depicts 30 m global multi-temporal built-up area derived from Landsat imagery (Pesaresi et al 2013, Martino et al 2016, Kemper et al 2017). This dataset has the highest accuracy (89.0%) of all freely accessible global long-term built-up area datasets (Liu et al 2019). We extract built-up area in South and Southeast Asia for the years 1990, 2000 and 2014.
To model irrigation, we use the irrigated area dataset from the ESA-CCI. The ESA-CCI irrigated area dataset is derived from the ESA-CCI Land Cover product, which consists of 300 m annual global land cover with 36 classes from 1992 to 2018 (Bontemps et al 2013). We use the land cover class most closely related to irrigation, 'Cropland, irrigated or post-flooding,' to represent irrigated area in 1992 (as data for 1990 is unavailable), 2000, and 2014.
We use the Digital Global Map of Irrigation Areas (GMIA) to obtain the contribution of surface water to total irrigation water demand (Siebert et al 2013). GMIA categorizes the sources of irrigation water into surface water, groundwater, and non-conventional water at a 5-minute scale. We use the map of irrigation water taken from surface water to represent irrigation water from rivers.
3.2. Methodology
We propose a simple and straightforward approach to estimate dynamic anthropogenic pressures on river reaches (figure 2). Human usage and irrigation were selected as our two essential indicators of anthropogenic pressures on river sustainability. We calculated the pressures induced by each of our two indicators and summed them to obtain the total anthropogenic pressures on river reaches (figure 2).
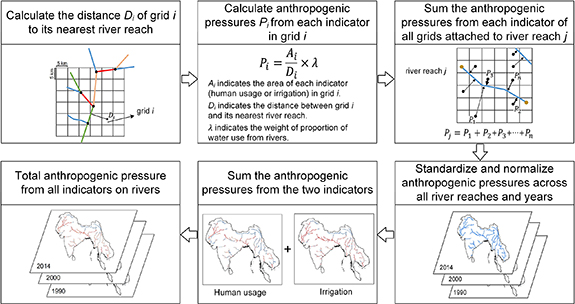
Figure 2. Framework for assessing anthropogenic pressures on river reaches.
Download figure:
Standard image High-resolution imageFirst, the study area was divided into 5 × 5 km grids. Next, the built-up and irrigated area within each grid were calculated. Then, we calculated the distance of each grid centroid to its nearest river reach using the Near tool in ArcGIS 10.3. Each grid was associated with one river reach, which was based on the assumption that humans are more likely to use water from the river reach closest to them (Kummu et al 2011, Fang et al 2018, Fang and Jawitz 2019). The distance reflects the capacity of anthropogenic pressures on rivers, for the closer anthropogenic activities are to a river reach, the more anthropogenic pressures it bears (Kummu et al 2011, Fang and Jawitz 2019). As such, the pressures induced by each indicator on each river reach were calculated as follows:
where Pj indicates the pressures induced by each indicator on river reach j. Ai is the area (km2) of each indicator in grid i. Di is the distance (km) of grid i to its nearest river reach j. λ represents the proportion of water for human usage or irrigation sourced from rivers. We set λ= 1 to estimate anthropogenic pressure from human usage, and obtain λ for estimating irrigation-induced pressure from the GMIA dataset. N represents the number of all grids attached to river reach j. To calculate N, we first obtained the river reach ID closest to each grid. Then, taking each river reach as a unit, we counted all grids associated with the river reach.
Next, the anthropogenic pressures across all 155 443 river reaches from each indicator were standardized and normalized. To compress extremely high values, we standardized our results using the Cumulative Distribution Function (CDF). CDF standardizes the pressure of each river reach by calculating its percentile relative to the frequency distribution of pressure across all reaches (Vörösmarty et al 2010). The standardized values were then normalized to a continuous 0–1 scale by subtracting the minimum anthropogenic pressures and dividing by the pressure range across all river reaches and years.
Finally, the total anthropogenic pressures on each river reach were obtained by summing the values of the two indicators, with total sums ranging from 0 to 2. We used the Strahler stream orders of 1–3 and >6 to identify small and large river reaches (Vannote et al 1980, Allen et al 2018), respectively, and analyzed corresponding differences in anthropogenic pressures. The growth rate of anthropogenic pressures was calculated as the ratio of the difference value in a given period to the anthropogenic pressures in the starting year. The dominant pressure on river reaches was determined to be the higher of the two indicators. If anthropogenic pressures caused by the two indicators were equal, the dominant pressure indicator was determined to be the combined impacts of human usage and irrigation.
4. Results
4.1. Spatiotemporal variations of anthropogenic pressures on river reaches
In 2014, the average anthropogenic pressure on the 155 443 river reaches in our study area was 0.4, representing an increase of 14.8% since 1990. Our finding of increasing anthropogenic pressures is consistent with Ceola et al (2019). Only 41.2% of total river reaches are 'healthy' in 2014, or unaffected by anthropogenic pressures from human usage or irrigation. This marks a decrease of 12.5% (from 73 164 to 63 985) from 1990 (figure 3). Healthy river reaches are mainly concentrated in the southern areas of the Tibetan Plateau, whose steep, high-altitude mountains are unsuitable for human settlement and irrigation (Chen et al 2013). Different areas also exhibit heterogeneity in spatial patterns of anthropogenic pressures on river reaches (figure 3). For example, anthropogenic pressures on river reaches near the southern Himalayas have remained low since 1990. In contrast, reaches near eastern Pakistan, northern India, Bangladesh, southern Thailand, and southeast Vietnam are consistent hotspots of anthropogenic pressures throughout our study period (figure A2), indicating stable patterns of human settlement and irrigation over time. Finally, in places such as India, Pakistan, and Bangladesh where irrigation relies heavily on groundwater, its depletion over time may intensify anthropogenic pressures on river reaches (Wada et al 2010, 2012) (appendix A4).
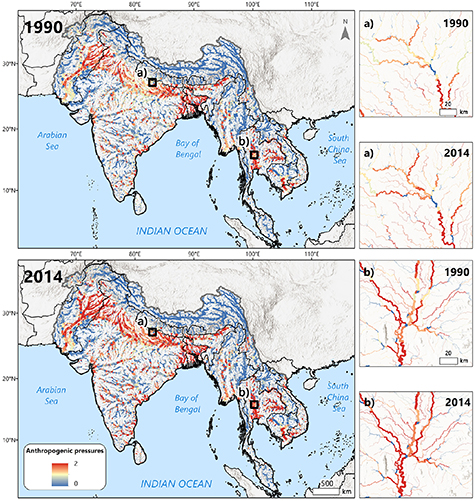
Figure 3. Anthropogenic pressures on river reaches in South and Southeast Asia from 1990–2014. Rivers with stream orders >2 are shown in the main subfigures at left. All river reaches (stream orders 1–8) are included in the four inset maps.
Download figure:
Standard image High-resolution imageRiver reaches in eastern Pakistan and northern India exhibit similar trends in anthropogenic pressures, which increase more rapidly than in other parts of South and Southeast Asia from 1990 to 2014 (figure 4). These two densely populated areas have the greatest spatial concentration in increases in anthropogenic pressures (figure A2). The 1724 river reaches that experienced a decrease in anthropogenic pressures were scattered across a much wider area (figure 4). These decreases are possibly due to the observed transformation of irrigated land into other non-built-up land cover types (e.g. grassland and forest) (Li et al 2019), which may have helped reduce anthropogenic pressures on river reaches.
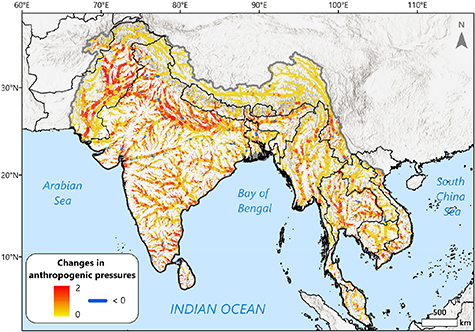
Figure 4. Changes in anthropogenic pressures on river reaches in South and Southeast Asia from 1990–2014. Rivers of stream orders >2 are shown.
Download figure:
Standard image High-resolution image4.2. Dynamic anthropogenic pressures on river reaches of different sizes
Anthropogenic pressures on river reaches are found to increase with stream order, with larger (higher-order, >6) rivers facing more intense anthropogenic pressures than smaller (lower-order, 1–3) rivers (figure 5(a)). The average anthropogenic pressures were 0.4 on reaches within small rivers and 0.6 on reaches within large rivers, increasing by 50.0% between small and large rivers (table 1). The average anthropogenic pressures on first-order rivers were 0.4 in contrast to 1.0 on eighth-order rivers, increasing by 150.0% between first-order and eighth-order rivers (figure A3). This difference may be due to the fact that areas near large rivers tend to run through large floodplains, which are more suitable for human activities than areas adjacent to small rivers (Di Baldassarre et al 2013). Anthropogenic pressures on small rivers, however, increased more rapidly than those on large rivers (figure 5(a)), and in a statistically significant manner, too (table 1). The average anthropogenic pressures on first-order rivers increased by 15.8% from 1990 to 2014, in contrast to 13.3% on eighth-order rivers. Low-order small rivers are expected to bear much more anthropogenic pressures than high-order large rivers if groundwater overexploitation persists (appendix A4). Notably, the opposite results were obtained when estimating water scarcity, which includes water availability. Since high-order large rivers have greater discharge than low-order small rivers, water scarcity poses less of an issue for them (0.01 for large rivers vs 0.38 for small rivers, appendix A5).
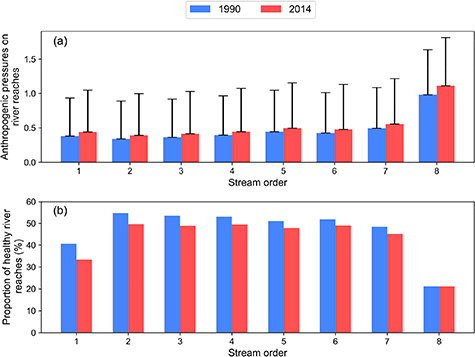
Figure 5. (a) Change over time in anthropogenic pressures on river reaches based on stream order. (b) Change over time in proportion of healthy river reaches based on stream order.
Download figure:
Standard image High-resolution imageTable 1. Estimates of average anthropogenic pressures on river reaches from 1990 to 2014.
| Stream order | River reaches | Average pressures (1990) | Average pressures (2014) | p-value (t-test) |
|---|---|---|---|---|
| 1 | 78807 | 0.38 | 0.44 | <0.001 |
| 2 | 36893 | 0.34 | 0.39 | <0.001 |
| 3 | 20189 | 0.36 | 0.41 | <0.001 |
| 4 | 10641 | 0.39 | 0.44 | <0.001 |
| 5 | 4744 | 0.44 | 0.49 | <0.001 |
| 6 | 2723 | 0.42 | 0.48 | 0.002 |
| 7 | 1290 | 0.49 | 0.55 | 0.011 |
| 8 | 156 | 0.98 | 1.11 | 0.093 |
The number of healthy small river reaches decreased more rapidly than the number of healthy large river reaches (figure 5(b)). The proportion of healthy river reaches from orders 1 to 7 decreased from 1990 to 2014, within which the healthy first-order rivers had the largest decrease of 7.3%. The proportion of healthy first-order river reaches is lower than that of reaches from orders 2 to 7 (figure 5(b)). The is because first-order river reaches are both densely and widely distributed across the study area, with more than twice as many first-order as second-order river reaches (78 807 vs 36 893). Therefore, a large number of first-order river reaches are linked with a grid, meaning they are subject to pressure from nearby surrounding anthropogenic activities. The proportion of healthy eighth-order river reaches (21.1%) remained unchanged over the 25-year period (figure A4). The results reveal that although large rivers initially did and still do experience the greatest anthropogenic pressures, built-up and irrigated areas are rapidly encroaching upon small rivers, whose sustainability is increasingly at risk.
4.3. Dominant pressure indicator on river reaches
We further investigated the dominant pressure on river reaches (figure 6). In 2014, irrigation accounted for the dominant pressure on 33.3% of total river reaches, while human usage accounted for the dominant pressure on 24.0% of river reaches. These latter river reaches were concentrated in the Malay Peninsula, where irrigated area is sparse due to the presence of steep hills and mountains (Cavendish 2007). Human usage also predominantly influenced a number of river reaches in India and Bangladesh due to the combined factors of significant built-up area and the presence of sufficient local groundwater sources to help relieve pressure on irrigation water (appendix A5). The combined pressures from human usage and irrigation account for 1.6% of total river reaches, mainly in eastern Pakistan, southern Thailand, and Bangladesh (figure 6). Large rivers appear more susceptible to the combined pressures of human usage and irrigation, while small rivers tend to be dominated by a single pressure (table 2). For example, although human usage is the main pressure on 29.9% of first-order rivers, this is only the case for 14.8% of eighth-order rivers. In contrast, the combined impacts of human usage and irrigation affect 4.5% of eighth-order rivers, compared to 1.5% of first-order rivers.
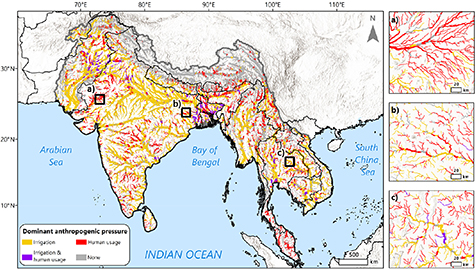
Figure 6. Dominant anthropogenic pressure on river reaches in 2014. Rivers with stream orders >2 are presented in the left subfigure. All river reaches (stream orders 1–8) are included in the three inset maps (a)–(c).
Download figure:
Standard image High-resolution imageTable 2. Number and proportion of river reaches under different dominant anthropogenic pressures (irrigation and human usage) categorized according to stream order in 2014.
| Stream order | Dominant anthropogenic pressure | |||
|---|---|---|---|---|
| None | Both | Irrigation | Human usage | |
| 1 | 26 320 (33.4%) | 1169 (1.5%) | 27 753 (35.2%) | 23 565 (29.9%) |
| 2 | 18 324 (49.7%) | 585 (1.6%) | 10 615 (28.8%) | 7369 (19.9%) |
| 3 | 9859 (48.8%) | 318 (1.6%) | 6305 (31.2%) | 3707 (18.4%) |
| 4 | 5262 (49.5%) | 172 (1.6%) | 3615 (33.9%) | 1592 (15.0%) |
| 5 | 2272 (47.9%) | 104 (2.2%) | 1783 (37.6%) | 585 (12.3%) |
| 6 | 1333 (49.0%) | 55 (2.0%) | 1013 (37.2%) | 322 (11.8%) |
| 7 | 582 (45.1%) | 21 (1.6%) | 518 (40.2%) | 169 (13.1%) |
| 8 | 33 (21.1%) | 7 (4.5%) | 93 (59.6%) | 23 (14.8%) |
4.4. Variations in anthropogenic pressures across transboundary river basins
Since 1990, anthropogenic pressures in the Ganges-Brahmaputra river basin have consistently remained the highest (∼0.5) of all four transboundary river basins examined (figure 7). This river basin experiences the lowest anthropogenic pressure increment (3.8% from 1990 to 2000 and 4.9% from 2000 to 2014), indicating a relatively stable speed of urbanization and intensification of irrigation. The Indus river basin exhibited the next highest level of anthropogenic pressures (∼0.4), although its value increased the most rapidly of the four river basins (by 10.4% from 1990 to 2000 and 10.8% from 2000 to 2014). The finding suggests that the Indus river basin exhibits a higher speed of urbanization and intensified irrigation than the other three transboundary river basins. Compared to South Asia, anthropogenic pressures in Southeast Asia were relatively low (∼0.2) from 1990 to 2014 (figure A3), with an average increase of 8.5% and 6.9% in the Mekong and Salween-Irrawaddy river basins, respectively.
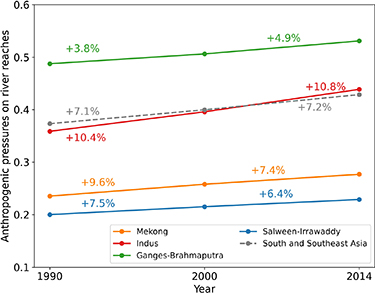
Figure 7. Variations in anthropogenic pressures on river reaches in the four studied transboundary river basins from 1990 to 2014. The grey dotted line represents the average anthropogenic pressures on river reaches within the entire study area.
Download figure:
Standard image High-resolution imageAlthough anthropogenic pressures exhibited an overall increasing trend, further downstream, different river basins exhibited variations in longitudinal anthropogenic pressures (figure 8). Within the highly impacted Indus river basin, which mostly lies within Pakistan and India, hotspots are located near the Pakistan-India border (figure 8(a)). This concentration is likely due to a certain path dependency: the Pakistan-India border runs through fertile plains that have been home to agricultural activity for thousands of years (Biemans et al 2019), which over time gave rise to major conurbations located near the border such as Lahore in Pakistan's Punjab province and Amritsar in India. River reaches flowing through Pakistan's Punjab province have underwent the fastest increases within the Indus river basin in anthropogenic pressures from 1990 to 2014 (figure 8(a)). Unlike the Indus river basin, in the other three river basins, the greatest anthropogenic pressures all occur near river outlets, where rivers meet heavily populated coastlines (figures 8(b)–(d)). There are evident spikes in anthropogenic pressures in upstream river reaches flowing across China in these three river basins, which suggests high levels of human activities. These intense demands on rivers may affect downstream water usage since such areas are highly dependent on upstream river discharge (Gleason and Hamdan 2017, Munia et al 2020, Viviroli et al 2020). River reaches under intense anthropogenic pressures in the Salween-Irrawaddy river basin are mainly located near the cities of Yangon and Mandalay (Myanmar), Chamdo (China), and along the China-Myanmar border (figure 8(c)). Although the Mekong river extends across 6 countries, hotspots are concentrated in China's Yunnan province, along the Thailand-Laos border, and near the Mekong Delta's river outlets in the South China Sea. Given relatively consistent levels of anthropogenic activities over time, there is little difference in changes in longitudinal anthropogenic pressure dynamics in the Salween-Irrawaddy and Mekong river basins from 1990 to 2014 (figures 8(c) and (d)).
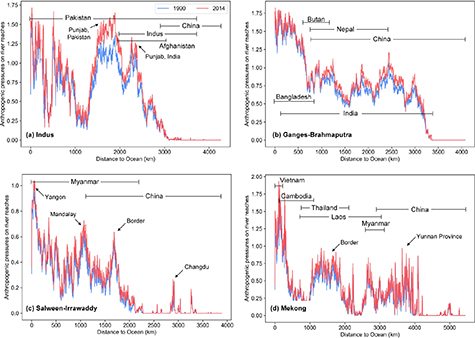
Figure 8. Longitudinal differences in anthropogenic pressures on river reaches in four transboundary river basins from 1990 (blue lines) to 2014 (red lines). All river reaches (i.e. tributaries and main streams) are included in calculating the distance to the ocean and corresponding pressures. Hotspots under intense anthropogenic pressures are labeled.
Download figure:
Standard image High-resolution image5. Discussion
Continued increases in population, economic activity, and agricultural production are jeopardizing river sustainability in South and Southeast Asia (Syvitski et al 2005, IPCC 2013). It is therefore crucial to identify the 'footprint' of these anthropogenic activities on river reaches. Although rivers continuously transport water and sediments downstream and are commonly treated as an integrated system (Regnier et al 2013, Lebreton et al 2017), anthropogenic pressures on rivers differ across both space and time and at fine scales. A robust assessment of these spatiotemporal pressures should account for the fact that actors at a range of scales, from the household to the nationand region, use and manage river reaches of varying stream orders for a wide range of purposes, including urbanization and agriculture (Fazel et al 2017, Popelka and Smith 2020). While overall we conclude that average anthropogenic pressures on river reaches has increased in South and Southeast Asia, a key finding is that river reaches in eastern Pakistan and northern India are experiencing particularly intense and rapid increases in anthropogenic pressures. Rivers in these regions suffer from human-induced problems such as low river connectivity, which affects wider ecosystem functions by impacting fundamental hydrologic processes and biodiversity (Grill et al 2019). With continued groundwater overexploitation, river reaches in these regions are expected to bear even greater anthropogenic pressures (appendix A4). Our results underscore the need to address the separate impacts of rapid urbanization and intensifying irrigation on river reaches worldwide (Liu et al 2020).
5.1. Anthropogenic pressure variations on rivers of different sizes
Our study represents a preliminary attempt to investigate spatiotemporal variations in anthropogenic pressures on river reaches of different sizes. We find that anthropogenic pressures on river reaches with different stream orders are heterogeneous: Small rivers experience a faster increase in anthropogenic pressures and a greater decrease in the number of healthy river reaches than large rivers (figure A4). This is consistent with previous studies, which find that more small rivers than large rivers have disappeared in China, the U.S., and Canada due to rapid urbanization (Elmore and Kaushal 2008, Stammler et al 2013, Han et al 2020). Anthropogenic pressures on large rivers remain high but stable, reflecting the fact that they have long been disturbed by humans due to their conduciveness to settlement and agriculture. These two factors are important reasons why urban areas initially developed near large rivers during the Neolithic Revolution (Di Baldassarre et al 2013, Li et al 2015). With cities along large rivers facing severe water problems such as water scarcity (Li et al 2015), however, built-up and irrigated area are expanding towards small rivers, leading to rapid increases in anthropogenic pressures. Furthermore, due to small rivers' low river discharge levels, increasing anthropogenic pressures will aggravate water scarcity in small rivers (appendix A4). More attention to these little-studied small rivers is critical, for they comprise 88.1% of total river length in our study area and are more sensitive to anthropogenic pressures than large rivers (Kaushal et al 2006, Han et al 2020). Small rivers also perform essential functions, reducing pressures on large rivers by dissolving nutrients that are exported to them and providing clean water (Peterson et al 2001, Meyer et al 2007, Elmore and Kaushal 2008). Increasing anthropogenic pressures on small rivers may thus not only decrease their surface area, discharge, riparian erosion, and stream burial (Burns et al 2005, Napieralski and Carvalhaes 2016, Taniguchi et al 2018), but also aggravate issues facing large rivers such as biodiversity loss, river contamination, and nutrient and sediment increment (Meyer et al 2007).
5.2. Longitudinal variations in anthropogenic pressures on transboundary rivers
While the four transboundary rivers in our study area all originate in the Tibetan Plateau (Brookfield 1998, Clift 2002, Ziv et al 2012), their river reaches show distinct divergences in anthropogenic pressures due to regional and national variations in levels of economic development and irrigation (OECD 2019). Contrary to Ceola et al (2019), we find that anthropogenic pressures increased more rapidly in the Indus river basin than in the Mekong and Salween-Irrawaddy river basins (figure 7). This discrepancy may be due to the fact that the nighttime lights data used within their study is affected by saturation, which means that the digital number (DN) of illuminated pixels cannot be measured beyond a certain level (63) (Levin et al 2020). Given the already high levels of human activities in the Indus river basin, DN values there are saturated and do not vary interannually, meaning that anthropogenic pressure dynamics may be underestimated.
We also identify several 'peaks' of intense anthropogenic pressures on midstream and upstream river reaches in the four transboundary river basins, such as in Punjab (Pakistan) along the Indus river and in Chamdo (China) adjacent to the Salween-Irrawaddy river (figure 8). Intense upstream anthropogenic pressures will impact downstream communities and their river water use because downstream regions are highly dependent on upstream water, possibly sparking tensions and conflicts (Zawahri 2009, Petersen-Perlman et al 2017, Viviroli et al 2020). Greater efforts are required to balance anthropogenic pressures along transboundary rivers' entire watercourses and ensure that the needs of downstream populations can be met. Furthermore, some of the largest conurbations within South and Southeast Asia are located around river outlets, such as Yangon in Myanmar and Dhaka in Bangladesh (Hedley et al 2010). High levels of human activities near river outlets can lead to extremely high anthropogenic pressures (figures 8(b)–(d)), potentially affecting delta morphology and increasing flood risks (Syvitski and Saito 2007, Syvitski et al 2009, Tessler et al 2015). Understanding the sustainability of these vulnerable urbanized deltas both in and beyond Asia will require interdisciplinary research into rivers and how they interact with social, political, and economic systems.
5.3. Limitations and future research directions
Our study develops a simple, straightforward approach to estimate river sustainability by focusing on two fundamental indicators: human usage and irrigation. Although this approach captures the main drivers of anthropogenic pressures on rivers, it has some limitations. For instance, we do not include comprehensive indicators (e.g. dams and water pollution) (Vörösmarty et al 2010), nor do we build complex hydrological models (e.g. WaterGAP, PCR-GLOBWB 2.0) (Yassin et al 2019, Doll et al 2003, Sutanudjaja et al 2018) to assess anthropogenic pressures on rivers. In addition, although reservoir and dam operations play an important role in impacting hydrological processes—especially in South and Southeast Asia, where many have been built to take advantage of significant hydropower potential in recent decades—our study does not include them because we aim to separate the impacts of anthropogenic activities on river reaches (i.e. potential river water demand). In contrast, reservoir operations control water availability by adjusting river discharge (Hanasaki et al 2006, Mateo et al 2014, Zhang et al 2014, Akbas et al 2020, Getirana et al 2020). Furthermore, while we consider the effects of human usage and irrigation to be equal, from the perspective of water use, irrigation exerts a greater effect than human usage (Islam et al 2015, Karthikeyan et al 2020). Lastly, we calculate the anthropogenic pressures of each grid on its nearest river reach and do not consider the anthropogenic pressures on other river reaches due to major water transfer projects such as China's South–North Water Transfer Project (Moore 2014). These issues may all be worth considering in future research.
6. Conclusion
This study tracks the heterogeneous and generally continuously increasing anthropogenic pressures on river reaches in South and Southeast Asia. Rapid increases in human activities pose significant challenges to global river sustainability, especially in the densely populated and highly irrigated regions of South and Southeast Asia. This study investigates spatiotemporal variations in anthropogenic pressures on 155 443 river reaches across these two regions from 1990–2014 by incorporating high spatial resolution remotely sensed datasets. We find that anthropogenic activities affect over half of the river reaches, with average pressures increasing by ∼15% in 25 years—an alarming finding for river sustainability. Irrigation is the dominant pressure in ∼33% of the river reaches.
Anthropogenic pressures vary in the four transboundary river basins studied, and there is a general longitudinal increase in anthropogenic pressures from headwater to ocean despite peaks in certain upstream and midstream reaches. To satisfy human demands for freshwater along the entirety of river courses, governments should prioritize addressing the high anthropogenic pressures on upstream river reaches in transboundary river basins.
Our results also underscore the vulnerability of small rivers to human usage and irrigation. Although large rivers suffer from higher anthropogenic pressures, small rivers are undergoing more rapid increases in anthropogenic pressures. Greater efforts will be required to mitigate this trend, especially in light of the socio-hydrological importance of small rivers. To alleviate the intense anthropogenic pressures affecting small and large river reaches both upstream and downstream, we urge governments and organizations to attend to the spatiotemporal dynamics of heterogeneous anthropogenic pressures on river reaches. Doing so will help advance science-based policymaking in supportof river sustainability and the health and resilience of the global freshwater system.
Acknowledgments
This study was funded by the National Key R&D Program of China (Grant No. 2017YFB0504205), the National Natural Science Foundation of China (Grant No. 41871327), and the Fundamental Research Funds for the Central Universities (Grant No. 14380070).
Data availability
The data that support the findings of this study are openly available at the following URL/DOI: https://doi.org/10.5281/zenodo.4172948.
A1.: Map of river networks in South and Southeast Asia

Figure A1. River networks in the study area, with rivers with stream orders >2 depicted.
Download figure:
Standard image High-resolution imageA2.: Map of anthropogenic pressures on river reaches induced by human usage and irrigation from 1990 to 2014
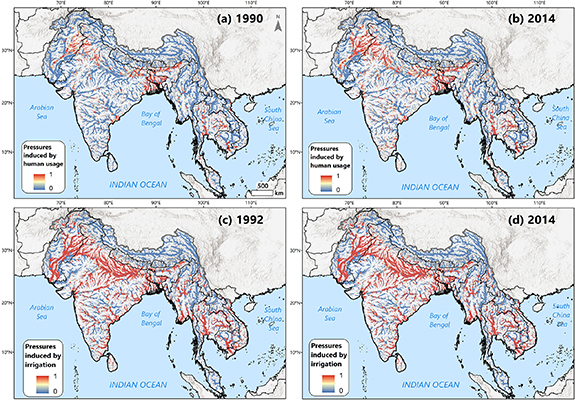
Figure A2. Anthropogenic pressures from each indicator. Subfigures (a) and (b) depict human usage (both industrial and domestic use), while subfigures (c) and (d) illustrate irrigation on river reaches in South and Southeast Asia from 1990–2014. Rivers with stream orders >2 are shown.
Download figure:
Standard image High-resolution imageA3.: Anthropogenic pressures on river reaches and proportion of healthy rivers in transboundary river basins
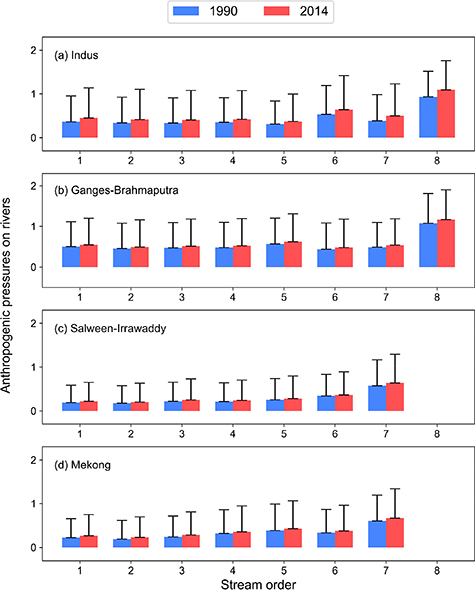
Figure A3. Variations in average anthropogenic pressures on river reaches in the (a) Indus, (b) Ganges-Brahmaputra, (c) Salween-Irrawaddy, and (d) Mekong river basins from 1990–2014. There are no rivers with stream order >7 in the Salween-Irrawaddy and Mekong river basins.
Download figure:
Standard image High-resolution image
Figure A4. Change in proportion of healthy river reaches in the (a) Indus (b) Ganges-Brahmaputra (c) Salween-Irrawaddy, and (d) Mekong river basins from 1990–2014. There are no rivers with stream order >7 in the Salween-Irrawaddy and Mekong river basins.
Download figure:
Standard image High-resolution imageA4.: Comparison of anthropogenic pressures on river reaches assuming all irrigation water derived from rivers
We compared anthropogenic pressures on river reaches calculated under the assumption that all irrigation water is derived from rivers with our previous results. In this new experiment, we estimated the adjusted anthropogenic pressures from irrigation on river reaches by setting λ = 1 in formula (1) of the manuscript.
The new results, which do not include groundwater, generally agree with our previous results in identifying hotspots and estimating variations in pressures between large and small rivers, dominant pressure indicators, and longitudinal pressure variations in transboundary river basins (figures A5–A9, table A1). There were, however, a few minor differences: the anthropogenic pressures on river reaches increased 25.0% (0.4 if groundwater is included, and 0.5 if not). Anthropogenic pressures on river reaches in India and Pakistan increased the most, likely because the regions heavily depend on groundwater for irrigation (Siebert et al 2013).

Figure A5. Anthropogenic pressures on river reaches not including groundwater in South and Southeast Asia from 1990–2014. Rivers with stream orders >2 are shown in the subfigures at left. All river reaches (stream orders 1–8) are shown in the four inset maps. The average anthropogenic pressure is 0.5 in 2014, representing an increase of 12.5% since 1990. Anthropogenic pressures on river reaches near the southern Himalayas remain low, while there are hotspots in eastern Pakistan, northern India, Bangladesh, southern Thailand, and southeast Vietnam.
Download figure:
Standard image High-resolution image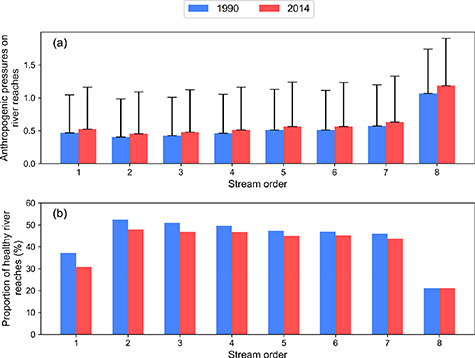
Figure A6. (a) Change over time in anthropogenic pressures on river reaches based on stream order. (b) Change over time in proportion of healthy river reaches based on stream order, assuming that river water is the only source for irrigation. High-order large rivers bear more anthropogenic pressures than low-order small rivers (0.7 vs 0.5), while low-order small rivers experience a more rapid increase in such pressures (12.9% vs 10.9%) from 1990–2014. The proportion of healthy low-order small river reaches also decreases faster than that of healthy high-order large river reaches (12.8% vs 4.6%).
Download figure:
Standard image High-resolution image
Figure A7. Dominant anthropogenic pressure on river reaches in 2014, assuming that river water is the only source for irrigation. Rivers with stream orders >2 are presented in the left subfigure. Insets (a)–(c) are shown in the right three subfigures, which include all river reaches (stream orders 1–8). Irrigation is the dominant pressure indicator impacting ∼41% of river reaches within the study area.
Download figure:
Standard image High-resolution image
Figure A8. Variations in anthropogenic pressures on river reaches in the four studied transboundary river basins from 1990–2014, assuming that river water is the only source for irrigation. Anthropogenic pressures in the Ganges-Brahmaputra river basin consistently remain the highest (∼0.6) of all four transboundary river basins. Compared to South Asia, anthropogenic pressures in Southeast Asia are relatively low (∼0.3).
Download figure:
Standard image High-resolution imageTable A1. Estimates of average anthropogenic pressures on rivers from 1990–2014, assuming that river water is the only source for irrigation.
| Stream order | River reaches | Average pressures (1990) | Average pressures (2014) | p-value (t-test) |
|---|---|---|---|---|
| 1 | 78 807 | 0.47 | 0.53 | <0.001 |
| 2 | 36 893 | 0.40 | 0.45 | <0.001 |
| 3 | 20 189 | 0.43 | 0.48 | <0.001 |
| 4 | 10 641 | 0.46 | 0.51 | <0.001 |
| 5 | 4744 | 0.51 | 0.56 | <0.001 |
| 6 | 2723 | 0.51 | 0.56 | 0.002 |
| 7 | 1290 | 0.57 | 0.63 | 0.017 |
| 8 | 156 | 1.07 | 1.18 | 0.142 |
A5.: Comparison of water scarcity analysis with our approach
Conventional water scarcity studies include both water demand and availability (Liu et al 2017, Veldkamp et al 2017). This differs from our approach, which separates the impact of anthropogenic pressures on river reaches.
To better compare our anthropogenic pressures with conventional water scarcity assessments, we conducted a new experiment to include water availability and to estimate water scarcity. Water scarcity is usually defined as water demand/water availability, with river discharge commonly used to approximate water availability (Oki and Kanae 2006). We defined water scarcity as the ratio of anthropogenic pressures in our results to river discharge, following previous studies (Vörösmarty et al 2000b, Oki and Kanae 2006, Liu et al 2017).
River discharge in South and Southeast Asia from 1990 to 2013 was initially obtained from the MERIT Basins dataset (Lin et al 2019) (data for 2014 was unavailable). We then reconstructed this river discharge dataset by incorporating the Climate Forecasting System Reanalysis dataset and global precipitation dataset (i.e. Multi-Source Weighted-Ensemble Precipitation) and forcing the hydrological model, which allowed us to analyze the impacts of climate change on water availability. We averaged daily river discharge of each river reach to obtain the mean annual reach-scale river discharge in 1990 and 2013 (figure A10).
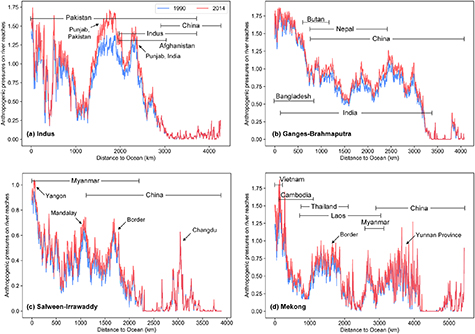
Figure A9. Longitudinal differences in anthropogenic pressures on river reaches in four transboundary river basins from 1990 (blue lines) to 2014 (red lines), assuming that river water is the only source for irrigation. Hotspots under intense anthropogenic pressures are labeled. Anthropogenic pressures vary longitudinally in transboundary river basins within the study area, increasing closer to the ocean.
Download figure:
Standard image High-resolution image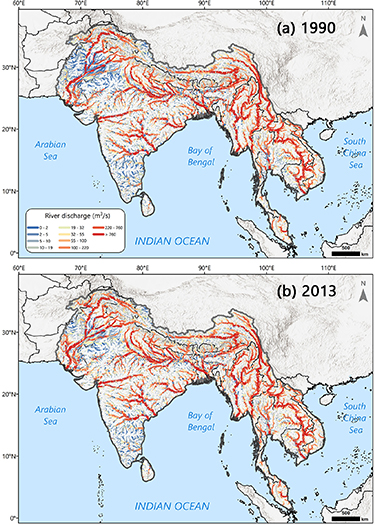
Figure A10. Reach-scale river discharge in (a) 1990 and (b) 2013 within the study area. Rivers with stream orders >2 are shown.
Download figure:
Standard image High-resolution imageThe new experimental results show that the spatial pattern of water scarcity is generally consistent with that of anthropogenic pressures. The average water scarcity in our study area increased 9.09% (from 0.33 to 0.36) from 1990–2014 (figure A11). This is because changes in river discharge impacted by climate change between 1990 and 2013 within the study area were limited. The average river discharge increased by 0.49% (141.79–142.49 m3 s−1), a minor change. Water scarcity is controlled by intense anthropogenic activities.

Figure A11. Water scarcity in South and Southeast Asia from 1990–2014. Rivers with stream orders >2 are shown.
Download figure:
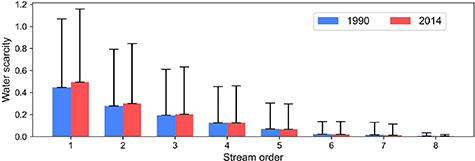
Standard image High-resolution imageResults from the water scarcity-based assessments differ from our examinations of anthropogenic pressures in two key ways. First, high-order large rivers demonstrate much lower water scarcity than low-order small rivers (0.01 vs 0.38, figure A12). They also experience higher total anthropogenic pressures than low-order small rivers. High-order large rivers have higher discharge than low-order small rivers, reducing their water scarcity. In contrast, small rivers have lower discharge and higher water scarcity (figure A10). Second, the temporal variations of water scarcity for different stream orders vary significantly from 1990 to 2014 due to fluctuations in discharge across rivers of varying sizes (table A2).
Figure A12. Changes over time to water scarcity on river reaches based on stream order.
Download figure:
Standard image High-resolution image
Table A2. Estimates of average water scarcity from 1990–2014.
| Stream order | Average water scarcity (1990) | Average water scarcity (2014) | p-value (t-test) |
|---|---|---|---|
| 1 | 0.445 | 0.495 | <0.001 |
| 2 | 0.278 | 0.301 | <0.001 |
| 3 | 0.193 | 0.201 | 0.056 |
| 4 | 0.126 | 0.125 | 0.862 |
| 5 | 0.070 | 0.066 | 0.448 |
| 6 | 0.022 | 0.020 | 0.643 |
| 7 | 0.017 | 0.013 | 0.392 |
| 8 | 0.006 | 0.003 | 0.356 |