

Abstract
Vegetation properties of arctic tundra vary dramatically across its full latitudinal extent, yet few studies have quantified tundra ecosystem properties across latitudinal gradients with field-based observations that can be related to remotely sensed proxies. Here we present data from field sampling of six locations along the Eurasia Arctic Transect in northwestern Siberia. We collected data on the aboveground vegetation biomass, the normalized difference vegetation index (NDVI), and the leaf area index (LAI) for both sandy and loamy soil types, and analyzed their spatial patterns. Aboveground biomass, NDVI, and LAI all increased with increasing summer warmth index (SWI—sum of monthly mean temperatures > 0 °C), although functions differed, as did sandy vs. loamy sites. Shrub biomass increased non-linearly with SWI, although shrub type biomass diverged with soil texture in the southernmost locations, with greater evergreen shrub biomass on sandy sites, and greater deciduous shrub biomass on loamy sites. Moss biomass peaked in the center of the gradient, whereas lichen biomass generally increased with SWI. Total aboveground biomass varied by two orders of magnitude, and shrubs increased from 0 g m−2 at the northernmost sites to >500 g m−2 at the forest-tundra ecotone. Current observations and estimates of increases in total aboveground and shrub biomass with climate warming in the Arctic fall short of what would represent a 'subzonal shift' based on our spatial data. Non-vascular (moss and lichen) biomass is a dominant component (>90% of the photosynthetic biomass) of the vegetation across the full extent of arctic tundra, and should continue to be recognized as crucial for Earth system modeling. This study is one of only a few that present data on tundra vegetation across the temperature extent of the biome, providing (a) key links to satellite-based vegetation indices, (b) baseline field-data for ecosystem change studies, and (c) context for the ongoing changes in arctic tundra vegetation.
Export citation and abstract BibTeX RIS

Original content from this work may be used under the terms of the Creative Commons Attribution 4.0 license. Any further distribution of this work must maintain attribution to the author(s) and the title of the work, journal citation and DOI.
1. Introduction
The variation in arctic tundra vegetation along geographical gradients has historically been observed and documented by numerous international scientists for the regions that compose the circumpolar Arctic (e.g. Alexandrova 1970, 1980, Young 1971, Yurtsev et al 1978, Tikhomirov et al 1981, Matveyeva 1994, 1998, Yurtsev 1994, Razzhivin 1999). Building on these assessments of broad spatial patterns in arctic vegetation, a methodology for examining the effects of climate variables on ecosystem properties is to utilize geographic transects (e.g. latitude) that exhibit spatial variability in one specific climatic variable, yet hold other environmental conditions relatively constant. Given that the south-north extent of the arctic tundra biome spans 15° latitude, a mean July temperature gradient of approximately 12 °C (Walker et al 2005, Epstein et al 2008, Raynolds et al 2012), and highly variable surficial deposits, glacial histories, permafrost conditions, soils, and vegetation (e.g. Tarnocai and Schweger 1991, CAVM Team 2003, Brown and Romanovsky 2008), the utility of geographic transects is readily apparent. Yet, while a great deal of research, covering a range of ecosystem variables, has been conducted along northern high-latitude transects (e.g. Hall 1999, Jia et al 2002, Mcguire et al 2002, Vedrova et al 2002, Yu et al 2002, Sazonova et al 2004, De Beurs and Henebry 2005), these mostly span boreal forests, and only a small fraction of the included terrain is arctic tundra.
Additionally, developing linkages between ground-based and satellite-based data for arctic vegetation is crucial for making regional and circumpolar assessments of key ecosystem variables, such as tundra productivity, carbon storage, surface albedo, and ground thermal insulation (Goetz et al 2011, Walker et al 2011a). Strong relationships have been developed between the satellite-derived normalized difference vegetation index (NDVI) and total aboveground arctic tundra biomass for both North American and Eurasian ecosystems (Walker et al 2011b, Raynolds et al 2012), however, few studies have linked satellite data to particular components of tundra vegetation biomass or cover (Fraser et al 2014, Frost et al 2014, Berner et al 2018).
From 2007 to 2010, a set of data were collected along the full arctic tundra temperature gradient in northwestern Siberia. Details of the Eurasian Arctic Transect (EAT) and the general site selection methods are more fully described in Walker et al (2019). Briefly, the EAT extends from some of the northernmost vegetated lands globally at the Krenkel meteorological station on Hayes Island, Franz Josef Land, Russia (80° 37ʹ N, 58° 03ʹ E) south along the Yamal Peninsula to the forest-tundra transition outside the city of Nadym, Russia (65° 19ʹ N, 72° 53ʹ E) in northwestern Siberia (Walker et al 2009a, 2012a, 2019). Mean July temperatures range from 1 °C at the northern end of the transect to 15.8 °C at the southern end. Study locations were identified in each of the five arctic tundra bioclimate subzones (A–E) sensu the Circumpolar Arctic Vegetation Map (CAVM; Walker et al 2005), in addition to the forest-tundra transition. Studies along the EAT included systematic and comprehensive sampling of plant communities, biomass, soil properties, active layer, and imaging spectroscopy, across two contrasting soil-texture landscapes (sandy and loamy) (Walker et al 2009a, 2012a, 2019). Patterns in plant community composition and structure along the EAT were described and analyzed in Walker et al (2019). The study herein focuses on vegetation-production properties along the EAT temperature gradient. The main objectives of this paper were to describe and quantify the effects of temperature and soil texture on tundra ecosystem properties along the full latitudinal (temperature) gradient of the Arctic tundra biome in northwestern Siberia. The ecosystem properties assessed were total aboveground biomass, biomass by plant growth form, and biomass by plant tissue type (e.g. wood, foliage). Additionally, we analyzed ground-level measurements of the leaf area index (LAI) and the NDVI. All dependent variables were evaluated within soil texture types (i.e. sandy and loamy) along the latitudinal gradient of the summer warmth index (SWI—sum of mean monthly temperatures >0 °C).
2. Methods
2.1. Sampling sites and design
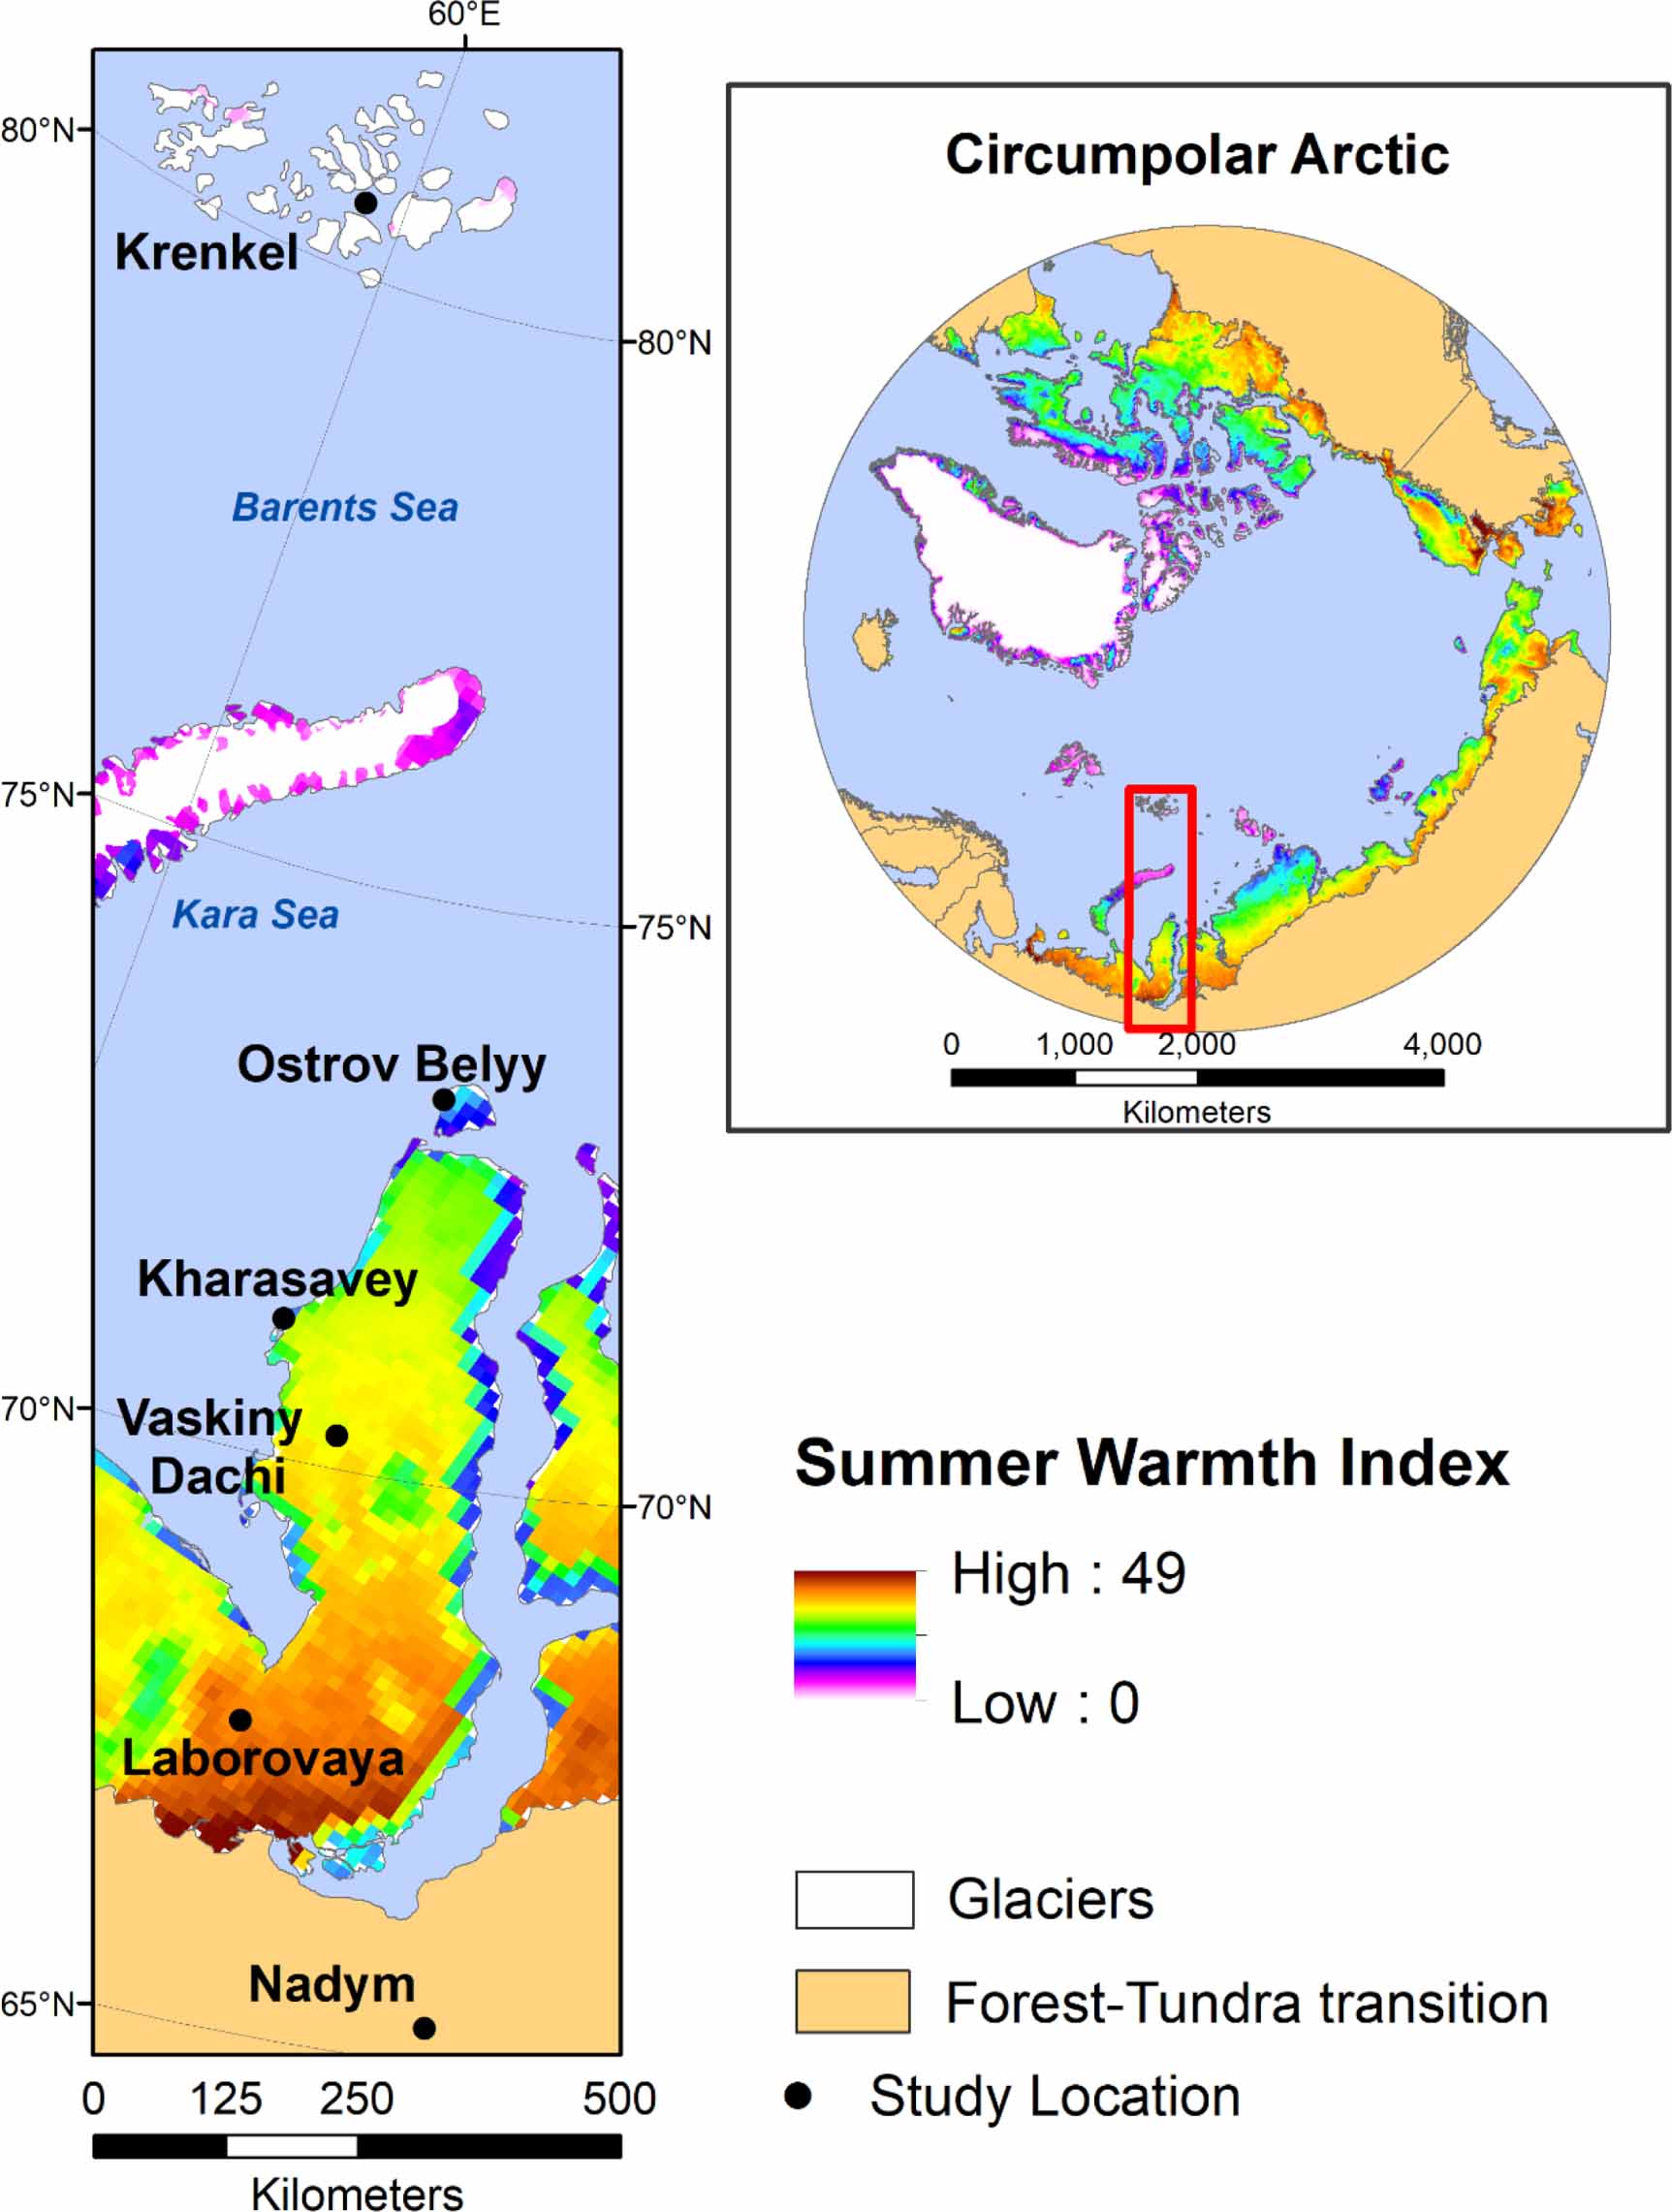
The six sampling locations along the EAT were Krenkel (Subzone A—Hayes Island, Franz Josef Land), Ostrov Belyy (Subzone B—island off the northern coast of the Yamal Peninsula), Kharasavey (Subzone C—mainland Yamal), Vaskiny Dachy (Subzone D—mainland Yamal), Laborovaya (Subzone E—mainland Yamal), and Nadym (forest-tundra transition, south of the Yamal Peninsula) (figure 1). Sampling sites were selected to represent zonal vegetation conditions (i.e. characteristic, relatively undisturbed vegetation at mesic landscape positions). Within zonal landscapes, the terrain of the Yamal Peninsula consists of marine and alluvial terraces of varying ages (e.g. Svendsen et al 2004). These different-aged terraces present an opportunity to examine the effects of soil texture (in addition to climate) on ecosystem properties, as the younger terraces have sandy soils, whereas the older terraces have more fine-grained loamy soils. A map analysis of landscape age and soil texture on the Yamal Peninsula (unpublished results) indicates that silt loam soils are strongly associated with older landscapes (>70 000 years), whereas sands are more associated with younger landscapes (<25 000 years). Many of the landscapes on the Yamal Peninsula fall within migration routes of the Nenets people and their herds of reindeer (Forbes et al 2009), therefore the continental (Yamal) vegetation analyzed here are from zonal sites under a moderate grazing regime.

Figure 1. The Eurasia Arctic Transect and circumpolar Arctic (inset) with summer warmth index (SWI—sum of mean monthly temperature > 0 °C) data (CAVM Team 2003).
Download figure:
Standard image High-resolution imageAt each of the six study locations along the transect, we established one sample site on a sandy substrate and one on a loamy substrate. At each of the sampling sites, we arranged a 50 m × 50 m grid. Along one direction within the grid, we placed five 50 m long transects, evenly spaced, separated by 12.5 m. Also, uniformly located throughout the grid, we established five 5 m × 5 m plots for more intense sampling of species composition, aboveground biomass, and community-level vegetation variables (figure 2). Additional grids and/or plots were established to capture other elements of landscape heterogeneity within our study locations. At the sandy site at Nadym, one additional 5 m × 5 m plot was established (for a total of six), with three plots each placed on the tops of hummocks (small mounds) and in hummock interspaces. At Vaskiny Dachi, an additional loamy-textured grid was established to distinguish between Terrace III and Terrace IV loamy soils. At Kharasavey, no additional plots were added, but the sandy grid plots were separated into Terrace I (two plots) and Terrace II (three plots). On Ostrov Belyy, additional sampling was conducted for both grids to distinguish samples on patterned ground features (non-sorted circles, small non-sorted polygons) and between patterned ground features (inter-circles, polygon cracks). Soil samples to 10 cm depth were taken from the center of each plot, and 1–2 soil pits were dug at each of our sites, to validate our soil texture distinctions; data can be found in several project data reports (Walker et al 2009b, 2009c, 2011c).
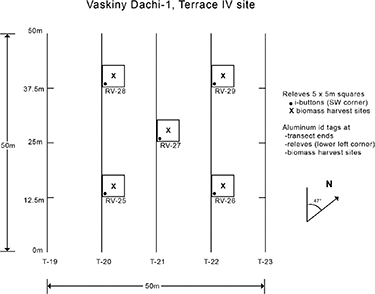
Figure 2. Sampling scheme: within 50 × 50 m grids of relatively homogenous zonal vegetation, we measured NDVI and LAI at 1 m intervals along five 50 m transects. Biomass harvests and additional NDVI and LAI data were collected at five 5 × 5 m plots distributed uniformly throughout the grid.
Download figure:
Standard image High-resolution image2.2. NDVI and LAI sampling
At 1 m intervals along each of the five transects (in each grid), we measured the NDVI and the LAI. NDVI was measured using an Analytical Spectral Devices (ASD) Photo-System (PS) II spectro-radiometer (ASD Inc., Boulder, Colorado, USA); the optic of the instrument was held at nadir 1 m above the ground surface, with a 25° field-of-view, yielding a 0.154 m2 circular footprint. White and dark calibrations were conducted after every ten measurements, or more frequently under varying ambient light conditions. NDVI was calculated as the difference between the near infra-red (NIR; 725–1068 nm) reflectance and the red reflectance (580–680 nm) divided by the sum of the two reflectance values. LAI was estimated using an LAI-2000 Plant Canopy Analyzer (LI-COR, Lincoln, Nebraska, USA). One above-canopy calibration reading was taken, followed by one below-canopy reading in each of the four cardinal directions ∼0.5 m from the grid-point; the four readings were averaged to obtain the estimate of LAI. Additionally, using the same protocols, five NDVI and LAI measurements were made in each of the 5 m × 5 m plots within each grid. It should be noted that at the Nadym forest site (loamy), NDVI was taken only of the understory vegetation, as we were not able to get the spectro-radiometer above the forest canopy; LAI measurements, on the other hand, include the overstory forest vegetation. All NDVI and LAI measurements were taken at the peak of the growing season (typically end of July or early August) between the hours of 10:00 and 14:00; there were no repeat measurements taken over time.
2.3. Aboveground biomass sampling
One 20 cm × 50 cm (0.1 m2) quadrat of vegetation and soil was removed intact from the center of each 5 m × 5 m plot. The samples were obtained using a metal frame to define the boundaries of the sample, and a serrated knife was used to extract the vegetation and soil from within the edges of the frame. The depth of the sample was adjusted to include all the live and dead moss, and about 5 cm of the uppermost mineral soil horizon. The samples were divided into two 20 cm × 25 cm pieces for temporary storage in one-gallon zippered plastic bags in a cool environment. The aboveground portions of the live and standing dead vegetation, in addition to the dead moss and litter, were harvested in field laboratories as soon as possible, and sorted according to plant growth forms (evergreen shrubs, deciduous shrubs, graminoids, forbs, bryophytes, lichens, algae) and all surface litter. Vascular plant growth forms were further sorted according to woody stems, foliage, standing dead, and reproductive parts (flowers, fruits, seeds). These sorted samples were air-dried in small paper bags, and later oven-dried and weighed. More complete biomass sampling and sorting procedures are available in project data reports (Walker et al 2008). Additionally, the biomass of biological soil crusts was estimated for the sampling sites at Krenkel (Subzone A) (Walker et al 2012b). The Nadym sandy-textured site was the only site with trees. Tree biomass was calculated by identifying each stem in the plot, measuring its diameter at breast height, estimating its height visually, and applying allometric equations (Zianis et al 2005, Muukkonen and Mäkipää 2006, Walker et al 2009b).
2.4. Climate data
The temperature variable used in our analyses is the SWI (SWI—sum of mean monthly temperatures > 0 °C, i.e. thawing-degree months, expressed as °C months). To obtain consistent SWI values across all study locations, we used data from the thermal infrared channels of the Advanced Very High Resolution Radiometers (AVHRR) aboard the U.S. National Oceanic and Atmospheric Administration (NOAA) weather satellites (Comiso 2003). SWIg (hereafter referred to simply as SWI) is the SWI based on the remotely sensed land surface temperature (LST), and was calculated for the 12.5 km pixels containing each of the study locations (mean from 1982 to 2003) (Bhatt et al 2010). Whereas SWI for the Yamal Peninsula increased by 6 °C months over the period 1982–2003, the mean SWI over that period was within 4 °C months of the mean from 2007 to 2009 (three of our sampling years). Yamal SWI was extremely low during one of our sampling years (2010—Krenkel sampling). Mean SWI increases from 2 °C months at Krenkel to 41 °C months at Nadym. Mean annual and mean growing season precipitation also increase from north to south (390–564 mm and 132–224 mm, respectively from Krenkel to Nadym). Because growing season precipitation and SWI are highly correlated along the latitudinal transect (r = 0.92), we simply used the SWI as the independent variable for the latitude-climate based analysis.
2.5. Statistical analyses
To identify relationships between SWI and our dependent variables (aboveground biomass components, NDVI, LAI), we averaged values of all dependent variables at the resolution of the 50 m × 50 m grid, and regressed these separately against SWI for the loamy- and sandy-textured sites. The data were also aggregated (averaged) at the resolution of the 5 m × 5 m plots to develop relationships among NDVI, LAI, and aboveground biomass components. The NDVI and LAI data were additionally analyzed at the grid-point resolution along the 50 m transects. Univariate regressions were conducted in R version 3.6.3 (lm, nls, ggplot) (R Core Team 2020), and adjusted r2 values and best-fit equations are presented.
3. Results
3.1. Vegetation Index (NDVI, LAI)—SWI relationships
NDVI increased as a power function of SWI for the loamy sites and as a parabolic function of SWI for the sandy sites (positive relationship for entire data range) (figure 3(a)). Over the range of our data, the loamy sites generally had greater NDVI values than the sandy sites for a given SWI (transect-wide means of 0.60 and 0.54, respectively). Minimum location-mean values along the full gradient were not less than 0.40, as our focus was on well-vegetated landscapes, even at the coldest, northernmost locations. LAI increased exponentially with SWI for both loamy and sandy sites; however, the increase with SWI was greater for loamy sites than sandy sites, leading to approximately twice the LAI at loamy sites compared to sandy sites at the warmer locations (figure 3(b)).

Figure 3. Relationship between (a) NDVI and (b) LAI and summer warmth index (SWI—°C months) for loamy (blue) and sandy (red) sites along the Eurasian Arctic Transect (EAT).
Download figure:
Standard image High-resolution image3.2. Aboveground biomass patterns and SWI relationships
Mean total live aboveground biomass for all tundra plots and the understory of the forest site at Nadym (excluding biological soil crusts) ranged from 15 g m−2 at the subzone A sandy site (KR-2) to 1229 g m−2 on the hummocks at the forest transition (FT)-tundra site (ND-2a) (figure 4). Trees occurred only at the Nadym forest site (ND-1); their biomass (5338 g m2), estimated from stem counts and allometric relationships, was approximately five times that of the forest understory (1079 g m−2). Evergreen shrub biomass was greatest (554 g m−2) on the hummocks at the FT-tundra site (ND-2a), dominated by Rhododendron tomentosum. Deciduous shrub biomass peaked at the subzone E loamy site (LA-1—286 g m−2) due to the high cover of Betula nana. In subzones B, C, and D, total shrub biomass was less than 115 g m−2, and there were no shrubs at the subzone A sites (KR-1, KR-2). Graminoid biomass peaked in the central part of the Yamal Peninsula (subzone C), ranging between 1 and 54 g m−2 along the full gradient. Forbs had low biomass in all subzones, but in subzone A forb biomass was 4–6 g m−2 and accounted for a much higher proportion of the total biomass (9%–27% excluding the biological soil crusts) than in other subzones. Lichen biomass was greater on the sandy sites compared to the loamy sites at all locations, except for Nadym. Lichen biomass contributed to 75% of the total understory biomass at the Nadym forest site (ND-1), >80% in the inter-hummock areas at ND-2a, and >50% at the subzone A sites (KR-1, KR-2), all sites where reindeer do not presently graze. Bryophyte biomass ranged from 2 g m−2 in subzone A at KR-2 to a high (possibly sand-contaminated) value of 555 g m−2 at a Kharasavey sandy site (KH-2b). Biological soil crust biomass (mix of lichens, small bryophytes, and algae) was exceptionally high at both subzone A sites (95 and 218 g m−2) (Walker et al 2012b).
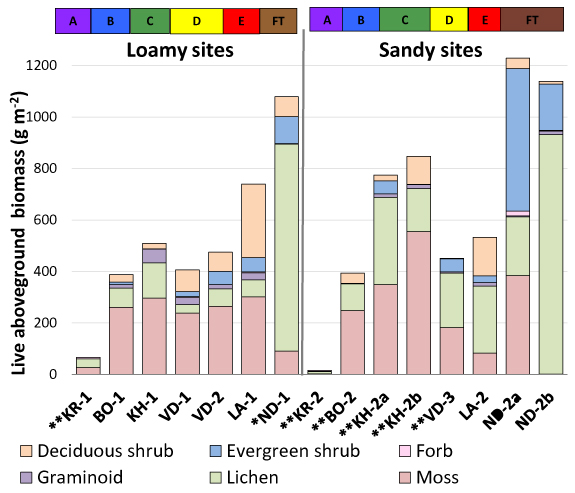
Figure 4. Total live aboveground biomass (g m−2) *excluding trees and **excluding biological soil crusts.
Download figure:
Standard image High-resolution imageTotal aboveground biomass increased as a power function with SWI for both loamy and sandy sites (figure 5), and overall values were generally similar between the different textured landscapes; however, the sandy sites had greater biomass variation around the transect-wide trend. Details regarding the biomass contributions of plant growth-form categories are illustrated in figure 6. Several patterns emerged. First, total shrub biomass increased as a power function, and nearly identically, for both loamy and sandy sites along the SWI gradient; however, differences emerged when this was split into deciduous and evergreen categories. Deciduous shrubs had greater biomass on loamy sites than sandy sites, whereas evergreen shrubs had greater biomass on the sandy sites than the loamy sites, particularly at the warmer locations. Deciduous dwarf shrubs (mainly Salix polaris and S. nummularia) are abundant further north (colder locations) than evergreen dwarf shrubs. No woody plants occurred at the subzone A sites.

Figure 5. Relationship between total live aboveground biomass (g m−2) and summer warmth index (SWI—°C months) for loamy (blue) and sandy (red) sites along the Eurasian Arctic Transect (EAT).
Download figure:
Standard image High-resolution image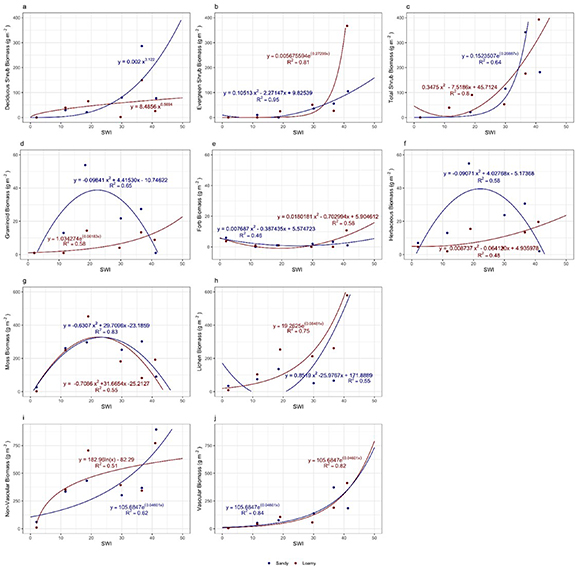
Figure 6. Relationship between aboveground biomass (g m−2) of (a) deciduous shrubs, (b) evergreen shrubs, (c) total shrubs, (d) graminoids, (e) forbs, (f) total herbaceous, (g) mosses, (h) lichens, (i) total non-vascular, and (j) total vascular vegetation and summer warmth index (SWI—°C months) for loamy (blue) and sandy (red) sites along the Eurasian Arctic Transect (EAT).
Download figure:
Standard image High-resolution imageSecond, graminoid biomass peaked in the center of the SWI gradient (subzone C), and was relatively low at the extremes of SWI for the loamy sites. In subzone A, the graminoid component consisted entirely of grasses and rushes; sedges were conspicuously absent. Graminoid biomass increased as a power function with SWI for the sandy sites. Forb biomass was a parabolic function along the SWI gradient, with its greatest values at the extremes of SWI, and the relationships were very similar between loamy and sandy sites. Forb cover was dominated by mat, cushion, and rosette growth-forms in subzone A. Since graminoids dominated the herbaceous biomass over forbs at most locations, total herbaceous biomass functions were relatively similar to those of graminoids.
Third, total nonvascular (bryophyte, lichen) biomass increased as a power function with SWI for both loamy and sandy sites; however, the patterns were different when split into moss and lichen growth-form categories. Lichen biomass generally increased with SWI (although the best fit for the loamy sites was a parabola), and was greater on the sandy sites than the loamy sites, except for the two most extreme SWI locations. Bryophyte biomass in contrast was greatest in the center of the gradient (subzone C), exhibiting parabolic functions that were very similar between loamy and sandy sites.
3.3. NDVI-LAI-biomass relationships
NDVI increases logarithmically with LAI. The LAI range in the dataset is from 0 to 1.85, whereas the NDVI range is from approximately 0.3–0.8, and NDVI begins to saturate quickly at LAI values of approximately >0.4 (figure 7). Not surprisingly, LAI is strongly related to both vascular biomass (figure 8(a)) and shrub biomass (figure 8(b)); note that the LAI measurement does not include non-vascular and other very short-statured vegetation, as the radiation sensor sits approximately 2 cm above the ground surface.
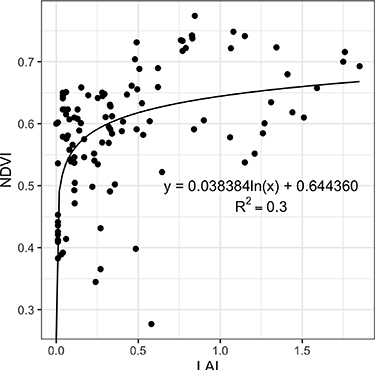
Figure 7. Relationship between NDVI and LAI at the plot scale (5 × 5 m) for all plots along the Eurasian Arctic Transect (EAT).
Download figure:
Standard image High-resolution image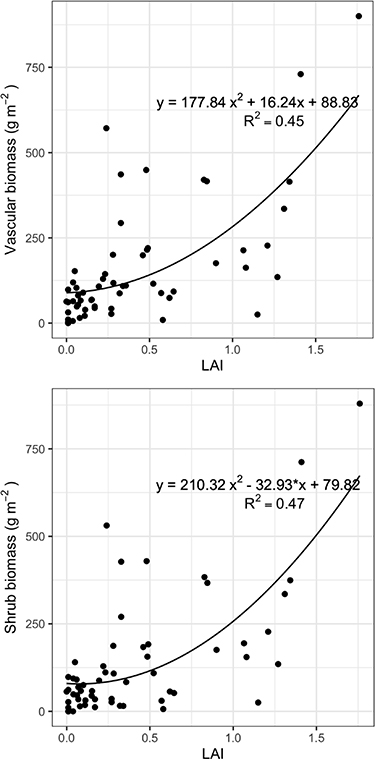
Figure 8. Relationship between (a) vascular (overstory) biomass and (b) shrub biomass (g m−2) and LAI at the plot scale (5 × 5 m) for all plots along the Eurasian Arctic Transect (EAT).
Download figure:
Standard image High-resolution imageUnlike the LAI estimates, NDVI includes the non-vascular vegetation, and relationships between NDVI and biomass variables are weaker than those for LAI. NDVI is related to total live biomass (figure 9(a)), but more strongly to shrub biomass (figure 9(b)), although the best fit is a negative parabola, where NDVI declines slightly at shrub biomass values approximately >550 g m−2 (not many data points at these values). Interestingly, at the plot scale, nonvascular biomass is strongly related to total photosynthetic biomass (figure 10(a)), and the slope of the relationship is 0.93, suggesting that nonvascular biomass accounts for >90% of the aboveground non-woody biomass. NDVI is only weakly related to photosynthetic biomass (figure 10(b)), implying that at least at the plot scale, the NDVI metric may not be capturing the variability in nonvascular biomass.

Figure 9. Relationship between (a) total biomass and (b) shrub biomass (g m−2) and NDVI at the plot scale (5 × 5 m) for all plots along the Eurasian Arctic Transect (EAT).
Download figure:
Standard image High-resolution image
Figure 10. Relationship between (a) non-vascular biomass and (b) NDVI and photosynthetic biomass (g m−2) at the plot scale (5 × 5 m) for all plots along the Eurasian Arctic Transect (EAT).
Download figure:
Standard image High-resolution image
4. Discussion
4.1. General biomass, NDVI, and LAI patterns
Total aboveground biomass increases with SWI across the EAT. Both loamy and sandy sites are represented by different power functions; however, the patterns in the data are quite similar, ranging from 16 and 57 g m−2 to 1079 and 1184 g m−2 (two orders of magnitude increase), respectively along an SWI gradient from 2 °C to 41 °C months. Driving this increase in aboveground biomass are predominately increases in nonvascular biomass and shrub biomass, both of which increase strongly with SWI. Shrub biomass increases from 0 g m−2 in subzone A to >340 g m−2 at the Nadym forest-tundra location. Nonvascular (bryophyte and lichen) biomass is relatively low in subzone A (<60 g m−2), increases to intermediate levels throughout Belyy Ostrov (subzone B) and mainland Yamal (subzones C–E) (essentially >300 g m−2 and <450 g m−2), and increases substantially at the Nadym location (>770 g m−2); the mean contribution of live nonvascular biomass to total live aboveground biomass is 77% (and 93% to live aboveground photosynthetic biomass) across the transect. The dead moss component is also substantial at the Yamal and Nadym locations, which adds to the thermal regulation capacity of the entire organic layer.
NDVI increases with SWI, but the range of values across the transect is rather narrow, essentially due to our methodology (focus on vegetated, zonal sites), leading to a relatively weak positive (logarithmic) relationship between total aboveground live biomass and NDVI. Strong positive relationships between satellite-derived NDVI and field-harvested aboveground biomass have been found for arctic tundra (e.g. Raynolds et al 2012, Berner et al 2018). However, in the case of our study, we used field-measured NDVI for well-vegetated, zonal sites; therefore, even our sites at the higher-latitude locations, with low biomass, had nearly continuous vegetation cover (e.g. lichens, bryophytes, and forbs), yielding moderate values of NDVI (>0.4) (Walker et al 2012b). If we were to randomly sample positions throughout our study landscapes (as opposed to finding well-vegetated sites), our field NDVI data would be more consistent with satellite-derived (coarser resolution) NDVI. Additionally, given the challenge of making accurate estimates, we did not include the biomass of crustose lichens in our analysis, which provide nearly continuous ground cover in our northernmost locations; this explains why total and photosynthetic biomass values of zero could still have substantial values for NDVI.
LAI increased from near 0 to 1.4 along the SWI gradient, however, it is important to note that the sensor for the LAI-2000 has a height of ∼2 cm; therefore, any vegetation below 2 cm (i.e. essentially all nonvascular vegetation) is not captured in the LAI measurement. Additionally, the sensors for the LAI-2000 do not actually distinguish leaves from any other live or dead vegetation (e.g. wood, standing dead), based on the radiative transfer algorithms used for the estimations. For these reasons, LAI is most strongly related to total shrub biomass and total vascular biomass in our dataset.
As mentioned above, nonvascular vegetation represents 77% of the total aboveground vegetation biomass and >90% of the photosynthetic biomass along the EAT, accentuating the importance of bryophytes and lichens for ecosystem properties and function across the arctic tundra. Turetsky et al (2012) reviewed the key role of mosses in the function of high latitude ecosystems, highlighting their numerous contributions. Representing a substantial proportion of aboveground net primary production (NPP) (Turetsky et al 2010), and particularly for those with slow decomposition rates (Hobbie et al 2000) mosses are a major factor in soil/peat carbon accumulation (Turetsky 2003, Frolking et al 2010). Additionally, mosses provide a thermal-insulation layer between the atmosphere and the ground, potentially protecting permafrost from warm summer air temperatures (Gornall et al 2007, Shur and Jorgenson 2007, Romanovsky et al 2008, Blok et al 2011, Frost et al 2018, Loranty et al 2018a). A recent study by Loranty et al (2018b) suggests that lichens may function quite differently than mosses, with greater rates of thermal diffusivity, leading to warmer summer soil temperatures, reduced organic layer thickness, and deeper thaw. The large fraction of tundra aboveground biomass composed of nonvascular vegetation, and the importance of these vegetation types for tundra ecosystem functioning, continue to make the case for a better understanding of the dynamics of these vegetation growth forms, and their specific inclusion in ecosystem models (Beringer et al 2001, Wullshcheger et al 2014). However, it is also clear that bryophytes and lichens are quite different in their physiology, function, and value to herbivores and likely should not be conjoined into a single, nonvascular category.
4.2. Patterns of aboveground biomass compared to percent cover
In general, patterns of aboveground biomass along the SWI gradient were similar to those of percent cover (see figure 13 in Walker et al 2019), as estimated using the Braun-Blanquet methodology (Westhoff and Van der Maarel 1978), but there were a few exceptions. Deciduous shrub biomass increased with increasing SWI on sandy sites, but increased to a lesser extent than total aboveground biomass. Therefore, the percent cover of deciduous shrubs on sandy sites decreased at the higher values of SWI (more southern locations)—the younger, sandy substrate at Nadym is well drained and forested, with no permafrost, and the understory is dominated by lichens and evergreen shrubs. Lichen biomass increased on the sandy sites as a power function along the SWI gradient, however, the percent cover of lichens on sandy sites had a clear positive parabolic relationship with SWI (Walker et al 2019), having relatively low values of cover in subzones B and C. High bryophyte biomass on the sandy sites in subzones B and C, along with reindeer grazing, likely contributed to the low percent cover of lichens at these sites.
4.3. Effects of soil texture
The biomass patterns of both bryophytes and forbs did not differ dramatically between loamy and sandy sites along the SWI gradient, but the biomass patterns of the other four plant growth forms (deciduous shrubs, evergreen shrubs, graminoids, and lichens) did differ between loamy and sandy sites. Deciduous and evergreen shrubs had similar biomass values between the two soil textures at the colder, northern sites, yet diverged in the more southern subzones, where deciduous shrubs and trees were dominant on loamy sites, and evergreen shrubs dominated the sandy sites. Interestingly, patterns of total aboveground shrub biomass were very consistent between loamy and sandy sites along the EAT, suggesting simply a divergence of biomass between deciduous and evergreen shrub species with SWI, yet no difference in total biomass. Similar contrasts in shrubs on soils differing in texture occur in other regions of the Arctic; on the north coastal plain of Alaska, for example, much of the central North Slope is covered by an aeolian sand sheet with prevalent evergreen shrubs (Macander et al 2017). Sandy textured soils compared to loamy soils on the EAT had lower soil pH (4.16 vs. 4.59 on average, respectively), and substantially lower soil nitrogen (0.08% vs. 0.28% N by mass) and cation exchange capacity (4.3 vs. 12.6 mEq 100 g−1) (Walker et al 2019). These indicators of lower nutrient availability, combined with decreased water availability and less cryoturbation, likely explain the dominance of evergreen shrubs on sandy sites (Macander et al 2017). Graminoids had greater biomass on the loamy sites than the sandy sites in the center of the SWI gradient, and this drove the relationship between total herbaceous biomass (graminoids and forbs) and SWI. Finally, lichen biomass was greater on sandy sites than loamy sites, except at the extreme ends of the SWI gradient.
4.4. Spatial patterns related to temporal trends
The dynamics of arctic tundra vegetation have been highly heterogeneous in both space and time over the past several decades (e.g. Bhatt et al 2013, 2017). However, much of the literature suggests a general 'greening' trend, most commonly assessed with a remotely-sensed index related to vegetation productivity, biomass, and cover (e.g. the NDVI) (Jia et al 2003, Goetz et al 2005, Bhatt et al 2010, Epstein et al 2012, Park et al 2016). Few of these studies estimated biomass increases explicitly, however, Epstein et al (2012), using a circumpolar NDVI-biomass relationship (Raynolds et al 2012), suggested that the range of aboveground tundra biomass increases (averaged by subzone) was 2.0 g m−2 (subzone A) to 96.1 g m−2 (subzone E), between 1982 and 2010. If we linearly extrapolate these values to the present (2020), the biomass increase range is 2.8 g m−2–134.1 g m−2. The average difference in total aboveground biomass between adjacent subzones along the EAT was 218 g m−2; therefore, the biomass changes estimated by Epstein et al (2012) do not yet approach what might be indicative of a shift in subzone, from a purely total biomass perspective.
One of the dominant components of tundra vegetation change has been shrub expansion (e.g. Fraser et al 2014, Frost and Epstein 2014, Frost et al 2014, Myers-Smith et al 2015, Naito and Cairns 2015, Martin et al 2017, Myers-Smith and Hik 2018, Weijers et al 2018). However, again, few if any studies explicitly quantified changes in tundra shrub biomass over time. Using data from 28 tundra sites in Alaska and Canada, Berner et al (2018) developed relationships between Landsat NDVI and aboveground shrub biomass that may then be used to infer shrub biomass dynamics with Landsat time series. Landsat data from four shrub-dominated landscape types on the coastal plain of the North Slope of Alaska indicated that NDVI on average increased from 0.490 to 0.514 (+0.024) from 1999 to 2014 (Lara et al 2018). Based on the equations from Berner et al (2018), this would be an increase in shrub biomass from approximately 93.5 g m−2–115.8 g m−2 (+22.3 g m−2). Nitze and Grosse (2016) found a slightly greater decadal scale increase in Landsat NDVI (+0.036) on the Lena River Delta, however, even this would only be a fraction of the shrub biomass increase that we observe spatially along the SWI gradient, particularly for the southern subzones, where shrub expansion has been most prominent. Alternatively, aboveground biomass of the deciduous shrub B. nana increased from 159 g m−2 to 267 g m−2 (+108 g m−2) at the Toolik Lake field site in the northern foothills of the Brooks Mountain Range, Alaska over a 6-year period (1983–1989) (on control plots of a greenhouse experiment) (Chapin et al 1995). This magnitude of biomass increase is much closer to what we observe spatially for adjacent southern tundra subzones.
5. Conclusion
To conclude, we quantitatively evaluated vegetation properties along a full latitudinal gradient of arctic tundra and the forest-tundra transition in northwestern Siberia (EAT). Many aspects of the EAT, such as the prevalence of evergreen and deciduous shrubs, the importance of nonvascular vegetation, and the contrasts between soils of different textures, are common throughout other regions of the Arctic. The Yamal Peninsula, however, is an area with substantial gas development facilities, and the presence of extensive reindeer herding by the Nenets people, which may differentiate it from other Arctic regions. Additionally, the climate of the EAT is relatively maritime, due to the absence of persistent summer sea-ice, in contrast to the more continental climate of a similar transect in North America (northern Alaska and the western Canadian Archipelago). It is also important to note that our data come from targeted sites that represent the zonal vegetation on both loamy and sandy substrates, yet we recognize the high degree of spatial heterogeneity (even at very fine spatial scales) found in Arctic ecosystems. Regardless, the EAT represents one of essentially only two large-scale efforts to comprehensively quantify the full latitudinal patterns of Arctic ecosystems. The data presented here can be highly useful for assessing the state, and modeling the dynamics, of Arctic ecosystems in response to a changing climate.
Acknowledgment
Funding was from the U.S. National Aeronautics and Space Administration, Land-Cover Land-Use Change Program (NASA LCLUC grants NNG6GE00A, NNX09AK56J, and NNX14AD90G). We especially thank Marina Leibman, who led the Russian investigations and organized the logistics for the field expeditions. She and numerous other members of the Earth Cryosphere Institute made this study possible. Elise Heffernan made the figures in R.
Data availability statement
The data that support the findings of this study are available upon reasonable request from the authors.