

Abstract
Residential development and urbanization have increased nutrient loads to streams and groundwater through increased use of fertilizers and discharge of wastewater effluent. Stream degradation in urbanizing areas has simultaneously reduced natural attenuation of nutrients. In this context, cemeteries are an often-overlooked land use that may contribute to nutrient loading in urbanizing watersheds. Although cemeteries provide ecosystem services, such as infiltration of stormwater, micrometeorology control, and greenspace, they also pose a unique threat to groundwater quality due to degradation and leaching of organic material. To assess the potential legacy impact of cemeteries on water quality, we explored the impact of a large cemetery that comprises 9% of the total area of a suburban watershed on groundwater nitrate concentrations and stream nitrate loads. We found nitrate concentrations were significantly higher in cemetery groundwater (median = 6.2 mg l−1) than in residential groundwater (median = 0.05 mg l−1). During summer months (June through September), the stream is consistently a gaining stream receiving groundwater discharge. During this time, stream nitrate concentrations increase by 1.4–1.9 mg l−1 between the upstream edge of the cemetery and the downstream edge (from 0.03–0.46 mg l−1 to 1.6 mg l−1–2.1 mg l−1, respectively). Stream nitrate loads observed at gauging stations located about 500 m upstream and downstream of the cemetery property show that the stream nitrate load is consistently 20–40 kg NO3−/day higher downstream of the cemetery between June to September. Given that the cemetery handles about 350–500 burials per year, it is estimated that 25%–50% of the nitrate load between the gauging stations could be attributable to groundwater discharge of burial decay products. Our observations of nitrate concentrations in cemetery groundwater, coupled with the increases in nitrate loads in a stream traversing the cemetery property, suggest cemeteries may be an overlooked source of nutrient loading in developed watersheds.
Export citation and abstract BibTeX RIS

Original content from this work may be used under the terms of the Creative Commons Attribution 4.0 license. Any further distribution of this work must maintain attribution to the author(s) and the title of the work, journal citation and DOI.
1. Introduction
Decades of residential development, land use change, and urbanization has resulted in increased nutrient loading to streams and groundwater, which has impacted stream water quality and ecosystem function (Groffman et al 2004). Elevated nutrient loads in urban and suburban watersheds have largely been attributed to increased nutrient inputs from atmospheric deposition, wastewater, and fertilizer application, coupled with declines in nutrient uptake due to degradation of riparian zones and streams (Law et al 2004, Kaushal et al 2008, Divers et al 2014). One under-explored source of nutrient loading in developed areas is the legacy effects of cemeteries on water quality (Ucisik and Rushbrook 1998, Brennan et al 2018). The lack of focused research on cemeteries is surprising given that cemeteries can comprise a significant land use in urban areas and have potential to cause accumulation of nutrients and contaminant legacies in groundwater that can degrade receiving water quality over decadal time scales, or longer. Prior studies may have shied away from investigating the impact of cemeteries given sensitivity to their traditional, spiritual and religious significance.
Cemeteries are often-overlooked urban green spaces that provide similar benefits to urban parks (Quinton and Duinker 2019) and important ecosystem services similar to urban vacant lots (Kim et al 2015), such as stormwater infiltration (Kelleher et al 2020), that are often overlooked. Cemeteries intercept and infiltrate stormwater due to minimal impervious surface cover; increase biodiversity and habitat, depending on management intensity, age and fragmentation of the landscape (Kowarik et al 2016); exert micrometeorology control due to vegetation shading, increased evapotranspiration, and greater soil moisture; and potentially attenuate contaminants by promoting infiltration rather than direct runoff in urban areas (Quinton and Duinker 2019). Although cemeteries provide a type of urban greenspace, cemeteries also have potential for ecosystem disservices unique from parks—namely, the potential impacts of decay products on groundwater quality and urban stream loads (Brennan et al 2018).
There are many potential contaminants introduced by cemeteries, which have been described as a 'special landfill' (Dent and Knight 1998, Fiedler et al 2012). Potential contaminants introduced by cemeteries include heavy metals (Fiedler et al 2012), unique products of the embalming and burial process such as formaldehyde (Chan, 1992, Oliveira et al 2012), pharmaceuticals (Fiedler et al 2018), and bacteria and viruses (Ucisik and Rushbrook 1998, Żychowski and Bryndal 2015). Of particular interest in this study is the introduction of nutrients, which are the inherent byproducts of decay and leaching of organic material. Although there is limited data and consistency between studies, nitrogen (and specifically nitrate) is identified in most prior studies as a groundwater contaminant introduced through decomposition and leaching of buried remains (Ucisik and Rushbrook 1998, Żychowski 2012). Direct observations of groundwater nitrate concentrations in or near burial sites show they are elevated by 1.1–7.1 times the concentrations observed at control sites, with groundwater concentrations at burial sites as high as 180.1 mg l−1 NO3 − (Żychowski 2012). Although prior studies have reported and synthesized groundwater nitrate concentrations from cemeteries and other burial sites, we found no prior study of the impacts of groundwater discharge from cemeteries to streams.
The objective of this research is to explore the potential for cemeteries to impact nitrogen loads to headwater streams in developed watersheds. We address this objective through a case study of an urban stream which flows through a large cemetery that comprises a significant portion of the total watershed land use. We examine differences in groundwater quality between the cemetery and residential areas and the resultant impacts on longitudinal stream chemistry profiles. We also use a nitrogen mass balance for the cemetery stream reach to investigate the potential contributions of nitrogen from the cemetery to the overall stream load.
2. Site description
Meadowbrook is a headwater stream located just outside the city of Syracuse in Central New York (figure 1). The Meadowbrook watershed is an 11.3 km2 urban and suburban area, with primarily residential land use (62%). The remaining land use in the watershed is nearly equally divided between university, school and religious properties (10%), vacant land parcels (9%), and cemeteries (9%). The aerial extent of cemeteries is dominated by one large cemetery (St. Mary's Cemetery), which covers an area of 0.85 km2. St. Mary's Cemetery stands out as the largest land parcel with singular land use within the Meadowbrook watershed. Its extent exceeds other large land parcels, such as golf courses (shown as commercial land use in figure 1(a)), public parks, and athletic fields associated with schools and Syracuse University. Approximately 500 m of Meadowbrook runs through the cemetery (figure 1(b)). Burial sites in one section of the cemetery, Section 100, can be found within 20–40 m of the stream channel and land surface gradients in the near stream area are approximately 10%–15% (figure 1(c)). Frequent flood events in this section are caused by delivery of storm water from upstream, which can cause stream stage to rise by 1–1.5 m within minutes. Areas of Section 100 have a history of flooding during storm events (Operations Manager, St. Mary's Cemetery, personal communication). As of 2012, more than half the cemetery area was still open for burial and the cemetery, which opened around 1900, handles 350–500 burials a year (Doran 2012; Operations Manager, St. Mary's Cemetery, personal communication). St. Mary's is a religious cemetery and therefore not regulated by New York State (Department of State 2020), although concrete vaults are requirement for burials within the past approximately 50 years. The cemetery grounds are not fertilized, regularly treated with pesticides, nor irrigated and lawn clippings are not collected during mowing (Operations Manager, St. Mary's Cemetery, personal communication).
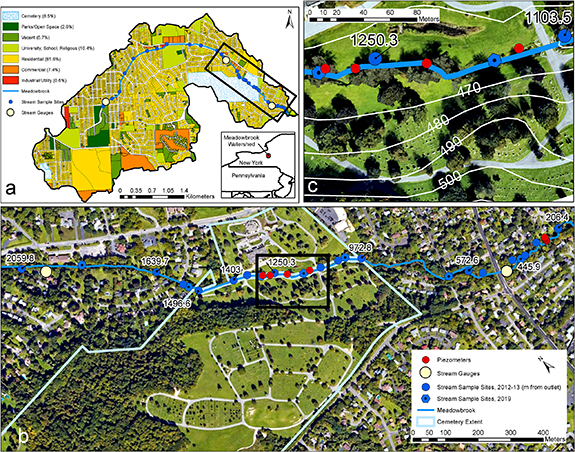
Figure 1. Site maps of (a) the location and extent of the Meadowbrook watershed, showing land use by tax parcel, (b) the reach of Meadowbrook that runs through St. Mary's Cemetery, and (c) a close-up view of Section 100, the proximity of burial sites to Meadowbrook and the land surface topography immediately adjacent to the creek. Stream sample sites are labeled with their distance from the outlet of Meadowbrook, in meters, which corresponds to the distances on the x-axis in figure 4. Tax parcel data was provided by Onondaga County, New York. Imagery is from Google, ©2020 CNES/Airbus, Maxar Technologies, New York GIS, USDA Farm Service Agency.
Download figure:
Standard image High-resolution imageAll properties in the Meadowbrook watershed are served by dedicated, separate sanitary and storm sewers (Ledford and Lautz 2015), as well as centralized wastewater treatment facilities outside of the watershed boundaries. As a result, wastewater sources to Meadowbrook are limited to those introduced by leaky infrastructure, rather than by discharge of wastewater effluent from septic systems or direct discharge of wastewater due to combined sewer overflow events. Prior analysis of the isotopic composition of nitrate in stream water upstream of the cemetery suggest wastewater as a primary source (Ledford et al 2017).
Prior research within the watershed has shown the importance of legacy contamination due to decades of winter road deicing (Ledford et al 2016, Slosson et al 2020). Prior work has also shown large spatial and seasonal variability of stream nitrate concentrations attributed to a combination of in-stream cycling of organic material (e.g. primary productivity, algae growth and decomposition), variable connection to groundwater longitudinally along the stream, and introduction of nutrients from leaking infrastructure and fertilizers (Ledford et al 2017, Beltran 2020a).
3. Methods
3.1. Stream and groundwater sampling and geochemical analysis
We used two strategies to characterize the spatial and temporal changes in surface water geochemistry along Meadowbrook—longitudinal sampling to capture spatial patterns and continuous sampling at gauging sites (see section 3.2) to capture temporal patterns. For longitudinal sampling, we sampled stream water from locations positioned every ∼200 m along the channel approximately every 2–3 weeks from May 2012 until June 2013 (figure 1). In September 2019, we conducted one similar synoptic survey at ten locations positioned every ∼200 m along the stream in the vicinity of the cemetery and downstream (figure 1(b)). For continuous stream sampling through time, we collected grab samples at each gauging station approximately weekly, and more often during storm events, from March 2017 through November 2019.
Groundwater samples were collected from two locations within the watershed—in a riparian floodplain downgradient from a residential neighborhood and in the near-stream zone downgradient from the St. Mary's Cemetery (figure 1(b)). In 2012, we installed five riparian piezometers in a transect extending 12 m from the creek in a floodplain immediately downgradient from a residential neighborhood. Piezometers were screened over a 30.5 cm interval at depths of approximately 1 m below the land surface. We sampled these piezometers on the same dates as longitudinal stream surveys between May 2012 and June 2013. In 2019, we installed four mini-piezometers along the stream's wetted edge, at the groundwater seepage face, immediately downgradient from the cemetery (figure 1(b)). Mini-piezometers were screened over a 10 cm interval at depths of approximately 0.5 m. We sampled these mini-piezometers on the same date as the longitudinal survey in September 2019.
All stream and groundwater samples were collected in high-density polyethylene bottles, filtered using a 0.45 or 0.7 µm filter, and stored at 4 °C until analysis. Ion concentrations were measured using a Dionex ICS-2000 Ion Chromatograph. Statistical comparisons of water chemistry between different sites and time periods were done using one-way analysis of variance (anova1) in MATLAB.
3.2. Stream discharge gauging and continuous monitoring
We installed three stream gauges along Meadowbrook in 2017 to continuously record stream stage, conductivity and temperature at 15 min intervals (figure 1(a)). Two of these gauges are positioned approximately 500 m upstream and downstream of the cemetery property boundaries (figure 1(b)).
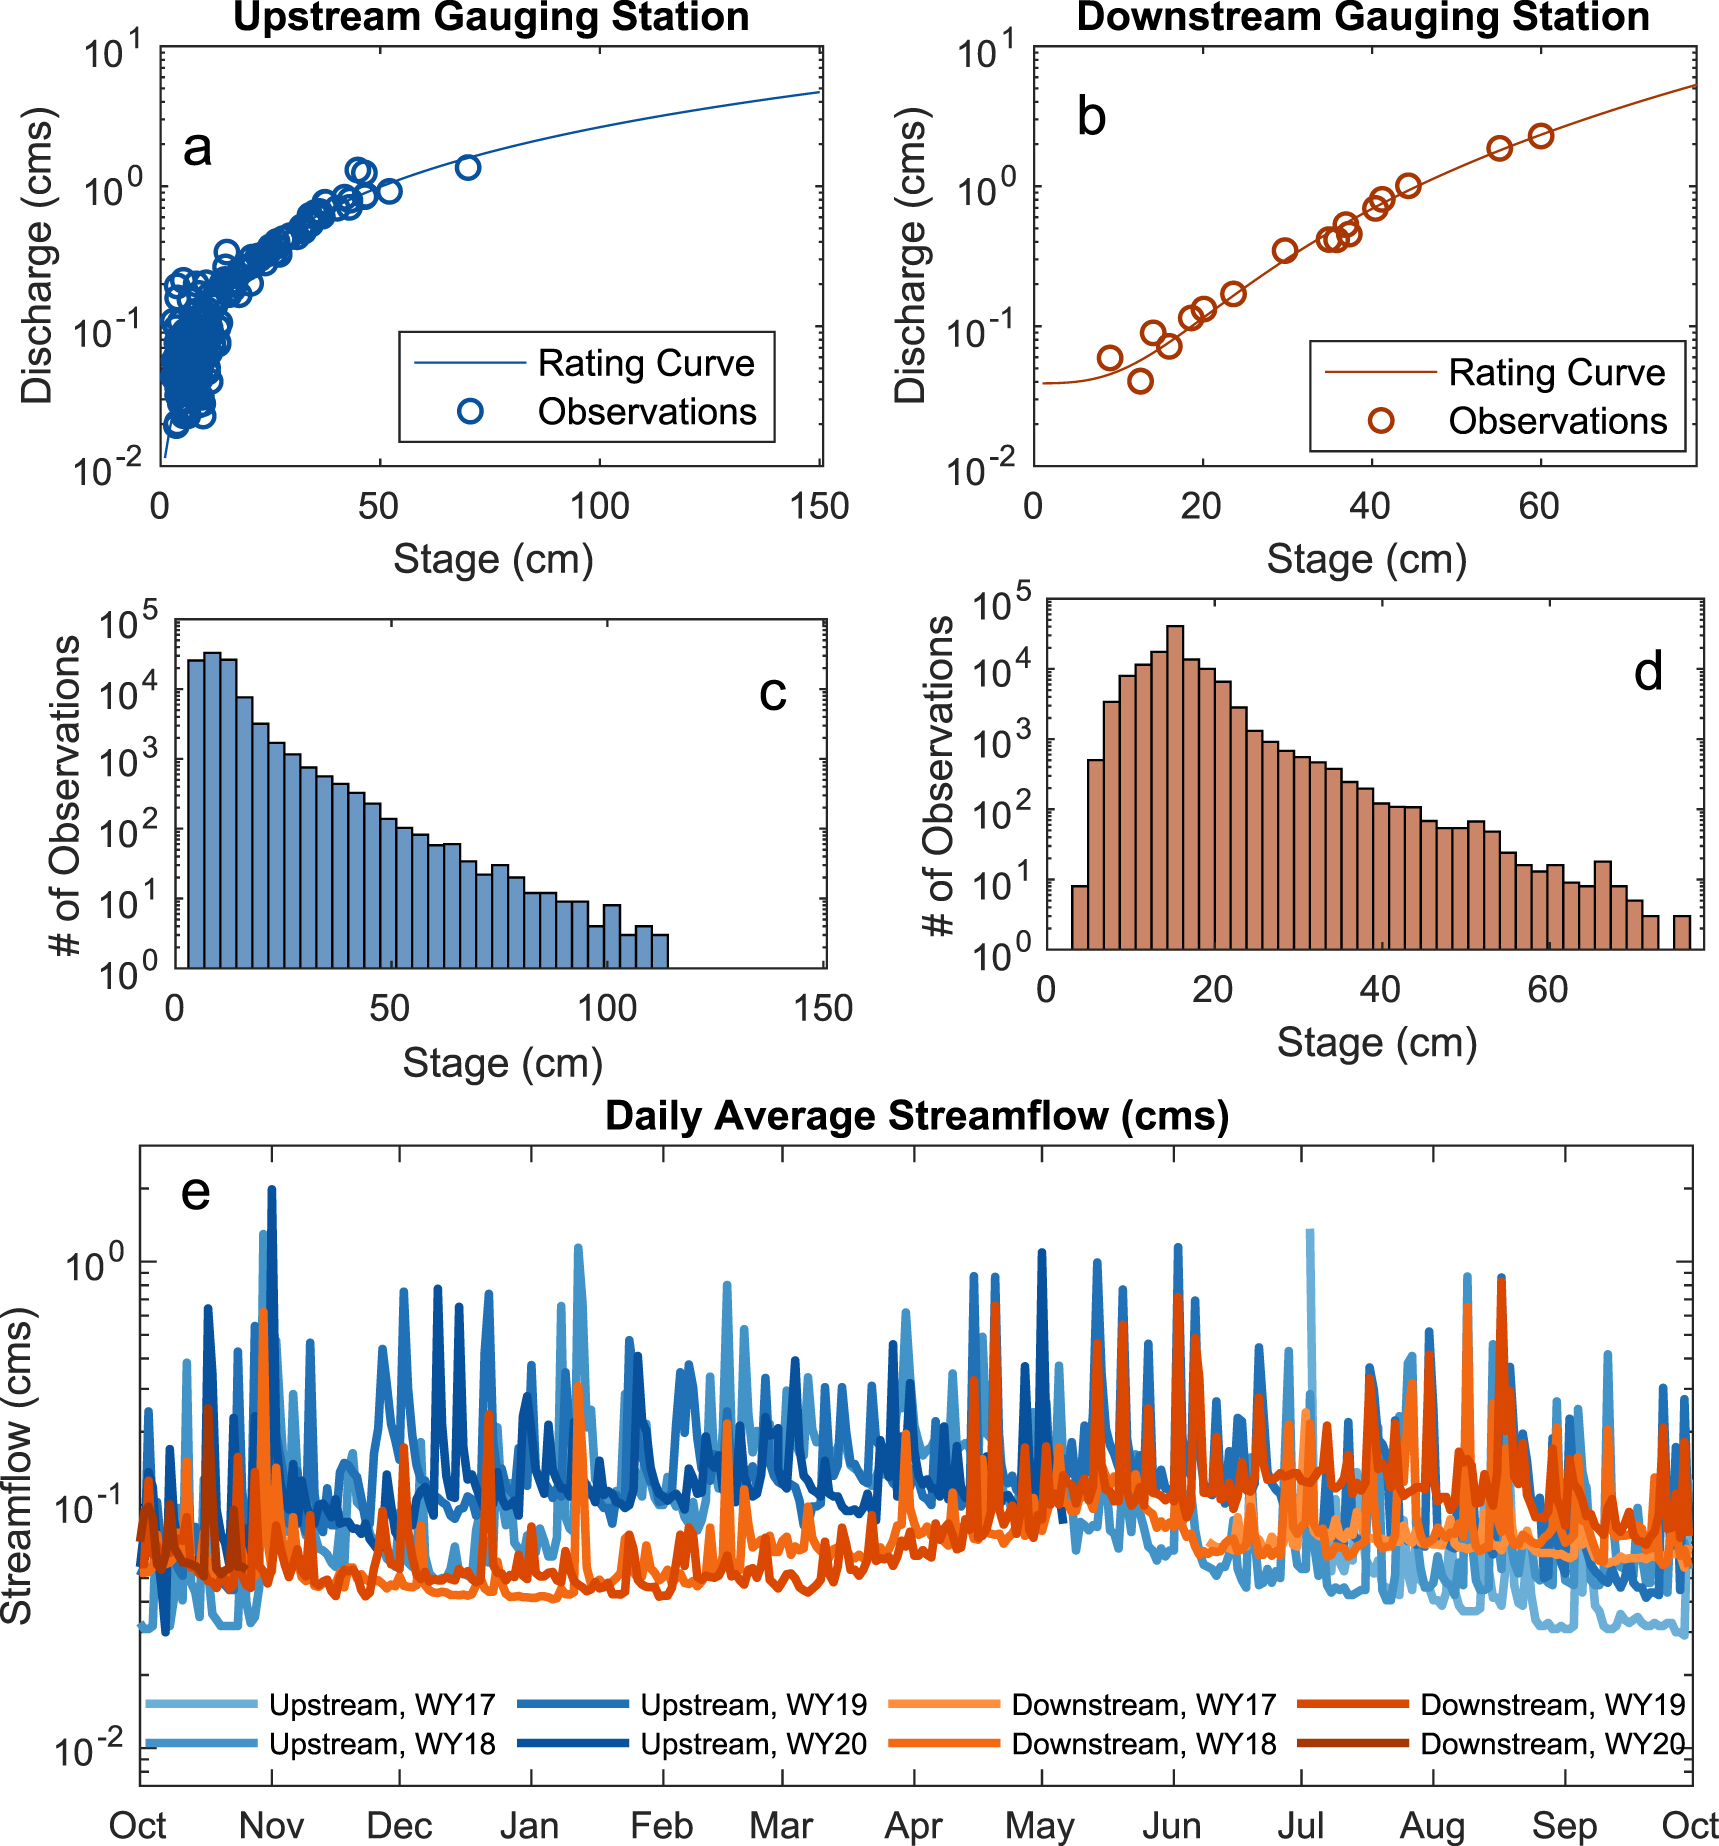
We developed rating curves for the two stream gauging stations by pairing direct observations of stream discharge using an acoustic doppler velocimeter and an acoustic doppler profiler (ADP) to observations of stream stage (figures 2(a) and (b)). The ADP is installed within the channel and collects stream discharge measurements every hour using automated methods. The ADP is therefore capable of capturing stream discharge rates during very high flow events in which the stream channel is not wadable. The result is that the observations used to generate the rating curves for the two gauging stations span nearly the full range of stage observations observed at each gauge (figure 2). This provides high confidence in stream discharge estimated from stage measurements across the full range of flow rates reported.

Figure 2. (a), (b) Rating curves and observations used to generate the curves for the upstream and downstream gauging stations. (c), (d) Histograms show that direct observations of streamflow used to generate the rating curves span the range of stream stage observations recorded for the full duration of stream gauging. (e) Continuous measurements of stream stage, combined with the rating curves, show the reach between the gauging stations consistently loses water during the winter months (November through April) and gains water during the summer months (May through October).
Download figure:
Standard image High-resolution image3.3. Stream nitrate load modeling
We used the combination of continuous stream discharge measurements (volume/time) and weekly solute concentrations (mass/volume) to compute nitrate loads (mass/time) at the two gauging stations bounding the cemetery reach. We used rloadest (https://github.com/USGS-R/rloadest), which is a set of R functions to implement the USGS LOADEST model (Runkel et al 2004). We fit a linear regression model of stream nitrate loads to direct observations of loads at the times of grab sampling for water years 2018 and 2019 (e.g. 1 October 2017 through 30 September 2019). In the model, the linear relationship between the natural logarithm of discharge and the natural logarithm of observed loads is leveraged to construct a linear regression model that can be applied to continuous discharge observations to estimate nitrate loads at 15 min intervals. We then used the differences between nitrate loads at the upstream and downstream gauging stations to quantify the nitrate load delivered to Meadowbrook along the reach in which the cemetery is located.
4. Results and discussion
4.1. Groundwater geochemistry in cemetery versus residential areas
The groundwater geochemistry at the seepage face of Meadowbrook, immediately downgradient of the cemetery ('cemetery groundwater'), is distinct from groundwater geochemistry in the riparian floodplain immediately downgradient from a residential area ('residential groundwater'; figure 3). The differences we observed between cemetery and residential groundwater are consistent with prior studies of the impacts of burial on groundwater chemistry (Żychowski 2012) and with the expected decay products from buried remains.
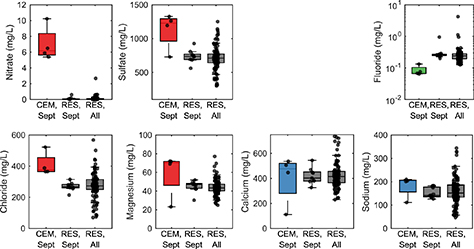
Figure 3. Observations of groundwater chemistry downgradient of the cemetery (CEM) and a residential area (RES). Cemetery observations are for September 2019. Residential area observations are shown for both September 2012 and for all observations between June 2012 and May 2013. Cemetery box plots are colored to reflect if mean values for cemetery groundwater are significantly higher (red), not significantly different (blue) or significantly lower (green) than mean values in residential areas. Differences are significant if results of one-way ANOVA return p < 0.05. Note that fluoride concentrations were log-transformed prior to ANOVA given their skewed distribution.
Download figure:
Standard image High-resolution imageWe observed significantly elevated concentrations of nitrate (p < 0.001) in cemetery groundwater (median = 6.2 mg l−1 NO3 −) relative to residential groundwater in the month of September (median = 0.05 mg l−1 NO3 −; figure 3). We sampled cemetery groundwater in September only, but nitrate concentrations in residential groundwater in September were consistent with year-round observations (median = 0.04 mg l−1 NO3 −), indicating groundwater nitrate concentrations do not vary seasonally in the residential area. We therefore assume cemetery groundwater similarly does not vary seasonally. Nitrogen compounds are a logical byproduct of degradation of buried remains, given that nitrogen is second only to water and carbon in the composition of the human body (Ucisik and Rushbrook 1998). Others have similarly observed elevated nitrate concentrations in groundwater sampled from monitoring wells and piezometers in cemeteries, with concentrations ranging from below detection limit to as high as 180 mg l−1 NO3 − (Chan et al 1992, Dent and Knight 1998, Żychowski 2012, Brenner et al, 2018). For context, our observations of cemetery groundwater nitrate concentrations are comparable to mean concentrations of nitrate in groundwater samples from golf courses (4.8 mg l−1 NO3 −; Bock and Easton 2020).
We observed sulfate, chloride and magnesium concentrations were significantly elevated in cemetery groundwater relative to residential groundwater, although these differences were not as highly significant in the case of chloride (p = 0.03) and the year-round range of these concentrations in residential groundwater overlaps the range observed in the cemetery (figure 3). Others have observed elevated concentrations of chloride and sulfate in cemetery groundwater relative to control sites (Van Haaren 1951, Trick et al 2001, 2005, Żychowski 2012), although not all prior studies show this consistently for these solutes (Dent and Knight 1998). Groundwater in the study area is strongly influenced by gypsum dissolution, which provides a natural source of high sulfate concentrations (Ledford and Lautz 2015). Additionally, seasonal use of road salt for deicing is a significant source of chloride in groundwater in the Meadowbrook watershed (Ledford and Lautz, 2016, 2020). As a result, it is difficult to discern the potential impact of the cemetery on sulfate and chloride concentrations in groundwater, relative to these other factors. Other major ions (calcium, sodium) do not show significant differences between the cemetery and residential groundwater.
Interestingly, we observed lower concentrations of fluoride in cemetery groundwater (median = 0.07 mg l−1), relative to the residential groundwater (median = 0.24 mg l−1). Prior research in Meadowbrook has found that fluoride concentrations increase longitudinally in the stream upstream of the cemetery, where sources of streamflow are dominated by road runoff and leaking infrastructure, rather than groundwater (Ledford et al 2017). It may be that leaking infrastructure in residential areas results in slightly elevated fluoride concentrations in groundwater. The cemetery does not have the density of water and sewage pipes as found in residential neighborhoods, which may explain the lower relative fluoride concentrations.
4.2. Seasonal patterns in stream-groundwater interaction
To understand the potential impact of differences in cemetery and residential groundwater on Meadowbrook stream water quality requires understanding spatial and temporal patterns of groundwater discharge to Meadowbrook. We attributed changes in streamflow between the gauging stations located about 500 m upstream of the cemetery and about 500 m downstream of the cemetery (figure 1(b)) to discharge or recharge of groundwater along the reach between the stations. This simplifying assumption is not valid outside of periods of baseflow, but storm events on Meadowbrook generate flood hydrographs that typically last only hours in duration, given the degree of urbanization in the watershed. As a result, baseflow is the predominate source of water for daily average streamflow rates on most days.
Results of continuous stream gauging upstream and downstream of the cemetery reveal seasonal differences in stream-groundwater interactions along Meadowbrook. In winter (November through April), streamflow rates at the upstream gauge are consistently higher than at the downstream gauge, indicating that the stream is losing water during these months (figure 3(e)). In summer (May through October), streamflow rates at the upstream gauge are consistently lower than at the downstream gauge, indicating the stream is gaining water during these months. We attribute the predominant source and sink for gains and losses of stream water to groundwater.
Given that consistent groundwater discharge in the cemetery reach is limited to the summer months, we focus further analysis of impacts of cemetery groundwater on stream water quality to this time of year. We examine longitudinal changes in solute concentrations and nitrate loads for June, July, August and September (JJAS), thereby excluding periods where the stream is losing to groundwater, as well as the shoulder months where stream-groundwater interactions are variable.
4.3. Impacts of cemetery groundwater discharge on stream water chemistry
Discharge of groundwater with a distinct geochemistry from the cemetery results in longitudinal changes in stream water chemistry along Meadowbrook as it flows through this reach during the summer, when the stream is gaining (figure 4). Notably, nitrate concentrations increase by 1.4–1.9 mg l−1 within the cemetery and continue to increase for approximately another 500 m downstream. The continuous increase in nitrate concentrations downstream of the cemetery may reflect the mixing length for stream water and discharging groundwater, the impact of the cemetery on groundwater outside of the property extent, and/or other sources of nitrate within the reach. We did not observe consistent and monotonic increases in nitrate concentrations longitudinally in the residential area (figure 4). Longitudinal patterns in other solute concentrations are consistent with the observed differences (or lack thereof) between cemetery and residential groundwater (figure 4).
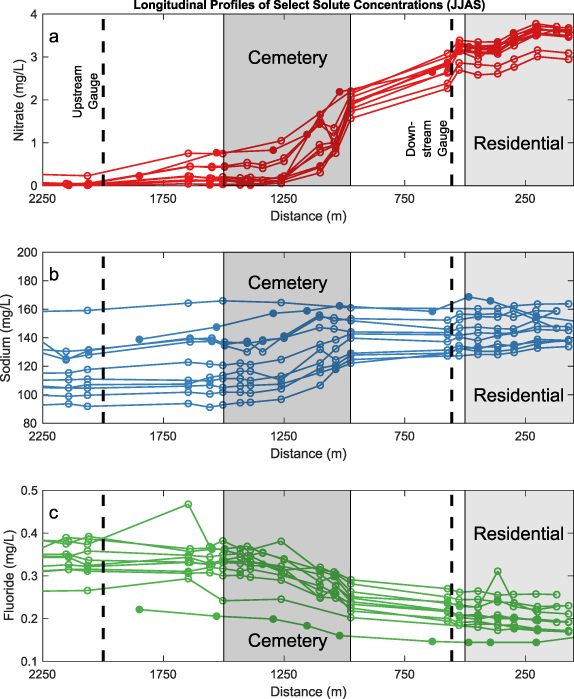
Figure 4. Longitudinal profiles of select stream concentrations along Meadowbrook during the months of June, July, August and September (JJAS), highlighting changes through the cemetery and a residential area. Profiles are colored consistent with findings reported in figure 3 and reflect if mean groundwater concentrations are (a) higher (red; nitrate), (b) the same (blue; sodium), or (c) less (green; fluoride) in the cemetery versus in residential areas. Profiles from 2012 are shown with open circles and the profile from 2019 is shown with closed circles.
Download figure:
Standard image High-resolution image4.4. Nitrate loading from cemetery groundwater
The availability of both continuous streamflow measurements and weekly nitrate concentration data at the two gauging stations allows us to quantify nitrate loads at each station along Meadowbrook using linear regression, as implemented in the R-package 'rloadest.' The linear regression model produced a strong goodness-of-fit between the observed and simulated nitrate loads at both the upstream (R2 = 79%) and downstream (R2 = 71%) sites (Beltran 2020a).
Model results show that the combination of higher stream discharge rates (figure 5(a)) and higher nitrate concentrations (figure 5(b)) result in consistently higher nitrate loads at the downstream gauge throughout JJAS (figure 5(c)). Over this four-month period, the total nitrate load between the two gauging stations increased by 2575 kg (from 558 kg to 3133 kg at the upstream and downstream gauges, respectively) in 2018 and by 3065 kg (from 1287 kg to 4353 kg) in 2019.
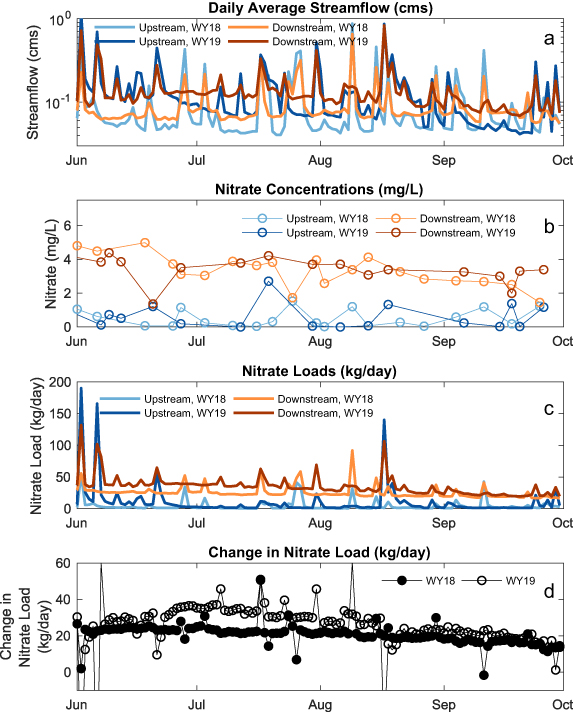
Figure 5. Nitrate loads (c) are modeled using rloadest, where input data include the observed continuous streamflow measurements (a) and the biweekly nitrate concentration measurements (b). Differences in the nitrate loads between the upstream and downstream gauges are used to determine the change in nitrate load along the cemetery reach, between the gauging stations (d).
Download figure:
Standard image High-resolution imageDifferences in nitrate loading rates between the gauging stations reflect the nitrate load contributed from groundwater between the two gauging stations. Although summer storm events cause short-duration pulses of stormwater, these events most often do not impact the change in nitrate load between the upstream and downstream gauges, with the exception of the largest events (figure 6). The change in load between gauging stations captures contributions from both cemetery groundwater and residential groundwater within 500 m up- and down-stream of the cemetery. During the months of JJAS, the nitrate load at the downstream gauge is consistently 20–40 kg NO3 −/day higher than the nitrate load at the upstream gauge (figure 5(d)). This change in load is equivalent to 4.5–9.0 kg N/day as NO3 − delivered to the reach from groundwater. The St. Mary's Cemetery handles about 350–500 burials per year (Doran 2012). Prior estimates of maximum nitrogen loading rates for 500 burials are about 935 kg N (Chan et al 1992), equivalent to about 2.5 kg N/day. Such rough estimates of potential N loading rates indicate it is possible that as much as 25%–50% of the nitrate load between the gauge sites is attributable to groundwater discharge of burial decay products. When normalized to the contributing area of the watershed between the upstream and downstream gauging sites (about 200 ha), the increase in nitrate load between the gauging stations is equivalent to 0.1–0.2 kg NO3 −/day/ha. For comparison, these rates are similar to or exceed published nitrate loading rates for golf courses determined using similar methods (e.g. comparing loads into and out of golf course subwatersheds), which are up to 0.12 kg NO3 −/day/ha (Bock and Easton 2020).
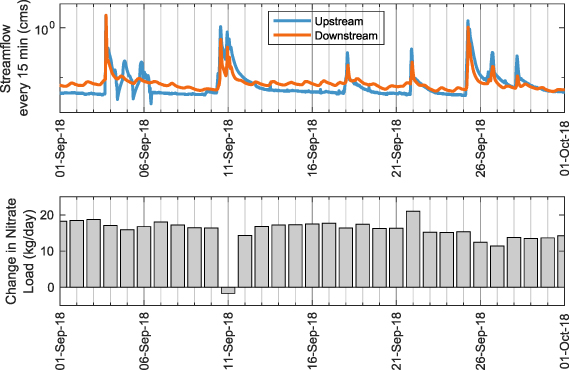
Figure 6. Representative hydrographs of 15-min streamflow data from September 2018 show that summer storm events are typically only hours in duration (top panel) and typically do not impact the change in nitrate load between the upstream and downstream gauging stations, which is consistent through time (bottom panel). Only infrequent, large storms (e.g. 10 and 11 September, 2018) impact the change in nitrate load and that impact is limited to the day of the storm.
Download figure:
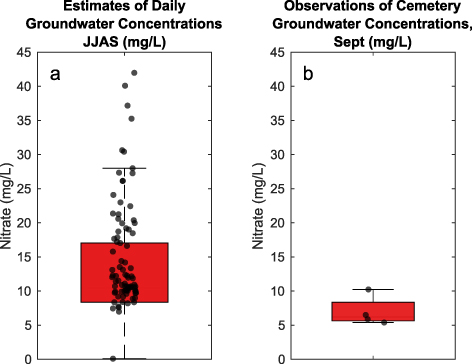
Standard image High-resolution imageTo assess the reasonableness of such nitrogen loading rates from cemetery groundwater, we used a simple mixing model and the nitrate loading rates between gauging stations to estimate the groundwater nitrate concentrations required to generate the differences we observed. For simplicity, we assume that on days when the average streamflow rate increases between the two gauge sites, the differences in daily average streamflow between the stations can be attributed solely to groundwater discharge, acknowledging that this is not the case during periods outside of baseflow. We also inherently omit the impact of hyporheic exchange, which may impact nitrate cycling within the reach. Combining these assumptions with the daily groundwater nitrate loading rates, we can infer the groundwater nitrate concentration required to generate the observed loads. We find that the required groundwater nitrate concentration averages 25 mg l−1, which is higher than the cemetery groundwater nitrate concentrations we observed (figure 7). This finding suggests that although the cemetery is an important source of stream nitrate, another source of nitrate to the stream is required to explain the increase in nitrate load between the gauging stations. Because our observations of cemetery groundwater are limited to one point in time, it is possible that our observations of nitrate concentrations do not capture their full spatial and/or temporal variability and the full range of nitrate concentrations in cemetery groundwater are more similar to those required by the mixing model. But, the year-round consistency of groundwater nitrate concentrations in the residential area suggest minimal temporal variability.
Figure 7. (a) Nitrate concentrations in groundwater estimated from the ratio of change in daily nitrate load between gauges to the change in daily average streamflow between gauges, on days where the streamflow rate increased between the two gauges. (b) Nitrate concentrations observed in groundwater downgradient of the cemetery.
Download figure:
Standard image High-resolution image
Given that (a) estimates of the required groundwater nitrate concentration needed to generate the observed changes in nitrate load are higher than observed and (b) that maximum nitrogen loading rates derived from buried material are less than the groundwater nitrate loading rates, we conclude that although the cemetery appears to be a significant source of nitrate to Meadowbrook, other sources of nitrate to the reach are likely also important contributors to the total load. Such sources of additional nitrate likely include atmospheric deposition, leaking sewer infrastructure, decomposition of other organic material including grass clippings from the cemetery, fertilizer application in other parts of the watershed, and in-stream production of nitrate from in-stream nitrogen recycling (e.g. Ledford et al 2017).
5. Conclusions
We investigated the potential for a large cemetery in a suburban watershed to impact groundwater nitrate concentrations and stream nitrate loads. We attribute spatial and temporal changes in nitrate concentrations and loads in Meadowbrook to discharge of cemetery groundwater that has elevated concentrations of nitrate. We hypothesize that burial decay products are the source, to some extent, of the elevated nitrate in groundwater, although additional sources of nitrate to the stream reach include atmospheric deposition, leaking sewer lines, fertilizers and in-stream decomposition of organic material, including grass clippings from the cemetery. Our study represents an initial investigation into the potential legacy impacts of cemeteries on groundwater quality, with impacts observed over a 6-year timeframe, but more research is needed to fully evaluate the fate and transport of burial decay products in groundwater. Positioning of cemeteries may play a critical role on their impact on streams and groundwater. In this case, the cemetery brackets both sides of the channel and burial sites are located close to the channel in areas with a steep topographic gradient. Other potential risk factors include the water table elevation relative to burial depths and the minimum thickness of the unsaturated zone required to optimize natural attenuation of decay products. Cemeteries are likely to have different impacts depending on their age, the underlying geology, and the seasonal and annual climate. Our results suggest the role of cemeteries in contributing to nitrogen loads, and potentially other contaminant loads, in developed watersheds may be overlooked. Our observations serve as motivation for future research to resolve sources of nitrate in reaches potentially impacted by burial sites. Although it is important to acknowledge the potential impact of burial sites on stream and groundwater quality, we must also consider the historical, cultural, and/or religious significance of such sites before designing future research approaches to increase knowledge of legacy impacts of cemeteries. Working closely with cemeteries and stakeholders will be a critical component of future research.
Acknowledgments
The research presented in this paper was made possible by financial support from the Syracuse University Collaboration for Unprecedented Success and Excellence (CUSE) grant program. Field work was made possible by the contributions of Nathaniel Chien and J.R. Slosson, as well as collaboration with the St. Mary's Cemetery in DeWitt, New York.
Data Availability
Data collected between September 2017 and September 2019, including stream chemistry of grab samples, 15-min streamflow observations, and nitrate load estimates at the gauge sites, as well as cemetery groundwater chemistry, and the 2019 longitudinal stream chemistry data can be found here: Beltran J (2020b). Meadowbrook Stream Chemistry and Streamflow, HydroShare, https://www.hydroshare.org/resource/84ace28c426446c4afcb987ef7ca97ae Data collected in 2012–2013, including stream and groundwater chemistry, can be found here: Ledford and Lautz (2020). Meadowbrook Creek Water Chemistry, 2012–2013, HydroShare, https://www.hydroshare.org/resource/d4bf09615d8940ccbe4bb1eee13abf3d
The data that support the findings of this study are openly available at the following URL/DOI: https://www.hydroshare.org/resource/84ace28c426446c4afcb987ef7ca97ae/.