

Abstract
International efforts to avoid dangerous climate change aim for global carbon dioxide (CO2) emissions to be net-zero by midcentury. Such a goal will require both drastically reducing emissions from high-income countries and avoiding large increases in emissions from still-developing countries. Yet most analyses focus on rich-country emissions reductions, with much less attention to trends in low-income countries. Here, we use a Kaya framework to analyze patterns and trends in CO2 emissions from the combustion of fossil fuels in Africa between 1990 and 2017. In total, African CO2 emissions were just 4% of global fossil fuel emissions in 2017, or 1185 MtCO2, having grown by 4.6% yr−1 on average over the period 1990–2017 (cf the global growth rate of 2.2% yr−1 over the same period). In 2017, 10 countries accounted for about 87% of the continent's emissions. Despite modest recent reductions in some countries' CO2 emissions, projections of rapid growth of population and per capita GDP will drive future increases in emissions. Indeed, if the continent-wide average growth rate of 2010–2017 persists, by 2030 Africa's emissions will have risen by ∼30% (to 1545 MtCO2). Moreover, if increases in carbon intensity also continue, Africa's emissions would be substantially higher. In either case, such growth is at odds with international climate goals. Achieving such goals will require that the energy for African countries' development instead come from non-emitting sources.
Export citation and abstract BibTeX RIS

Original content from this work may be used under the terms of the Creative Commons Attribution 4.0 license. Any further distribution of this work must maintain attribution to the author(s) and the title of the work, journal citation and DOI.
1. Introduction
The reduction of greenhouse gas (GHG) emissions has become a key climate change mitigation strategy. In particular, international efforts to avoid dangerous climate change aim for global carbon dioxide (CO2) emissions to be net-zero by 2050 [1]. While industrialized countries have so far dominated historical emissions, rapid growth in energy demand of developing economies, may soon spur their absolute emissions beyond those of industrialized countries [2]. For example, China's pace of development has been exceptional such that both its income per capita and its emissions per capita are now comparable to that of the EU-15 countries 50 years ago [3]. At present Africa only contributes to 4% of global CO2 emissions but the trajectory in which Africa is developing could see Africa's emissions continue to increase with certain countries becoming big emitters comparable to some countries in the developed world. The 2015 Paris Agreement which represents a historic achievement in multilateral diplomacy requires countries in different developmental stages to reduce emissions to mitigate threats from climate change. Accordingly, 'developing country Parties should continue enhancing their mitigation efforts, and are encouraged to move over time towards economy-wide emission reduction or limitation targets in the light of different national circumstances' [4].
Energy-related CO2 emissions are the primary cause of anthropogenic climate change [5], with changes in the quantity and sources of primary energy consumed (e.g. oil, coal, gas and renewables) strongly affecting per capita CO2 emissions, and depending in turn on a country's real per capita income [6]. Energy intensity (energy per unit of GDP) has been shown to have a positive and statistically significant impact on CO2 emissions in Sub-Saharan Africa countries [7]. Therefore, sustainable development goal 7 (SDG 7) requires countries around the world to ensure access to affordable, reliable sustainable and modern energy while also reducing CO2 emissions. Accordingly, Parties need to expand access to energy services by, for example, increasing production from renewable energy sources in their energy mix and improving energy efficiency [8]. Africa is one of the continents in which about 50% of the population do not have access to electricity and more than 60% still rely on traditional biomass for cooking [9]. Although energy accessibility is a top priority, providing access to modern energy services to these areas under a business-as-usual policy scenario in most African countries will result in substantial increases in both primary energy supply and CO2 emissions by 2030 [10]. This is because in many African countries, existing policies will not prevent such increases in energy-related CO2 emissions [11].
In addition, increasing population in many African countries will also lead to an increase in energy demand and potentially CO2 emissions. Current population growth in Africa coupled with economic development plans such as Agenda 2063 [12] could thus lead to significant increase in emissions from the continent without simultaneous efforts to decrease the energy intensity of economic activities and/or the carbon intensity of energy used. Africa has the highest rates of population growth at present ∼2.3% per year in recent years, and the continent's population is projected to approximately double by 2050, reaching 2.5 billion. Indeed, of the additional 2.0 billion people who may be added to the global population by 2050, more than a billion (1.05 billion, or 52%) are projected to live in countries of sub-Saharan Africa [13].
Between 1990 and 2017, oil production in Africa increased by an average of 0.9% yr−1, led by oil-rich countries like Angola, Egypt, Libya, and Algeria [14]. The compounded effects of drivers of emissions such as those mentioned above could see many African countries currently regarded as low emitters become major sources of CO2 emissions. How these countries will evolve in emissions in the coming decade depends on the specific situation in the country. Understanding current and future emissions given these parameters is therefore quite important.
Despite the importance of country-specific circumstances and trends in CO2 emissions in determining the continent's future emissions, relevant information, tools and expertise can be difficult to locate. In particular, one of the challenges in assessing emissions around the world is the need for better data and tools for calculating emissions. This is also because different countries have different development paths, governance systems, and different mixes of sources of energy as well as different levels of energy access. These differences make it important to develop specific tools that can be used at country level to model CO2 emissions. One such tool is the Kaya identity which can help in addressing some of these challenges. The Kaya identity has been widely used to quantify the contribution of different factors to changes in emissions and to assess the effectiveness of policy and technology measures [15]. Using the Kaya identity, CO2 emissions from a country or region are decomposed into four factors: CO2 emissions per unit of energy or carbon intensity, energy intensity, economic rent, and population [16].
A review of literature reveals that there have been very few studies focused on CO2 emissions from fossil fuel combustion in African countries. More than a decade ago, Canadell et al [17] assessed CO2 emissions from both fossil fuel combustion and land use change in Africa. More recently, Steckel et al [18] used the Kaya identity to decompose changes in CO2 emissions in sub-Saharan Africa, including the contributions of specific energy carriers and short-term projections of future developments based on planned investments. However, there has been no country-specific analysis of recent trends of the sort necessary to evaluate future emissions trajectories and which countries are on track to develop without large increases in their CO2 emissions. Indeed, most of the studies evaluating CO2 emissions have instead focused on the developed world and emerging economies in Asia which together account for over 80% of global CO2 emissions, and only a few studies have focused on the African continent as a whole or specific African countries [17, 19–21]. In contrast, African emissions from land use, land use change and forestry (LULUCF) have been more regularly assessed, because in many African countries these are larger than emissions from fossil fuel combustion. However, fossil fuel emissions are growing rapidly in many Africa countries, and thus warrant research attention.
2. Results
2.1. Energy supply and CO2 emissions
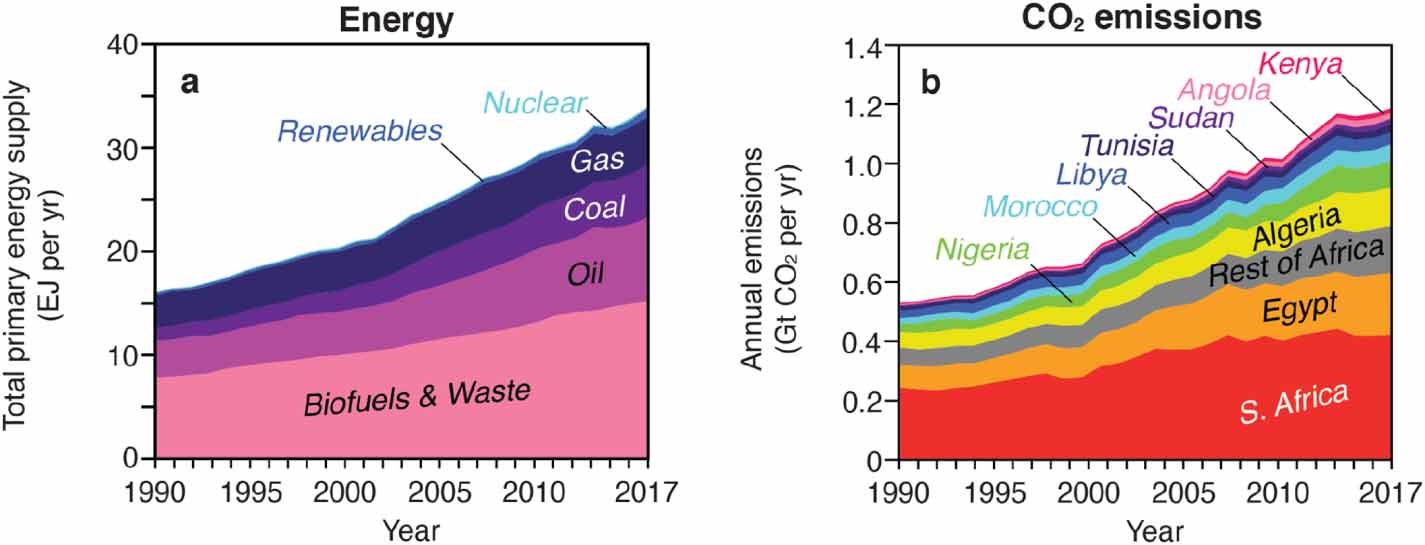
Our findings show that the primary source of energy in Africa between 1990 and 2017 is biofuels and waste (figure 1(a)). The total primary energy supply (TPES henceforth) in Africa has increased by 86% between 1990 and 2017 from 16 EJ to 34 EJ. The highest increase was in the relative shares of oil (from 22.1%–23.6%) and natural gas (from 7.7%–15.1%) between 1990 and 2017. Over the same period, there was a decrease in the relative shares of biofuels and waste (from 49.1%–45.3%), coal (from 19.2%–13.5%) and nuclear (from 0.6%–0.5%). These non-renewable energy sources are also high sources of CO2 emissions Indeed the fuel mix in Africa's TPES has been dominated by biofuels and waste, oil and coal. However, there has been a significant increase in the use of natural gas making it the third most used fuel in 2017 after biofuels and waste, and oil. The share of fossil fuels in Africa's energy mix increased from 49% in 1990 and has steadied at about 52% since 2005. Despite a small (2.0%) increase in the use of renewables (excluding biofuels and waste), their relative share in the energy mix remains quite insignificant in 2017. Trends in the fuel mixes reveal that most African countries will continue to rely on fossil fuels as a result of the slow uptake of renewable energy sources such as solar and wind between 1990 and 2017 (see figure S1 available online at https://stacks.iop.org/ERL/15/124039/mmedia). Our results show an increasing trend in Africa's CO2 emissions between 1990 and 2017 (figure 1(b)) except in 2015. During this time, South Africa was the highest CO2 emitter followed by Egypt, Algeria and Nigeria. With about 1185 MtCO2 emitted in 2017 Africa contributed to 4% of global CO2 emissions with the lowest CO2 emissions intensity of 34.9 tCO2/TJ and CO2 emissions per population of 0.9 tCO2/capita compared to all regions of the world. However, Africa's CO2 emissions/GDP of 0.5 kgCO2/$ was higher than that of all regions except Asia with 0.6 kgCO2/$ [9].
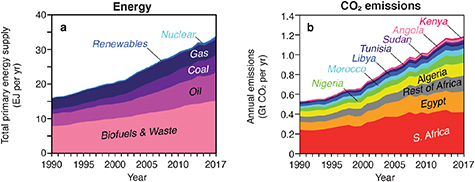
Figure 1. Trends 1990–2017 in energy sources (a) and CO2 emissions from top 10 emitting countries (b).
Download figure:
Standard image High-resolution image2.2. Kaya identity and influencing factors
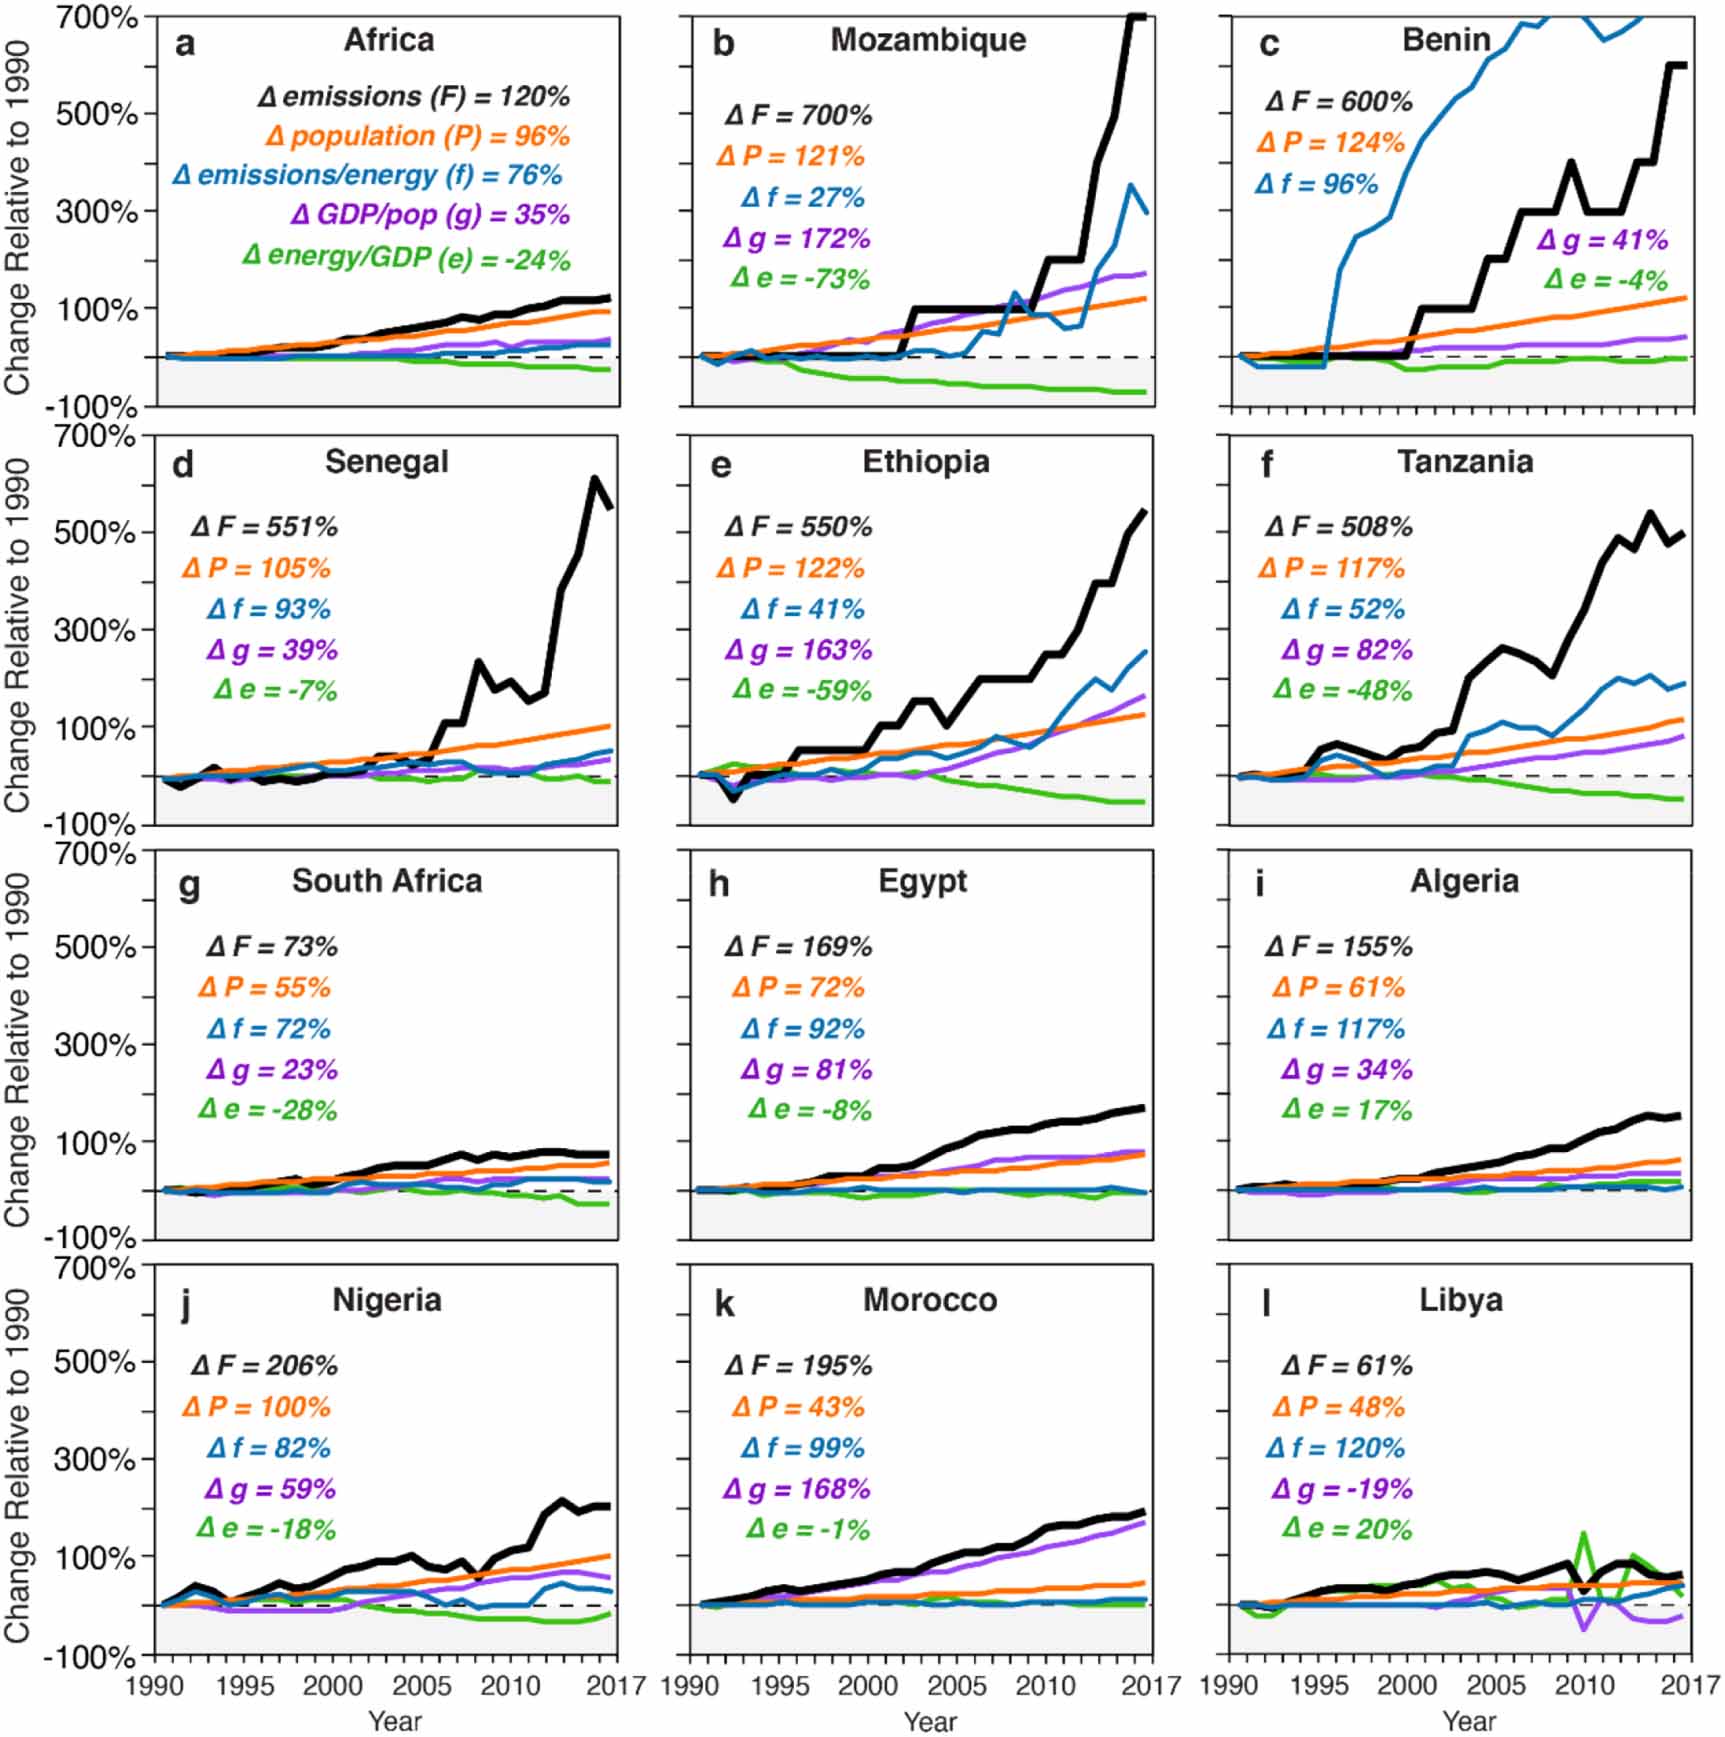
Our results show that energy intensity in Africa decreased by about 15% between 1990 and 2017. During the same period, the population, carbon intensity and GDP per capita increased by 97%, 47%, and 71% respectively. These resulted in a net increase in total emissions by 120% between 1990 and 2017 as seen in figure 2(a). Mozambique had the highest increase in CO2 emissions (700%) in Africa between 1990 and 2017. This is not surprising as Mozambique also experienced increases in population (121%), GDP per capita (172%) and carbon intensity (300%) while energy intensity reduced by −73% during the same period. The trends in Kaya factors of the top 5 countries with the highest rate of emissions growth (1990–2017) are shown in figures 2(b)–(f). The second highest increase in CO2 emissions after Mozambique was from Benin (600%), followed by Senegal (551%), Ethiopia (550%) and Tanzania (508%). Overall, CO2 emissions increased in all countries between 1990 and 2017 except in DR Congo and Zimbabwe where emissions decreased by −33% and −38% respectively. During this period, all countries also experienced an increase in population with the highest increase occurring in Niger (169%), Angola (152%) and Congo (135%). Nevertheless, GDP per capita change over the same period varied widely from 172% in Mozambique to −42% in Congo. The change in energy intensity (energy per GDP) between 1990 and 2017 was mostly negative in 67% of the countries. The highest changes in energy intensity were in Gabon (136%) and Cote d'Ivoire (91%) while the lowest changes occurred in Mozambique (−73%) and Ethiopia (−59%). The highest increase in CO2 intensity between 1990 and 2017 occurred in Benin (740%), Mozambique (300%) and Ethiopia (256%) while CO2 intensity decreased in four other African countries. Trends in Kaya factors of the top 6 emitters in 2017 are shown in figures 2(g)–(l). It is seen that the highest emitters in 2017 experienced modest increases in CO2 emissions. Observed patterns show that countries can be grouped based on changes in different Kaya factors such as energy- and carbon-intensity with economic growth (figures S2–S5).

Figure 2. Trends in Kaya factors of (a) Africa, (b)–(f) countries with the highest rate of emissions growth (1990–2017), and (g)–(i) top 6 CO2 emitters in 2017. All trends are given as percent changes relative to 1990. GDP is purchasing power parity.
Download figure:
Standard image High-resolution imageCumulatively, the top 10 emitters account for 87% of CO2 emissions in 2017 but make up about 43% of the population and 74% of GDP (figure 3). Interestingly, although Nigeria has the highest share of the population (15.4%) it is not the highest emitter but South Africa with only 4.6% of the population is the highest emitter (35.6%). It is seen that there are inequalities in carbon emissions among African countries with different levels of economic development. The top 3 countries with the highest shares of GDP, Egypt (17.8%), Nigeria (17.6%), and South Africa (12.0%) account for over 60% of African CO2 emissions in 2017.
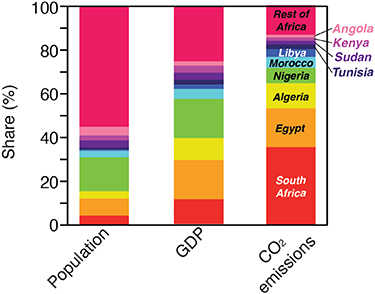
Figure 3. Relative shares of population, GDP and emissions of African countries in 2017.
Download figure:
Standard image High-resolution image2.3. Past and future trends in CO2 emissions
2.3.1. Historic emission patterns
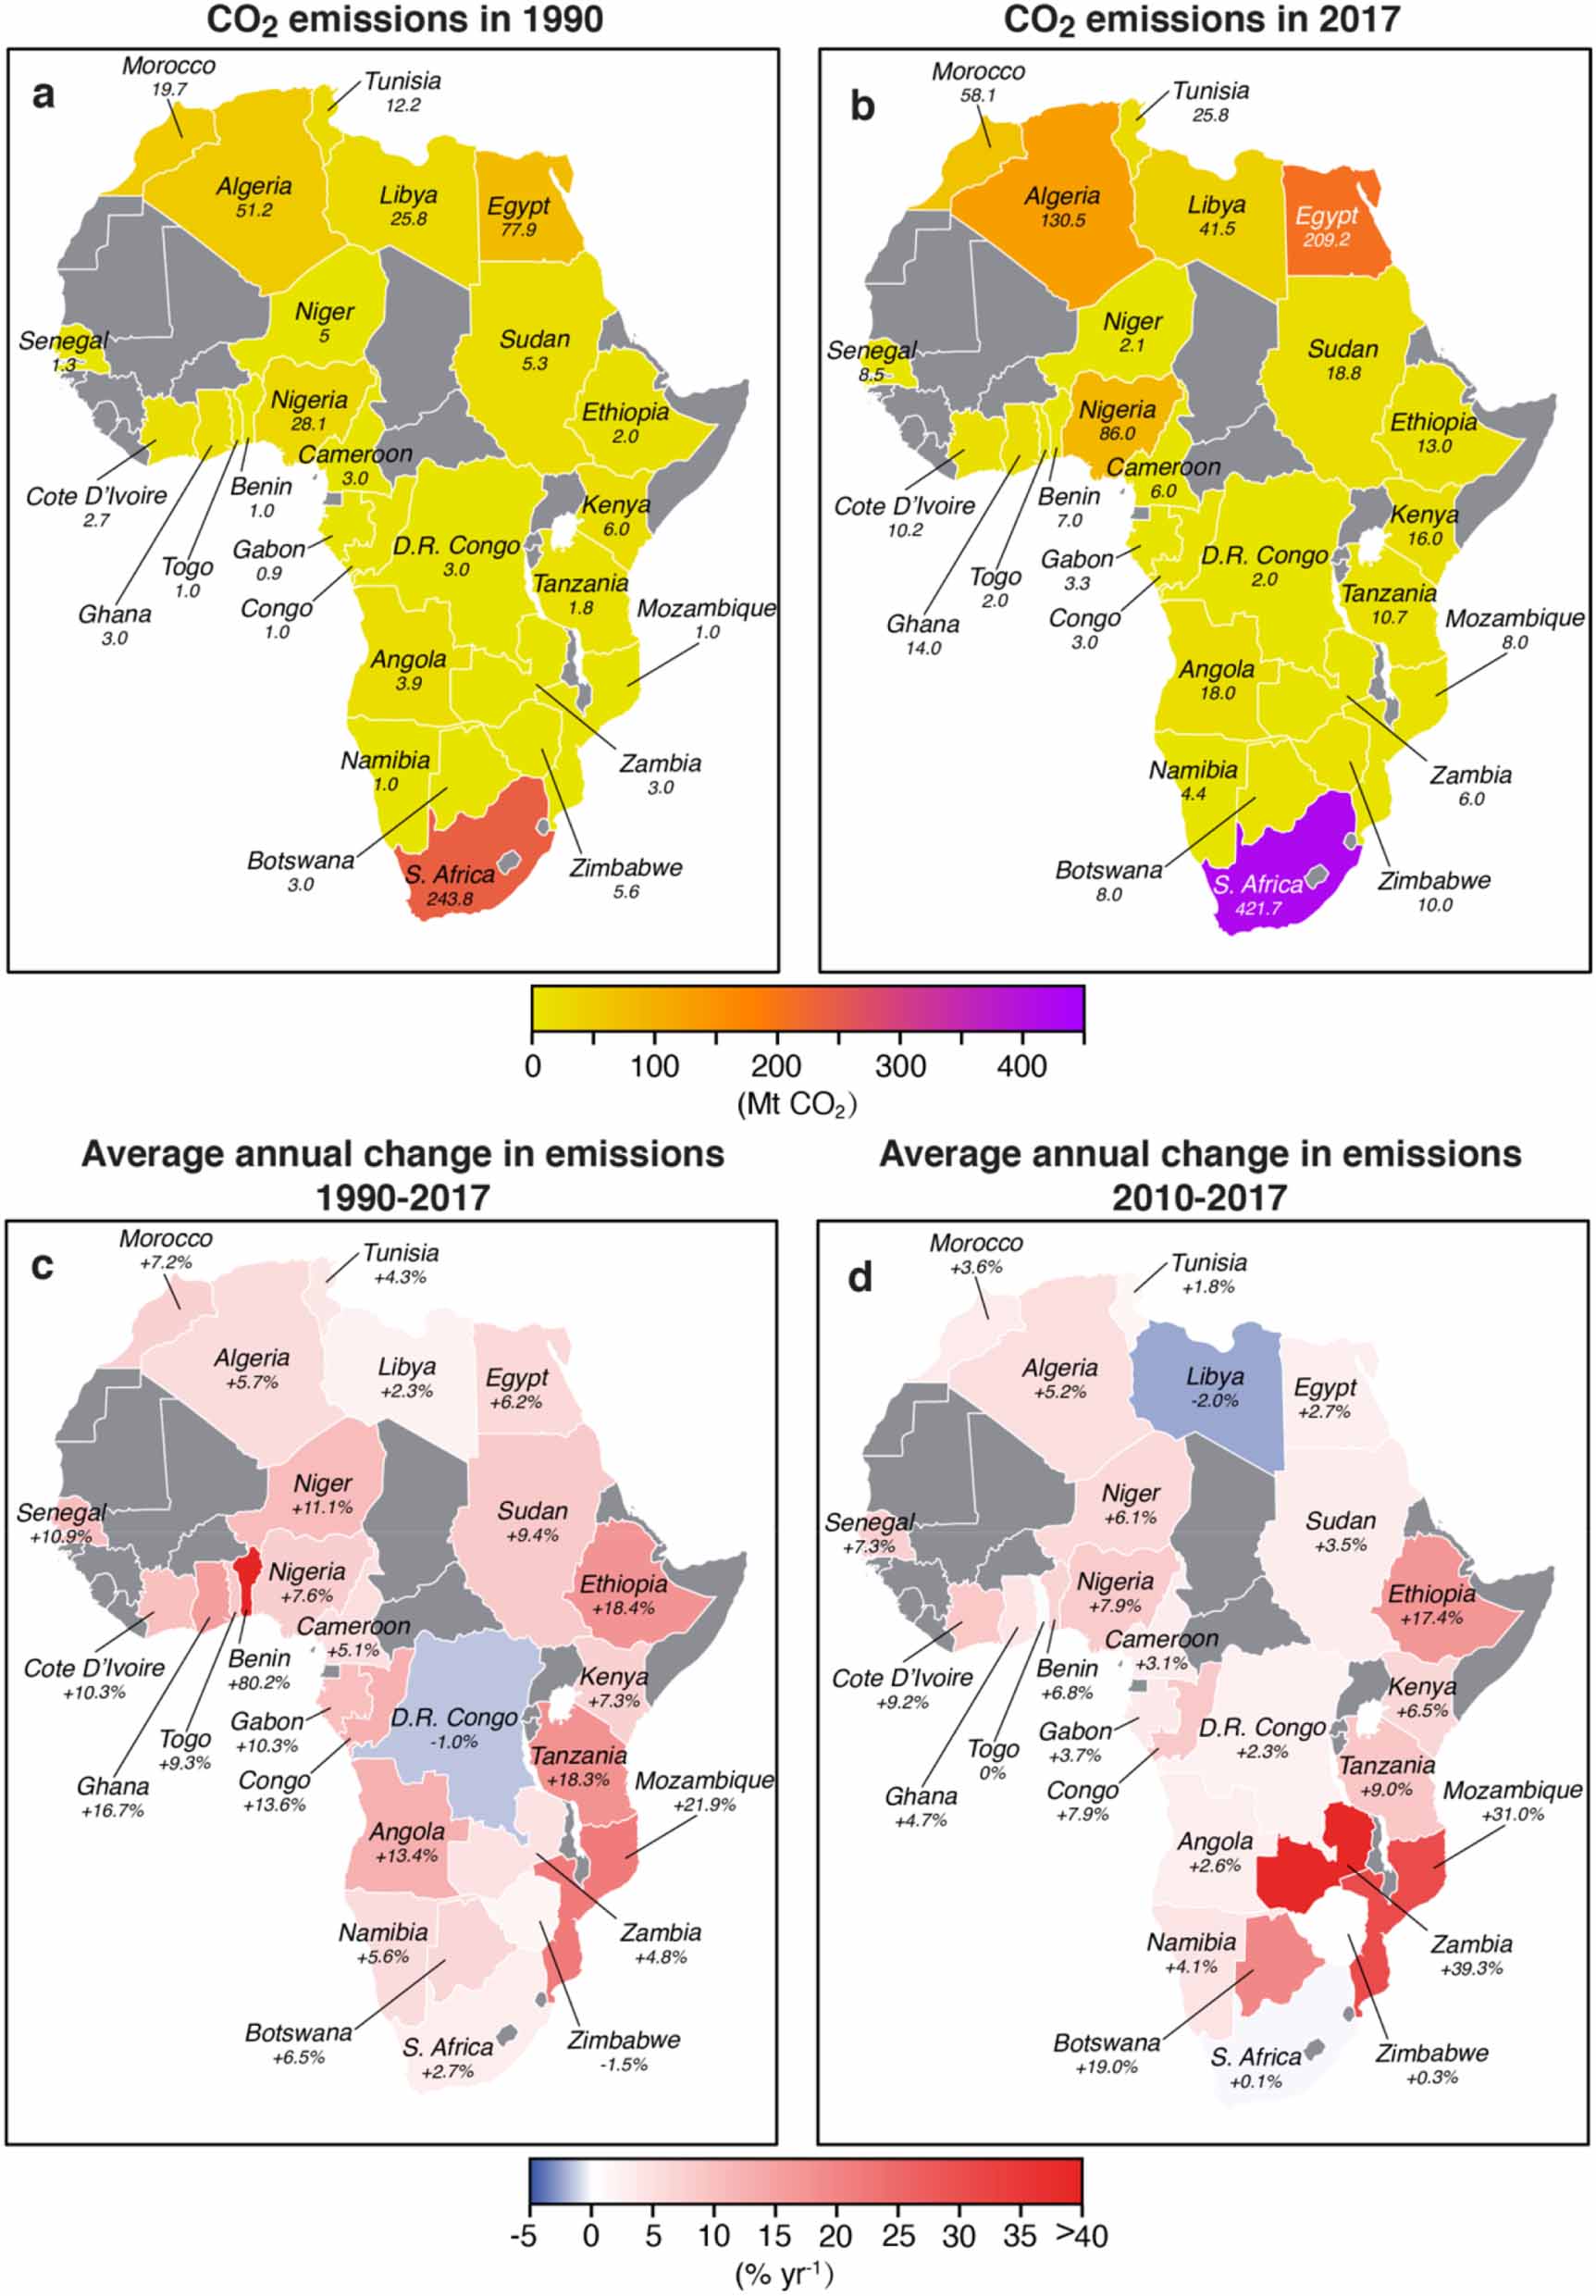
Historic trends show that South Africa was the highest emitter both in 1990 and 2017 with a total of 243.8 MtCO2 and 421.7 MtCO2 respectively. The second highest emitter in both years was Egypt, followed by Algeria and Nigeria (figure 4(a)). In 1990, Zambia, Congo, Niger and DR Congo had the lowest emissions (an average of 0.5 MtCO2). Low emitters in 2017 were Congo, Niger and Togo with 2.1 MtCO2 each (figure 4(b)).

Figure 4. CO2 emissions of African countries (MtCO2) in 1990 (a) and 2017 (b) and average annual changes in emissions 1990–2017 (c) and 2010–2017 (d).
Download figure:
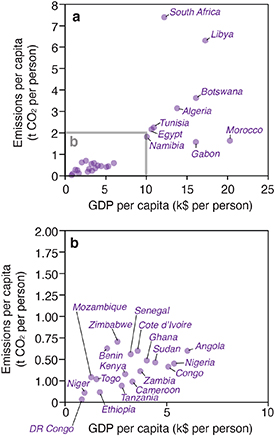
Standard image High-resolution imagePatterns of CO2 emissions can be explained by many factors including GDP. It is therefore not surprising as we found that countries with high CO2 emissions per capita also have high GDP per capita in this study. For example, South Africa (7.40 tCO2) and Libya (6.31 tCO2) which had the highest CO2 emissions per capita in 2017, also had high GDP per capita of $12 215 and $17 321 respectively (figure 5(a)). This trend was also observed for Botswana, the third highest emitter per population (3.97 tCO2) and a relatively high GDP per capita of $16 165. However, not all countries with high GDP per capital in 2017 were high emitters. For example, Morocco ($20 319) and Gabon ($16 145) had high GDP per capita but are low emitters per population with 1.63 tCO2 and 1.57 tCO2 respectively suggesting that a country can grow without necessarily increasing its emissions. Nevertheless, countries with low CO2 emissions per capita were found to mostly have low GDP per capita (figure 5(b)). An example is DR Congo, the lowest emitter per population (0.08 tCO2) that had a GDP per capita of $808.
Figure 5. Emissions per capita vs GDP per capita for African countries in 2017.
Download figure:
Standard image High-resolution image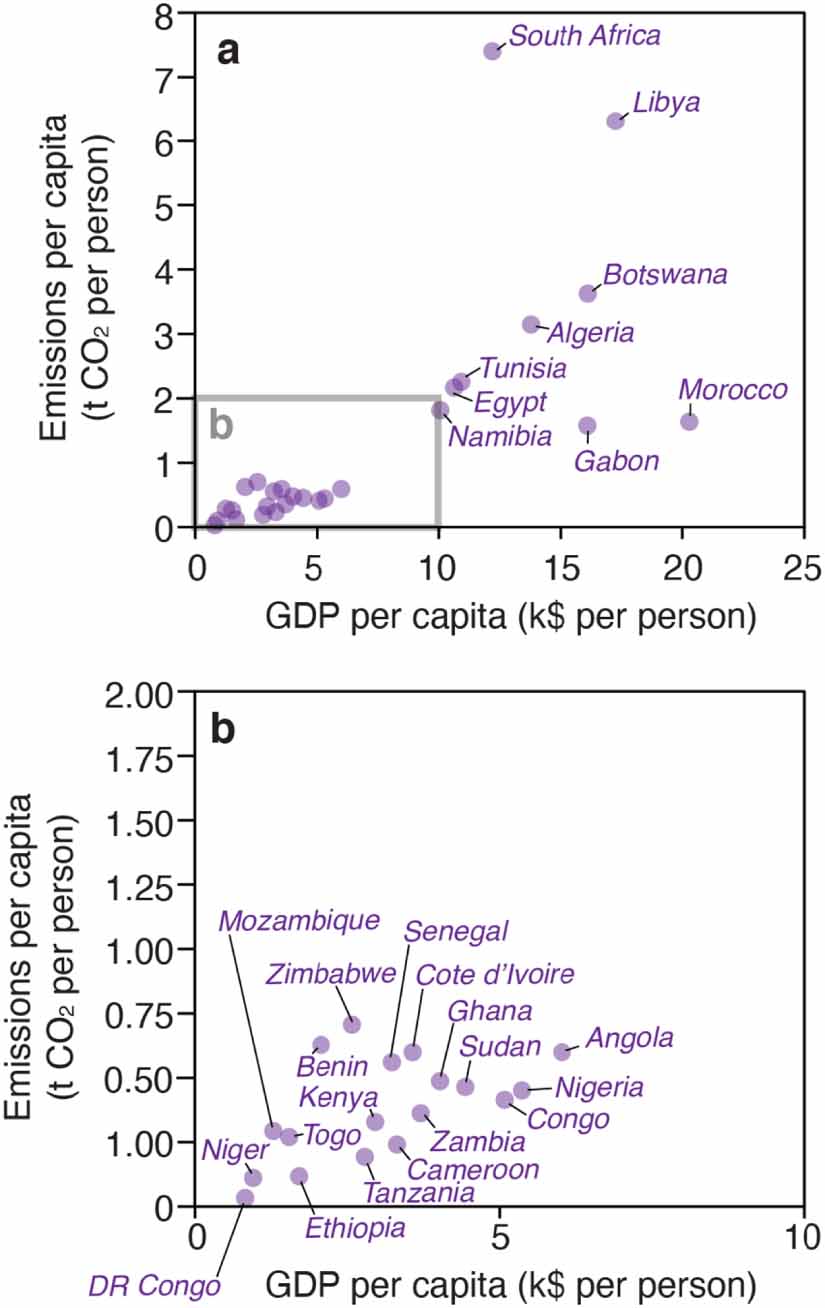
2.3.2. Projected emissions in 2030
In order to get an insight into how the trends reported above might pan out in future, we used the most recent data from 2010 to 2017 to project trends in emissions for 2030. In analyzing these trends in terms of growth, we found that Mozambique has the highest annual average growth of CO2 emissions of 42.9% followed by Zambia (28.6%) and Botswana (23.8%) between 2010 and 2017 (figure 4(d)). Indeed, all countries record a net increase in emissions except DR Congo and Togo where CO2 emissions did not change (0.0%) while emissions decreased by −2.0% in Libya over the same period. The projections for 2030 show that Africa's CO2 emissions will increase by 30% from 1185 MtCO2 in 2017 to 1545 MtCO2 in 2030 under a business-as-usual scenario. Interestingly, the 2030 scenario shows that South Africa would remain the highest emitter in Africa despite a modest increase in CO2 emissions of about 0.1%. Also, Egypt, Algeria and Nigeria will remain one of the highest emitters on the continent. By 2030, the top 10 emitting African countries will account for 89% of total fossil fuel emissions in Africa (1368 MtCO2), a slight increase in share from 2017, when the top 10 accounted for 87% of African emissions.
Although African emissions account for a small share of the global total, a simple extrapolation of recent trends suggests that CO2 emissions on the continent could increase by 30% between 2017 and 2030, at which point Africa's emissions would be ∼4% of global emissions in 2030. However, a range of studies indicate that the growth of fossil energy and thus CO2 emissions in African countries may accelerate in the coming decades [18], though published projections vary widely. For example, Africa's emissions are expected to double by 2050 [22], while emissions in sub-Saharan Africa (excluding South Africa) are projected to increase by 50% [23]. Integrated assessment model scenarios included in the IPCC Special Report on 1.5 °C also reflect large differences. In global scenarios that limit mean global warming to <2 °C relative to the pre-industrial, emissions in the Africa and Middle East region peak almost immediately and reach net-zero by 2100, whereas emissions increase several-fold in scenarios that exceed international climate targets (figure S6 in the supplemental section). At the higher end of such scenarios, Africa's end-of-century emissions could be more than 20% of global emissions [24, 25].
3. Discussion and conclusions
Several key sectors in Africa including energy, agriculture, and water supply are vulnerable to threats caused by global climate change [26]. The single largest human influence on climate change is the combustion of fossil fuels that account for about 80% of anthropogenic GHG emissions [2]. International efforts to limit global warming to 1.5 °C require that global CO2 emissions are reduced to net-zero worldwide around 2050 [1]. The expectation is that measures put in place to reduce emissions should result in substantial decrease in CO2 emissions. This entails pursuing development pathways that provide opportunities for African countries to improve and expand access to modern energy services while also building low-emission and climate-resilient economies [26]. The decomposition of African countries' CO2 emissions that we present enables identification of the key variables driving changes in CO2 emissions, in turn helping countries to target opportunities for reducing their energy-related emissions in the future [27].
Although emissions are decreasing elsewhere (e.g. Europe and the Americas) Africa's CO2 emissions are poised to grow in the coming decades. The growth rate in energy related CO2 emissions in Africa between 1990 and 2017 (123%) is considerably greater than the world average of 60%. Our results show that about 89% of African countries included in this study have increasing emissions ranging from 0.1%–42.9% yr−1 as recently as 2010–2017. Similar results have been found in developing countries such as China [2]. One factor that influences CO2 emissions is population growth and has been widely reported in recent studies [28–30]. An increase in population means more people needing energy for their daily use. All 27 countries in this study, experienced population growth of between 1% and 6% yr−1 during the period 1990–2017. About a billion (52%) people are projected to live in countries of sub-Saharan Africa by 2050 [13]. An increase in CO2 emissions with population growth between 1990 and 2017 in 93% of countries included in this study indicate that the high projected increase in population in sub-Saharan Africa will result in high levels of CO2 emissions if strict measures to curb emissions are not put in place. The only exceptions where CO2 emissions decreased despite population growth in this study were in the Democratic Republic of the Congo (DR Congo) and Zimbabwe.
Another factor which has been implicated for the growing CO2 emissions in Africa is GDP. Like many countries around the world, most African countries are seeking to increase their wealth through GDP growth aiming to reach higher levels of income by 2050 [31]. In addition, on average, 45%–50% of sub-Saharan Africans live below the poverty line—a much higher proportion than in any other regions of the world [32]. Economic development should be a top priority over the coming decades if African countries are to meet their development goals. Our results revealed that CO2 emissions increased in 81% of the countries in this study as a result of increase in GDP per capita between 1990 and 2017. This trend shows that economic growth resulting in increase in GDP should result in an expected increase in CO2 emissions in many African countries. The default situation is that every country seeks to grow its GDP but such growth will have consequences for CO2 emissions if measures are not taken to actively reduce emissions. To confirm the impact of GDP on emissions, we found decreases in CO2 emissions in Zimbabwe and DR Congo where there was also decreases in GDP per capita.
With energy use per capita among the lowest in the world, there is no doubt that Africa will need to increase its energy consumption by providing access to modern energy services in order to drive economic growth and development goals [26]. The energy required for development will probably mean higher energy intensity (energy per unit of GDP) of economies because industry takes much energy [33]. We found that energy intensity increased in 33% of the countries in this study between 1990 and 2017 resulting in CO2 emissions increases except in DR Congo and Zimbabwe (explained above). This result is supported by recent studies that found that increase in energy intensity increases CO2 emissions in African countries [7, 18, 34–35] while energy consumption also increases both economic growth, and financial development in Africa [36]. In contrast, we found that energy intensity decreased in 59% of the countries in this study that all experienced increases in CO2 emissions between 1990 and 2017.
The long-term (1990–2017) trends of increase in CO2 emissions drivers means that African emissions are poised to grow rapidly, blowing past the climate goals. Energy demand is projected to continue to grow under a business-as-usual policy scenario in most African countries as shown in this study. Indeed, current policies are not sufficient to mitigate energy related CO2 emissions in some African countries like Nigeria [11]. Also, providing access to clean electricity to off-grid locations will require a three-fold increase in primary energy supply and 26% (1317 Mt) increase in 2030 CO2 emissions [10]. Therefore, existing policies to curb CO2 emissions (from a production perspective) should be combined with new policies that influence consumers' lifestyles and behaviors, develop energy efficient technologies and apply low tariffs on imported energy efficient appliances, to drive down CO2 emissions from a consumption perspective [11]. In addition, it is necessary to promote energy efficiency policies such as decreasing subsidies in energy prices and adoption of renewable energy technologies [37]. Low carbon-intensive technologies will enable African countries to support growth in energy services required to foster economic development. Such strategies would raise the quality of life of African people, and simultaneously restrain the growth of energy-related CO2 emissions.
Economic globalization and associated growth in international trade since the late 1990s have greatly restructured global production activities and related CO2 emissions. Trade among developing nations has more than doubled between 2004 and 2011, reflecting a new phase of globalization [38]. Global carbon emission profiles have been substantially shaped by carbon leakage through international trade [39, 40]. These trends will certainly affect the magnitude and regional distribution of future global CO2 emissions [41]. Such trends suggest that successful climate mitigation will increasingly depend upon coordination among nations, especially in the global South. However, our analysis is focused only on territorial emissions (i.e. emissions occurring in Africa). Future work may productively evaluate the extent to which increases in African emissions are tied to exports, as well as how foreign direct investment is driving development of fossil energy infrastructure on the continent [42].
4. Methods and data
4.1. Emissions analysis
Several studies have used the Kaya identity for quantifying CO2 emissions in different sectors [15, 43–46]. For example, Li et al [47] used the Kaya identity to decompose the driving forces of agricultural CO2 emissions in China while O' Mahony [45] used the extended Kaya identity to analyze the driving forces of carbon emissions in Ireland from 1990 to 2010. Lin et al [20] investigated the impact of industrialization on CO2 emissions in Nigeria based on time series data from 1980 to 2011, using the Kaya identity framework, Johansen's cointegration technique and Vector error correction model. Some recent studies have used structural and index decomposition analyses to identify the main drivers of observed changes over time of environmental impacts and energy. For example, Inglesi-Lotz [20] used a Logarithmic Mean Divisia Index (LMDI) decomposition method to investigate the main factors affecting changes in CO2 emissions of South Africa from 1990 to 2014. Woods et al [48] analyzed the structure and drivers of consumption-based carbon accounting of EU emissions from 1995 to 2016 for all major GHGs.
Structural decomposition analysis (SDA) is a method for quantifying the driving factors of a dependent variable, such as CO2 emissions or energy consumption, including changes in consumption, changes in energy mix, and changes in economic structure [49, 50]. Although powerful and popular analytical tools, such SDAs require detailed data about countries' economic structure (i.e. input-output tables) that are not widely available or reliable for many African countries over the time period of this study. Though simpler, the Kaya approach is a less data-intensive approach that can nonetheless help to reveal and quantify annual and long-term trends in the relationships among carbon emissions, energy use, and population and economic growth at a national level [44, 50].
Here, we use the Kaya identity (equation (1)) to analyze and decompose trends in and drivers of African CO2 emissions between 1990 and 2017 [51–53]:
where F represents the anthropogenic flux of fossil fuel CO2 emissions in Africa, P is African population, G is the aggregate gross domestic product of Africa (purchasing power parity), and E is Africa's primary energy consumption,  = G/P is per-capita GDP in Africa, e= E/G is energy intensity of African GDP, f= F/E is the emissions intensity of African energy use, and h= F/G = ef is the emissions intensity of African GDP. The raw data is from the International Energy Agency and the World Bank.
In order to facilitate discussion of important differences and trends, we also disaggregate each of these terms into 27 individual African countries. Africa's CO2 emissions can be disaggregated into countries (distinguished by a subscript j) with emission Fj , population Pj , GDP Gj , energy consumption Ej , and country intensities gj = Gj /Pj, ej = Ej/Gj, fj = Fj /Ej , and hj = Gj /Pj , and hj = Fj /Gj = ejfj. Writing a Kaya identity for each country, Africa's total CO2 emissions can be expressed by summing over all countries as:
4.2. Data sources
Although Africa has 54 countries we selected 27 countries in Africa to carry out our analysis based on data availability. For each of the 27 countries (Algeria, Angola, Benin, Botswana, Cameroon, Congo, Cote d'Ivoire, DR Congo, Egypt, Ethiopia, Gabon, Ghana, Kenya, Libya, Morocco, Mozambique, Namibia, Niger, Nigeria, Senegal, South Africa, Sudan, Tanzania, Togo, Tunisia, Zambia, Zimbabwe), we obtain data for population and GDP from the World Bank Databank [54], and for primary energy consumption (i.e. total primary energy supply) and CO2 emissions from the International Energy Agency [9, 55, 56]. Although these are not all African countries, they are all the countries for which all data was available and represent 41.2% of the continent's population and 71.9% of its GDP in 2017.
Data availability statement
The data that support the findings of this study are available upon reasonable request from the authors.