


Abstract
Air pollution in the form of PM2.5 decreases life expectancy considering its contribution to morbidity and mortality. Therefore, scientific and accurate PM2.5 exposure risk assessment is essential. However, the considering daily/hourly mean PM2.5 concentration and overlooking population mobility in exposure risk assessments result in underestimation of its adverse effects. Thus, using social media data and exceedance PM2.5 concentration, two novel indicators named hourly exceedance PM2.5 exposure (HEPE) and daily cumulative variation of exceedance PM2.5 exposure (DCEPE) are developed in our study. Spatiotemporal variation analysis of HEPE showed that the first exceedance PM2.5 exposure risk was observed at 10:00; this lasted till the end of the day. According to the standard deviation ellipse (SDE) method analysis results, at first, the major spatial tendency direction was northeast-southwest, with the average center (AE) located in the Yuangang Township. Then, the HEPE in the western study area increased dramatically. The major spatial tendency direction shifted from northeast-southwest to east-west. Consequently, the AE of HEPE shifted to central study area. The spatiotemporal variation characteristics led us to investigate the mechanisms. A bivariate LISA was applied to detect the spatial association between DCEPE and city functional zones (CFZs). Results showed that highly spatial associations were found between the DCEPE and CFZs in the southwest of the study area. Residential neighborhoods and transportation services showed a closer relationship with the spatial distribution of DCEPE. Based on these results, we found increasing public health threats posed by PM2.5. Thus, HEPE is an essential factor to assess air pollution exposure risk. Moreover, more attention should be paid to the spatial association between DCEPE and city functions, which is important for the development of air pollution mitigation strategies.
Export citation and abstract BibTeX RIS

Original content from this work may be used under the terms of the Creative Commons Attribution 4.0 license. Any further distribution of this work must maintain attribution to the author(s) and the title of the work, journal citation and DOI.
Abbreviation interpretations:
| EP | exceedance concentration of PM2.5 |
| HEPE | hourly exceedance PM2.5 exposure |
| DCEPE | daily cumulative variation of exceedance PM2.5 exposure |
| TUD | Tencent user density |
| SDE | standard deviation ellipse |
| CFZs | city functional zones |
1. Introduction
Inhalation of PM2.5 has been widely documented in order to determine the adverse effects on public health (Lu et al 2015, Shi et al 2015b, Xie et al 2016, Ruan et al 2019, Zhang et al 2019). In 2010, Institute for Health Metrics and Evaluation and World Health Organization conducted the Global Burden of Disease study. Results revealed that over 3.2 million premature deaths were associated with PM2.5 pollution, because of its increasing of morbidity and mortality from cardiovascular and respiratory diseases (Chen et al 2017a). Future climate projections suggest that the potential PM2.5 risk will be exacerbated, considering its enhanced intensity and frequency. Moreover, the urbanization and natural disaster, such as wildfire, are also treated as potential driving factors of PM2.5 increasing(Ikeda and Tanimoto 2015, Vadrevu et al 2017). Therefore, PM2.5 exposure risk assessment is of vital importance for development of preventive measures to alleviate its adverse effects on public health. Current investigation selected daily/hourly mean PM2.5 concentration values as major indicator to evaluate the exposure risk (Holloman et al 2004, Talbott et al 2014, Weber et al 2016, Lu et al 2019, Desouza et al 2019). However, application of mean PM2.5 concentration value ignores the hourly variation of PM2.5 exposure risk also leads to underestimation of its adverse health influences, when PM2.5 concentration is higher than the standards developed by WHO (Delfino et al 2002, Lin et al 2018). For example, daily mean concentration of PM2.5 is 25 µg m−3, while hourly PM2.5 concentration within this day might larger than 25 µg m−3. Applying daily mean concentration results in the underestimation of PM2.5 exposure risk. Therefore, hourly exceedance PM2.5 concentration should be a more effective predictor for assessment of PM2.5 public health risk, instead of the hourly mean value.
Populations are exposed to different levels of air pollution, which is partially attributed to different population mobility patterns. Population mobility patterns vary geographically due to the spatial distribution of residential and working zones, the selection of traffic modes, and social backgrounds. Therefore, population mobility patterns are not only associated with the PM2.5 exposure levels but also the adaptive measures (Kang et al 2013, Shi et al 2015a, Kwan and Schwanen 2016, Ma et al 2020). For example, houses with ventilation and filtration facilities protected the residents from the adverse effect of high PM2.5 exposure. Moreover, older people (>65 years old) are more vulnerable to high exposure of PM2.5( Vlachokostas et al 2014, Kioumourtzoglou et al 2015, Ben-David and Waring 2018, Barkjohn et al 2020). Thus, population mobility should be a major indicator to be considered in air pollution exposure risk assessment, instead of simply relying on air pollution monitoring data. However, improvement of air pollution assessment was limited due to the lack of spatial fine-grained population mobility data. Traditionally, survey data shows good spatial coverage; however, spatial and temporal resolution is low. Temporal scale of survey data is five year due to its large social and economic costs. This data is hard to obtain due to its confidentiality. Hence, hourly or daily air pollution assessment cannot be achieved. Big data, including social media data, such as Twitter, Wechat, or Weibo data, are defined as volunteered geographic information (VGI) data (Mennis and Guo 2009, Elwood et al 2012, Fan et al 2014). These data allow the platforms to record geographical information, when GPS-enabled smartphone users uses relative applications (Liu et al 2015; Song et al 2019; Yao et al 2017a). With the use of this type of data, investigations on hourly or daily air pollution exposure risk assessment can be conducted.
Thus, air pollution assessment solely using mean PM2.5 concentration data, without considering exceedance PM2.5 concentration and population mobility leads to underestimation of the PM2.5 health burden. Consequently, a more scientific indicator considering exceedance PM2.5 concentration and population mobility is defined called hourly exceedance PM2.5 exposure (HEPE). Furthermore, the net variation characteristics and daily cumulative variation results are also investigated in the highly urbanized area, Tianhe District. The findings from this study will help us gain new insights into air pollution assessment and help governors develop proper mitigation strategies.
2. Study area
Tianhe District is located between 23°6' N to 23°15' N and 113°16' E and 113°26' E (figure 1). As an economic and political center, more than 20% of the total gross domestic product and 10% of the population in Guangzhou is attributed to Tianhe District. Great economic development and population explosion results in significant energy demands, which lead to exacerbation of air pollution. As a consequence, annual mean PM2.5 is more than three times greater than the annual mean concentration standard set by the World Health Organization (WHO) (Organization 2006). Here, the population faces a public health threat due to heavy air pollution, particularly PM2.5. Therefore, detailed air pollution risk assessment methods should be developed to provide high spatiotemporal PM2.5 exposure variation results.

Figure 1. (A) Location of Tianhe District, (B) population mobility, and (C) elevation.
Download figure:
Standard image High-resolution image3. Data and methodology
3.1. Data
3.1.1. PM2.5 monitoring data
The hourly concentration of PM2.5 was collected from 11 monitoring stations on May 17, 2019. PM2.5 concentrations have been regularly monitored in these 11 monitoring stations, since 2014. Data quality control is carried out before analysis, with the invalid and missing values being delaminated. Data is provided by Guangdong Provincial Meteorological Bureau. PM2.5 concentration value is recorded every 5 min. Data used in our study is the mean value within one hour.
In this study, exceedance concentration of PM2.5( EP) is applied instead of mean concentration PM2.5 value. The EP is defined as the hourly PM2.5 concentration exceeding 25 µg m−3. For example, if the hourly PM2.5 concentration in one monitoring station is 40 µg m−3, then the EP value is 15 µg m−3. If hourly PM2.5 concentration value is less than 25 µg m−3, then the EP value is 0. The standard value of 25 µg m−3 is defined as the safe PM2.5 exposure level as per WHO (Organization 2006). In this study, EP is calculated based on the interpolated hourly PM2.5 data.
3.1.2. Population mobility data
In this study, hourly Tencent user density (TUD) dataset on May 17, 2019 obtained from the Tencent platform (www.qq.com) was used for population mobility data. The TUD dataset records the locations of smart phone users when they are checking in or checking out Tencent products, such as Wechat (social media chatting application), QQ (immediate message application), Tencent Map (mobile navigation software). In our study, TUD data recorded relative long-ins numbers per hour. As one of the largest social media platform providers, more than 93% of residents in Guangzhou are TUD creators. Four advantages were observed: (1) real-time performance: this data was obtained from the mobile platform with a high accuracy of geographic coordinates every hour. (2) High spatial resolution: the spatial resolution of the data was 25 m, which is larger than that of the common social media data, for example, the cellular signaling data (spatial resolution is 100–500 m) or check-in data of Wechat or Tencent (spatial resolution is 1000 m). (3) Large coverage area for the poplar used of Tencent applications. (4) Easy acquirement: Tencent provides specific ports for users to obtain this data. Therefore, the TUD dataset is widely acknowledged for population mobility related analysis, such as population dynamic mapping (Yao et al 2017a, Chen et al 2017b), rail transit ridership analysis (Li et al 2020), urban park visitors analysis(Chen et al 2018). Further, owing to its broadest coverage and high spatiotemporal resolution, it is used in this study.
3.1.3. Points of interest (POIs) data
In this study, POI data were provided by Baidu Map (https://map.baidu.com/). A total record of 65 671 points was collected. Six categories were included: catering, education and cultural, financial, medical, residential community, and transportation services. These data were applied to extract city functional zones (CFZs) to investigate the spatial association between PM2.5 exposure and CFZs.
3.2. Methodology
3.2.1. Spatial pattern detection method
Spatial distribution patterns of hourly exceedance PM2.5 was measured by using the standard deviation ellipse (SDE) method. Average center (AE) and standard distance of other points away from the AE are two calculated results obtained from this method. The AE describes the center location of PM2.5 concentration. A long diameter expresses the discretization of major directional distributions of PM2.5 concentration, while the short diameter represents the distribution range of the secondary directional distribution of PM2.5 concentration. A large difference between long diameter and short diameter represents a more evident directional distribution of PM2.5 concentration. In this study, the SDE method is applied to not only detect the directional distribution of PM2.5, but also determine the hourly moving trace of local PM2.5 concentration, as this trace cannot be revealed at a pixel level.
3.2.2. Exceedance exposure assessment
A novel indicator was developed to quantitatively address the HEPE. This indicator is calculated as follows:
where pmi represents the population mobility value of grid i obtained from TUD, n represents the number of grids within the study area, and EPi represents the exceedance PM2.5 exposure value. Six PM2.5 monitoring stations were located within the study area. We used PM2.5 data from 11 monitoring stations to conduct interpolation to obtain spatial distribution maps of EPi result. Then HEPE was calculated based on the EP result.
3.2.3. Exceedance exposure change detection
To address the change of exceedance exposure, two indicators were developed: (1) net variation of exceedance PM2.5 exposure (NEPE) and (2) daily cumulative variation of exceedance PM2.5 exposure (DCEPE). These two indicators are calculated as follows:

where  represents the HPE assessment result at analysis unit i at time t + 1 and
  represents the hourly exceedance PM2.5 exposure assessment result at analysis unit i at time t.
where NEPEi represents the net variation of exceedance PM2.5 exposure result at hour i.
3.2.4. CFZs extraction
In this study, a measure called POI density is applied to determine the CFZs. In this measure, the POI density is defined by the occurrence of a POI type in the neighborhood of a location relative to the occurrence of these POI types in the study area (Verburg et al 2004). This is calculated as follows:
where  characterizes the enrichment of type l POIs in type i neighborhood,
  represents the number of type l POIs in neighborhood i,
  represents the total number of POIs in neighborhood i,
  represents the total number of type l POIs in whole study area, and
  represents the total number of POIs in the study area.
3.2.5. Potential determining factor investigation
The mechanism driving the spatial distribution of DCEPE was investigated using bivariate LISA spatial autocorrelation. This method is used to detect the spatial patterns of two associated factors: DCEPE and CFZs. As shown in figure 2, four types of patterns were defined: High-High (H-H), Low-Low (L-L), High-Low (H-L), and Low-High (L-H) (Anselin 1993, 1995). H-H represents the increase of DCEPE and one type of CFZ. Therefore, this type of CFZ is defined as a potential determining factor.

Figure 2. Spatial association of DCEPE and CFZ.
Download figure:
Standard image High-resolution image4. Results
4.1. Temporal variation characteristics of exceedance air pollution
The temporal variation characteristics of PM2.5 concentrations at hourly levels is illustrated in figure 3. The linear regression model showed that PM2.5 concentration value increased with time; the slope was larger than 0.8. This indicated that PM2.5 concentrations within the study periods were higher in evening than in the morning. At hourly levels, the first exceedance PM2.5 concentration was observed at 10:00. Then, the PM2.5 concentration value was above 25.00 µg m−3. The lowest exceedance PM2.5 concentration was observed at 17:00, with a value of 0.25 µg m−3. The highest exceedance PM2.5 concentration was observed at 22:00, with a value of 14.09 µg m−3.
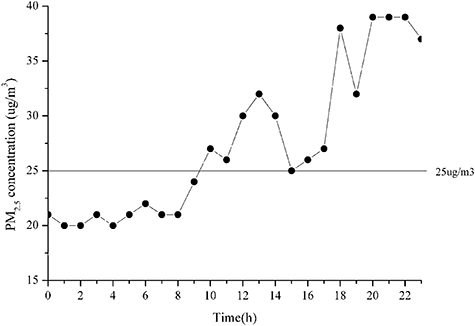
Figure 3. Temporal variation characteristics of PM2.5 concentration at hourly level in Tianhe District.
Download figure:
Standard image High-resolution image4.2. Spatial pattern of exceedance air pollution
Spatial variation characteristics in the AE and error ellipse of HEPE in Tianhe District is illustrated in figure 4. At 10:00, the AE was located in Yuangang Township, northwest of Tianhe District. At 23:00, the AE was located in Changxing Township, central west of Tianhe District. During this period, the AE moved southeast. This indicated that the west of the study area experienced more severe exceedance PM2.5 exposure than the east. The long and short diameters of the error ellipse characterized the spatial tendency. From 10:00 to 23:00, the long diameter decreased from 16.39 km to 10.81 km, whereas the short diameter increased from 1.12 km to 7.51 km. The decrease in the long diameter and increase in the short diameter indicated the uneven spatial variation of HEPE. The HEPE of the area outside the error ellipse increased faster than that inside the error ellipse. Moreover, the variation of the long and short diameters also implied that the major spatial tendency direction shifted from northeast-southwest to east-west. This showed that the HEPE variation during the study period was more affected by the eastern area of Tianhe District.
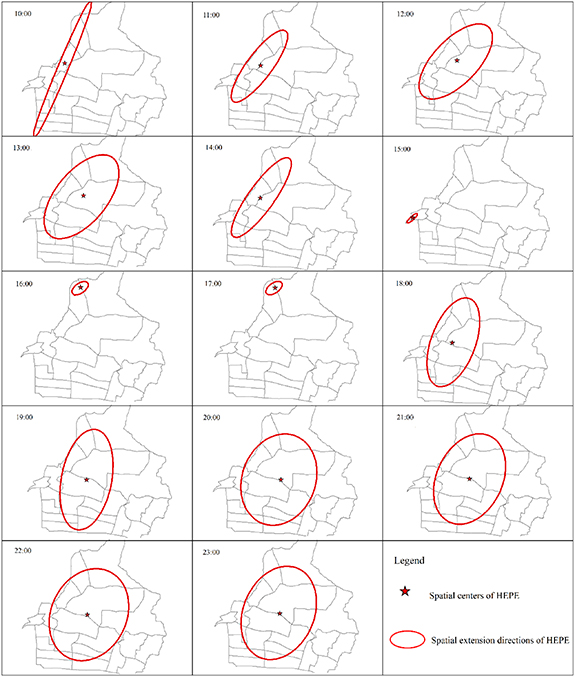
Figure 4. Spatial changes of HEPE centers and spatial expansion directions of HEPE in Tianhe District from 10:00 to 23:00 on May 17, 2019.
Download figure:
Standard image High-resolution image4.3. Exceedance air pollution exposure risk assessment
Temporal variation in net variation of exceedance PM2.5 exposure (NEPE), spatial distribution of daily mean of NEPE, DCEPE, and CFZs extraction results are illustrated in figure 5. As shown in figure 5 A, NEPE variation exhibited two peaks and two troughs. The first peak was observed at 13:00 with an NEPE value of 0.18, while the other one was observed at 21:00, with an NEPE value of 0.83. The two troughs were observed at 15:00 and at 19:00, respectively. The NEPE values at the two toughs were 0.00006 and 0.70, respectively.
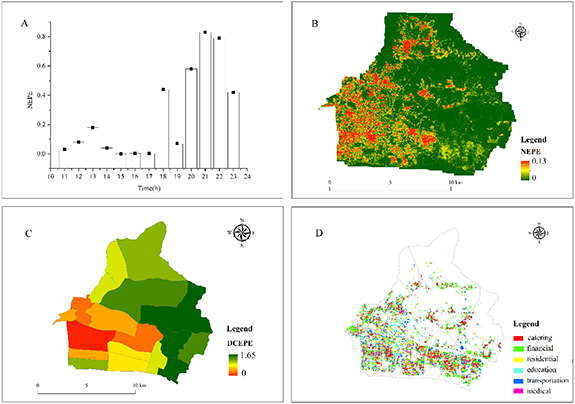
Figure 5. Temporal variation of NEPE and spatial distribution of NEPE, DCEPE, and CFZ.
Download figure:
Standard image High-resolution image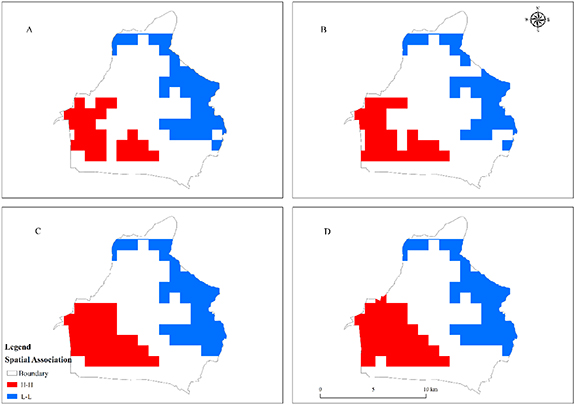
Figure 6. Spatial associations between different types of CFZ and DCEPE. A. Spatial association between catering services and DCEPE, B. spatial association between financial services and DCEPE, C. spatial association between living neighborhoods and DCEPE, and D. spatial association between transportation services and DCEPE.
Download figure:
Standard image High-resolution image
As showed in figure 5 B and C, spatial distribution of NEPE and DCEPE varied geographically. The daily mean of NEPE ranged from 0 to 0.13, whereas the DCEPE value ranged from 0 to 1.65. This indicated that the DCEPE was positive over the entire study area. We overlaid the township boundary and the DCEPE; high DCEPE areas were located in the west and central study area, including Xinghua Township, Shadong Township, Shahe Township, Wushan Township, Linhe Township, Tianhenan Township, Shipai Township, Tangxia Township, Tianyuan Township, and Yuancun Township. To validate the DCEPE results, we collected the respiratory disease mortality case data for these townships in 2015 from Guangdong Provincial Center for Disease Control and Prevention. Results showed that more than 36% of respiratory disease mortality cases were observed in the above townships.
To quantitatively validate the DCEPE results, the partial regression model was used, controlling population factor. Result showed that correlation coefficient between NEPE and mortality was 0.71. This indicated that the potential association between NEPE and mortality exits.
The spatial distribution of DCEPE led us to investigate the mechanism driving this phenomenon. Hence, we linked the CFZ and DCEPE results. As shown in figure 6, four types of CFZs dominated the spatial distribution of DCEPE, including catering services, financial services, residential neighborhoods, and transportation services. Two major types of spatial associations were detected: H-H and L-L. The areal percentage of H-H for catering services, financial services, residential neighborhoods, and transportation services accounted for 14.36%, 15.43%, 19.15%, and 20.74% of the study area, respectively. On the other hand, the areal percentage of L-L for catering services, financial services, residential neighborhoods, and transportation services accounted for 27.13%, 24.46%, 28.19%, and 27.66% of the study area, respectively. Therefore, spatial association was more evident between transportation services and DCEPE, followed by that for residential neighborhoods. This indicated that emissions from transportation and residential sectors may dominate the spatial distribution of DCEPE.
5. Discussion and conclusion
Increasing evidence has been demonstrated the adverse influence of air pollution on public health, for accelerating the progression of respiratory and cerebrovascular diseases (Friedman 2001, Leitte et al 2009, Liu et al 2017). Therefore, PM2.5 exposure risk assessment has attracted tremendous attentions. Various new data and new methods have been applied in this research field (Haikerwal et al 2015, Huang et al 2017, Shupler et al 2018, Vodonos et al 2018). However, the considering daily/hourly mean PM2.5 concentration and overlooking population mobility lead to underestimation of adverse effects of PM2.5. Therefore, by considering population mobility, we proposed two novel indicators: HEPE and DCEPE. Then, we analyzed the spatiotemporal variation characteristics of these indicators. Finally, the potential determining factors were detected using bivariate LISA. This helped us gain insights into the complex association between social activities and public health issues. This research is valuable in terms of two aspects: theoretical implications and management implications.
5.1. Theoretical implications
Compared with mean PM2.5 concentrations, HEPE and DCEPE have a few advantages. The temporal and cumulative variations of PM2.5 at hourly levels were fully considered. The health risk above the standard guided by WHO was also quantitatively addressed. Overall, the application of HEPE is more appropriate to evaluate the influences of environmental exposure on public health. This was also proved via conclusions from previous research, showing that a 500 μg m−3 increase in PM2.5 daily exceedance concentration hours at 3-day lags was associated with an increase of 4.55% in cardiovascular mortality (Lin et al 2017, 2018). Moreover, some studies attempted to investigate the health risk caused by exceedance PM2.5 using the daily highest PM2.5 concentration. However, overestimations of its adverse effects and lack of daily cumulative variation were not resolved. Instead of daily mean or daily peak PM2.5 concentrations, the use of the novel indicators can ensure reconsideration of the WHO air pollution exposure standard. Further, mitigation strategies developed based on the application of daily mean PM2.5 concentrations may impact the effectiveness of public health protection.
Moreover, here, population mobility data is also introduced in air pollution risk assessment research. Unlike previous related studies, PM2.5 exposure risk assessment considers population movement patterns using TUD data. Previous studies illustrated that similar PM2.5 exposure may also lead to differing health outcomes. This may account for the different social backgrounds of different population groups. Further, population mobility not only revealed the individual footprint but also related to the real-time PM2.5 exposure and adaption measures. For example, people with higher education levels or better economic backgrounds, they tend to take more adaptive measures to reduce the adverse influence of PM2.5, such as equipped with air cleaners. This kind of people usually work indoors. Indoor social media footprints were the most commonly observed. While low backgrounds or physical laborers usually work outdoors. Outdoor social media footprints were the most commonly observed. Therefore, population mobility should be considered in environmental exposure risk assessment research. In addition, social media data provides the means to investigate this issue, especially in China, which has the largest number of internet users. Social media data has been widely used in transportation planning, CFZs extraction, extreme temperature exposure risk assessment. This is its first use in exceedance PM2.5 exposure risk analysis. This research provides a method to couple environment exposure risk analysis with population mobility analysis. Unlike previous studies, population survey data is not used in this study. Compared with population survey data, TUD dataset reflects individual PM2.5 exposure risk level. In previous studies, the application of aggregated-level population data (population survey data) is under one assumption that population within one fixed geographical unit experience the same PM2.5 exposure concentration. However, air pollution usually varies over space and time within the same area. This results in errors of individual PM2.5 exposure risk assessment. Moreover, ignoring individual mobility generates the neighborhood effect averaging problems. Previous studies focused on long term PM2.5 exposure risk assessment, while multi-temporal assessment investigations are rarely seen. However, whether individual PM2.5 exposure at short-term or mid-term shows the similar characteristics is far from clear. TUD dataset is an assistant to couple with data used in previous studies for reflecting individual mobility at hourly level, daily level or annual level. However, the limitations of TUD should also be addressed. This type of geo-referred social media data are collected from smart phone users. However, some elders and children do not use smart phones. Therefore, use of these data can be regarded as a bias sampling of the total population dynamics distribution, as per some studies. However, TUD have been successfully used in pioneering studies on fine-scale population mapping (Yao et al 2017a) and rail transit ridership analysis (Li et al 2020). Thus, the application of TUD can reflect population mobility patterns; moreover, its application in environmental exposure risk assessment links public health and social issue analyses.
The application of TUD data is under one assumption that all TUD data recorded outdoor users' online footprints. Indoor and outdoor users' online footprint were all recorded in TUD data. However, people within constructions were exposed to lower exceedance PM2.5 exposure. HEPE and DCEPE were overestimated when all TUD data were considered. Therefore, this resulted in uncertainty. To reduce this uncertainty, urban construction information should be introduced into this kind of research. With this data, individual online footprint located within constructions are not considered. As a result, HEPE and DCEPE assessment are more accurate and precise.
Future challenges should be addressed here. In our study, HEPE and DCEPE were assessed with the coupling of air pollution monitoring data and social media data. Due to the spatial uneven of air pollution monitoring stations, we only conducted our research focusing on central downtown areas of Guangzhou. The amounts and spatial distribution of air pollution station is one major restriction to apply our methodology in rural areas. By applying of remote sensing technology, this barriers might be broken. However, the temporal resolution of remote sensing is usually larger than one day. Hourly variations of HEPE and DCEPE can also not be achieved. One good news is that China is developing air pollution monitoring networks. More automatic monitoring stations are constructing. With this development, we can transfer this challenge to one opportunity to introduce our methodology into more relative studies.
5.2. Management implications
Urbanization leads to large artificial land coverage and rapid economic development. Consequently, great energy demands and an overall increase in individual wealth. As a result, industrial consumption energy and vehicles increase. Air pollution emissions such as PM2.5, NOx, SO2, become public health as well as social concerns. Moreover, artificial land coverage accelerates the urban heat island effect, which prevents the dispersion of air pollution. Therefore, air pollution control measures are essential for both environmental protection and public health (Ding et al 2019). However, to the spatiotemporal details of implementing low cost air pollution control measures were still unclear. In this study, we extracted the spatial variation pattern of HEPE, and investigated potential determining factors. Our study showed that the AE of HEPE moved from the northwest to the center of the study area. The HEPE extending direction shifted from northeast-southwest to east-west, accounting for population mobility and CFZs. As Tianhe District is a mixed residential and working area, most people working in this area reside outside the area. During weekdays, workers travel to Tianhe District via individual vehicles or public transportation, especially after 10:00, which is the beginning of the work day. Heavy vehicle use releases PM2.5, increasing the public PM2.5 exposure risk. Related research showed that PM2.5 released from vehicles accounted for more than half of the total amount of PM2.5( Chan et al 1999, Gillies et al 2001, Vijayan and Kumar 2010, Anenberg et al 2017). During weekends, people travel to Tianhe District for commercial, catering, or leisure services. Among these services, catering services may release 2.5–9.6 times higher PM2.5 than other services (Li et al 2015). Thus, suitable PM2.5 control measures should be implemented in public service areas from the beginning of the work day, especially at transportation stations and eateries.
In this study, exceedance concentration of PM2.5( EP) was used instead of PM2.5 concentration. EP is calculated based on the daily concentration guideline by the WHO. Daily concentration guided by WHO is 25 µg m−3, while this guideline in China is 75 µg m−3. It is believed safety even with the daily PM2.5 concentration larger than 60 µg m−3 in China. However, as one heavy polluted area, public health in China is now still under threats. Most of the previous studies tended to assess PM2.5 exposure risk using daily mean concentration. One US study observed that each 10 μg m−3 increase in 2-day lagged PM2.5 was associated with 2.14% increase in mortality. This implies that daily PM2.5 concentration is not suitable for PM2.5 exposure risk assessment. EP is coupled with PM2.5 concentration guideline. With the development of this indicator, PM2.5 concentration guideline should be adjusted. Hourly variation of PM2.5 concentration can also be quantitatively measured. As new guideline developed, EP, HEPE and DCEPE mapping could provide guidelines for commuting, travelling, and the application of protective measures. For example, high risk area of HEPE and DCEPE reminds people wear masks or the utility of air cleaners. For urban planning, lower risk area of HEPE and DCEPE can be used as recreational entertainment places. Above all, the application of EP, HEPE and DCEPE provides two major management implications: (1) this promotes the adjustment of PM2.5 concentration guideline to further improve the exposure risk assessment. (2) Mapping of EP, HEPE and DCEPE provides suggestion for public commuting, protective measures application and urban planning.
5.3. Limitation and prospects
These methods are subject to certain limitations; constrained by the availability of population mobility data, HEPE and DCEPE on only one specific day were investigated. Long-term exposure of PM2.5, such as one year or longer, is supposed to have more influences on public health. With sufficient population mobility data, HEPE of one year or longer can be achieved. Therefore, the HEPE and DCEPE in different seasons or years should be discussed. Moreover, population mobility data used in this study does not provide individual characteristic information. Hence, personal vulnerability cannot be studied, which is essential for comprehensive study of environmental exposure risk assessment. Therefore, other types of social media data, such as cellular signaling data, which has individual characteristics information, should be used in such studies.
Acknowledgments
This study was supported by the National Natural Science Foundation of China (No. 41901219, No. 41671430, No. 41801326) and Key Special Project for Introduced Talents Team of Southern Marine Science and Engineering Guangdong Laboratory (Guangzhou) (No. GML2019ZD0301). The authors would like to thank the editor and the anonymous reviewers for their helpful comments and suggestions.
Declaration of Competing Interest
All the authors declare no financial and personal relationships with other people or organizations that can inappropriately influence the work. There are no professional or other personal interests of any nature or type in any product, service, and/or company that could be construed as influencing the position presented in, or the review of, the manuscript entitled, 'Exploring spatiotemporal variation characteristics of exceedance air pollution risk using social media big data.'
Data availability statement
The data that support the findings of this study are available upon reasonable request from the authors.