

Abstract
Plastic waste accumulating in the global ocean is an increasingly threatening environmental issue. To date, the floating and thus most visible fraction of ocean plastic pollution has been mapped at global scale. Yet, large knowledge gaps exist in our current understanding of the transport and transformation processes of positively buoyant plastic debris at the sea surface. Observations at sea typically report an apparent scarcity of microplastics (<5 mm) relative to the expected abundance-size distribution based on fragmentation of larger plastic objects. Here, we provide a comprehensive study on the relative abundance of microplastics (>500 µm) and mesoplastics (0.5–5 cm) in the surface waters of the eastern North Pacific Ocean using data from 1136 040 plastic fragments collected by 679 neuston trawl deployments between 2015 and 2019. Our results reveal that the apparent microplastic scarcity is not uniformly distributed across the region. Instead, we show that the relative abundance of floating microplastics increases from the outside to the inside of the North Pacific Garbage Patch. We hypothesize that this observation could be explained by (i) a spatially variable microplastic removal due to spatial differences in ocean productivity, (ii) a differential dispersal of micro- vs. mesoplastics with a preferential accumulation of microplastics in the subtropical gyre, and/or (iii) the timescales associated with transport and fragmentation of plastic objects at the ocean surface with older, more degraded, floating plastic accumulation in subtropical gyres. The results presented here highlight that global estimates of the accumulation and removal of positively buoyant microplastics need to consider spatial aspects such as variations in ocean productivity, the dominant physical transport processes in a given area, as well as the time needed for a plastic object to reach the specific offshore location.
Export citation and abstract BibTeX RIS

Original content from this work may be used under the terms of the Creative Commons Attribution 4.0 license. Any further distribution of this work must maintain attribution to the author(s) and the title of the work, journal citation and DOI.
1. Introduction
Each year, several million metric tons of mismanaged plastic waste are estimated to enter the ocean from coastal environments (Jambeck et al 2015, Lebreton et al 2017, Schmidt et al 2017). The long-term risks of ocean plastic pollution for marine ecosystems, fisheries and human health, however, remain largely unknown. Plastic objects discarded into the ocean either sink or float depending on their respective buoyancy. Roughly two third of the plastics produced annually consist of polymer types with a density lower than seawater (Geyer et al 2017) and hence initiate their journey floating at the surface of the ocean. The fate and transport of these positively buoyant plastic objects in the marine environment is highly influenced by oceanic currents, waves and wind (Van Sebille et al 2020). Beaching in coastal environments removes part of the floating debris from the sea surface relatively quickly after these objects have entered the ocean (Lebreton et al 2019, Olivelli et al 2020, Ryan 2020). The remaining floating plastic objects with a high buoyancy and durability such as thick polyethylene (PE) or polypropylene (PP), escape the coastal environment and are transported into the open ocean (Ryan 2015, Lebreton et al 2018). These plastic objects eventually accumulate at the sea surface of subtropical oceanic gyres where concentrations of floating plastic debris can exceed one million pieces per km2 for fragments >500 µm and hundreds of kilograms per km2( Cózar et al 2014, Eriksen et al 2014, Law et al 2014, van Sebille et al 2015, Lebreton et al 2018). Due to the large amounts of floating plastic debris present in their surface waters, the subtropical oceanic gyres have become known as ocean garbage patches.
Plastic objects accumulating in the surface ocean are fragmented into smaller particles due to mechanisms such as photo-degradation by UV radiation, mechanical abrasion and interactions with marine organisms (Andrady 2011, Dawson et al 2018). The observed size distribution of floating plastic debris collected at the sea surface, however, shows that millimeter-sized fragments are present in smaller concentrations than predicted by modelled fragmentation rates of larger debris (Eriksen et al 2014). This finding provided the first indications for a possible loss of floating microplastics from the surface waters (Cózar et al 2014), subsequently confirmed by the first observational evidence for the fallout of once-buoyant microplastics from the North Pacific Garbage Patch (NPGP; also known as the Great Pacific Garbage Patch) (Egger et al 2020). A possible removal mechanism for microplastics is the colonization by organisms (i.e. biofouling), which can reduce the buoyancy of small floating plastic fragments, eventually resulting in the sinking of initially positively buoyant debris towards the seabed (Zettler et al 2013, Fazey and Ryan 2016, Kaiser et al 2017, Kooi et al 2017). Buoyant microplastics can also be incorporated into marine snow (Porter et al 2018) and fecal pellets (Cole et al 2016, Wieczorek et al 2019), as well as form aggregates with marine biogenic particles (Long et al 2015, Michels et al 2018, Zhao et al 2018, de Haan et al 2019) and suspended inorganic particles (Besseling et al 2017), causing them to sink. Microplastics might further be transferred into deeper water layers through direct ingestion by vertically migrating marine organisms such as, for example, giant larvaceans (Katija et al 2017, Choy et al 2019), other zooplankton (Sun et al 2018, Wieczorek et al 2019) and mesopelagic fish (Boerger et al 2010, Choy and Drazen 2013, Lusher et al 2015). At present, however, these microplastic removal mechanisms remain largely unquantified. As a result, assessments of the fate of the missing positively buoyant plastic debris in the marine environment and of possible implications for the vertical transfer of particulate organic matter in the ocean remain challenging. The sinking flux of microplastics is mostly unconstrained in numerical models because of limited observational data (Kvale et al 2020), resulting in a current lack of understanding of the underlying physical, chemical and biological processes that influence the transport and accumulation of small plastic fragments on the surface of the ocean. Thus, for a better understanding of the dispersal and persistence of floating plastic debris in the surface ocean, a better characterization along with more quantitative data on the relative size distribution and types of plastic objects at the sea surface is needed.
In this study, we perform a large-scale spatial comparison of the relative size-abundance distribution of floating micro- and mesoplastic debris across the eastern North Pacific Ocean. Our results show that the apparent scarcity of floating microplastics typically reported by observations at sea is not uniformly distributed at the ocean surface, but instead shows distinct spatial heterogeneities
2. Materials and methods
2.1. Sampling
This study collated data from 679 neuston net trawls, completed during seven expeditions to the eastern North Pacific Ocean between 2015 and 2019 (figure 1, table 1). A total of 44 neuston net trawls were deployed during the implementation and monitoring phase of The Ocean Cleanup's System 001 ('Wilson') from September 2018 to January 2019 onboard the Maersk Launcher and Maersk Transporter. An additional 45 neuston trawls were completed during The Ocean Cleanup's North Pacific Mission 3 (NPM3) research expedition onboard the Maersk Transporter in November/December 2019. In all these expeditions, the neuston net was a Manta trawl (Ocean Instruments, Inc.) with a mouth area of 90 × 15 cm (width × height) and a square nylon net-mesh of 500 µm, and was deployed for 30–90 min at a towing speed of <2.5 knots. Sampled water volumes were estimated based on distance measurements from a mechanical flow meter (General Oceanics, Inc.) multiplied by the net mouth area. After each deployment, the net was rinsed from the outside with freshwater and the cod-end (333 µm mesh size) removed, sealed with staples, placed in individual zip-lock bags, wrapped in aluminum foil and stored frozen until further analysis in the onshore laboratory. A further 44 neuston trawl were collected during The Vortex Swim using the same Manta trawl as for the missions by The Ocean Cleanup. The Manta trawl was deployed for 30 min at a towing speed of ca. 1.5–2 knots. After each deployment, the net was rinsed from the outside with seawater and the cod-end (333 µm mesh size) removed. The collected samples were then transferred from the cod-end to a 333 µm mesh sieve, where plastic samples were separated from neuston biota. Plastic particles were subsequently hand-picked and stored frozen in 50 ml Falcon tubes until further analysis in the onshore laboratory.
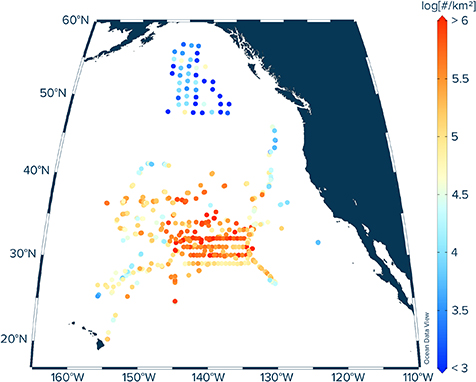
Figure 1. Neuston trawl deployment locations (n = 679) considered in this study and associated measured numerical concentrations of floating micro- and meso-plastic debris (i.e. 0.05–5 cm in size). See table 1 for details on expeditions and year of sampling.
Download figure:
Standard image High-resolution imageTable 1. Overview of the 679 neuston trawl deployments used in this study.
| Expedition | Year | Months | # trawls | # fragments | Reference |
|---|---|---|---|---|---|
| TOC Wilson Mission 1 | 2018 | Sept–Oct | 16 | 24 157 | This study |
| TOC Wilson Mission 2 | 2018 | Nov–Dec | 16 | 12 858 | (Egger et al 2020) |
| TOC Wilson Mission 3 | 2019 | Jan | 12 | 1 434 | This study |
| TOC NPM3 | 2019 | Nov–Dec | 45 | 19 377 | This study |
| The Vortex Swim | 2019 | Jun–Aug | 44 | 19 975 | This study |
| Gulf of Alaska Expedition | 2019 | Feb–March | 45 | 129 | This study |
| TOC Mega Expedition | 2015 | July–Sept | 501 | 1 058 110 | (Lebreton et al 2018) |
TOC = The Ocean Cleanup; NPM3 = North Pacific Mission 3. aThis study includes data from three additional Manta trawls (with a total of 979 plastic fragments), which were not included in the study by Egger et al( 2020).
Plastic debris in the surface waters of the Gulf of Alaska was sampled during the international Gulf of Alaska expedition in February/March 2019 onboard r/v Professor Kaganovskiy. Samples were collected using a neuston trawl (HydroBios) with a mouth area of 70 × 40 cm (width × height) and a square net-mesh of 300 µm. A total of 45 stations were sampled by deploying the neuston trawl for 15 min at vessel speeds <2.5 knots. Sampled water volumes were estimated using a mechanical flow meter (HydroBios). After each deployment, the net was carefully rinsed from the outside with seawater and its cod-end removed. The cod-end was gently washed with seawater above a 250 µm Nytex sieve in the onboard laboratory and the collected material transferred to a Whirl-Pak® bag and stored together with 25 ml of 37% formaldehyde for subsequent analyses in the onshore laboratory. Lastly, we included an additional 501 samples in our analyses that were collected during The Ocean Cleanup's Mega Expedition in 2015 (Lebreton et al 2018). These samples were taken using the same Manta trawl as for the other sampling campaigns by The Ocean Cleanup and by The Vortex Swim.
2.2. Sample processing
All trawled samples were analyzed in the laboratory of The Ocean Cleanup. The same procedure as described in (Lebreton et al 2018) was applied to enable comparability with previous sampling efforts in the eastern North Pacific Ocean. The content of each sample was washed into a stainless-steel sieve (500 µm square mesh, 29 cm diameter). The sieve was then placed separately into round aluminum tins (30 cm diameter) filled with filtered seawater (<1 µm) from the North Atlantic Ocean. Multiple LED torches were placed over the sieves from various angles to ensure good light conditions, which is particularly important for detecting small microplastics. Subsequently, floating objects and particles attached to biomass identified as buoyant anthropogenic debris according to the criteria described in (Hidalgo-Ruz et al 2012) were hand-picked using stainless-steel tweezers and their widest dimension was measured with a ruler. The picked particles were separated into the four size classes introduced in (Lebreton et al 2018): (I) 0.05–0.15 cm (small microplastics; 'Micro1'), (II) 0.15–0.5 cm (large microplastics; 'Micro2'), (III) 0.5–1.5 cm (small mesoplastics; 'Meso1'), and (IV) 1.5–5 cm (large mesoplastics; 'Meso2'), respectively (table 2). Each particle was further classified and tallied into one of the following type categories after (Lebreton et al 2018): (1) 'H-type' for fragments and objects made of hard plastic, plastic sheet or film; (2) 'N-type' for fragments of plastic lines, ropes, and fishing nets; (3) 'P-type' for pre-production plastic pellets in the shape of a cylinder, disk or sphere; and (4) 'F-type' for fragments or objects made of foamed material (table 2). Once counted and categorized, the plastic objects were washed with water purified by reverse osmosis, transferred to aluminum dishes, dried at 60 °C for 3 h, and weighed using an OHAUS Explorer EX324M scale (0.0001 g readability). The numerical and mass concentrations of plastic items measured by each net tow were corrected for wind-induced turbulent mixing (Kukulka et al 2012) (see supporting information (SI) for calculations). Measures taken to minimize contamination during sampling and sample processing are described in the SI. Considering that microplastic fragments >500 µm are still visible and recognizable to the naked eye using good light conditions and that plastic microfibers were not part of the scope of our study, it is unlikely that a significant fraction of microplastic was missed using the methods applied here.
Table 2. Plastic size classes and type categories used in this study (after Lebreton et al 2018).
| Size class | Size range | Abbreviation |
|---|---|---|
| Small microplastics | 0.05–0.15 cm | Micro1 |
| Large microplastics | 0.15–0.5 cm | Micro2 |
| Small mesoplastics | 0.5–1.5 cm | Meso1 |
| Large mesoplastics | 1.5–5 cm | Meso2 |
| Plastic type | Abbreviation | |
| Fragments and objects made of hard plastic, plastic sheet or film | H-type | |
| Fragments of plastic lines, ropes, and fishing nets | N-type | |
| Pre-production plastic pellets in the shape of a cylinder, disk or sphere | P-type | |
| Fragments or objects made of foamed material (e.g. expanded polystyrene) | F-type | |
2.3. Fragmentation model
The number of fragments generated from the fragmentation of a plastic object of a given size can be approximated by a numerical model. Here we use the model developed by (Cózar et al 2014). Cózar and co-workers demonstrated that in steady state (a stable input and fragmentation of larger plastic objects) the abundance-size distribution of plastic fragments should follow a power law increase with decreasing fragment size and with a scaling exponent of 3 (equal to the spatial dimension of the initial plastic object):

With the length of the fragment (in mm) computed from the volume of the plastic object (in mm3):
Accordingly, the modelled fragmentation-derived abundance-size distribution depends only on the volume of the plastic object, being independent of the object shape (see Cózar et al 2014 for a more detailed description) (figure 2(a)).
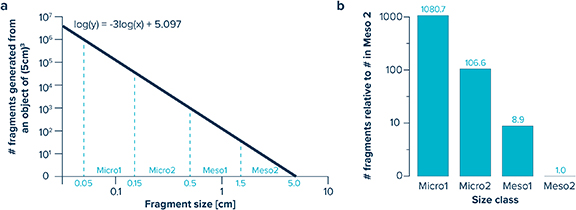
Figure 2. (a) Numbers of fragments generated from a plastic object of 125 cm3( 5 × 5 × 5 cm) based on the fragmentation model developed by Cózar et al( 2014), assuming a closed system in steady-state. (b) Modelled numerical distribution of the sum of particles generated in the Micro1 (0.05–0.15 cm), Micro2 (0.15–0.5 cm) and Meso1 (0.5–1.5 cm) size classes relative to the number of particles in the Meso 2 (1.5–5 cm) size class. In a closed system that has reached steady-state, the number of fragments present in each size class is predicted to increase by approximately one order of magnitude with each decreasing size step.
Download figure:
Standard image High-resolution image3. Results and discussion
3.1. Spatial and relative size-abundance distributions
This study explores the spatial distribution and relative size abundance of 1 136 040 plastic fragments collected afloat in the eastern North Pacific Ocean by 679 neuston trawl deployments (table 1). Analyzing a subset of 376 particles using Raman and Fourier transform infrared spectroscopy revealed that the polymer composition of the collected plastic fragments was dominated by PE and PP, accounting for 69% and 23% of the analyzed particles, respectively (table S1 (available online at stacks.iop.org/ERL/15/114056/mmedia)).
The fragmentation model applied in this study predicts that in a system that has reached steady-state, i.e. where the relative size abundance of plastic fragments is in equilibrium with the input of larger plastic objects, the expected number of fragments should increase by about one order of magnitude with each decreasing size step from large mesoplastics to small microplastics (i.e. from Meso2 to Meso1, Micro2 and Micro1) (figure 2(b)).
The number of plastic fragments observed in the Meso1 and Micro2 size classes generally fall within an order of magnitude of the expected steady-state values based on the amount of plastic debris present in the Meso2 size class (figure 3). Floating microplastics in the Micro1 size class, on the other hand, are mostly present in smaller quantities than expected based on the modelled steady-state size-abundance distribution across our study area. Comparing the relative size abundance of plastic fragments for surface waters outside the NPGP (Area A), the edge of the NPGP (Area B) and inside the NPGP (Area C) separately reveals distinct regional differences in the mismatch between the observed and expected abundance-size distribution. For samples collected from outside the NPGP (Area A), observed numerical concentrations in the Micro1, Micro2 and Meso1 size classes are 7.5, 4.5 and 1.4 times higher than in the Meso2 size class (figure 4, table S2). In surface waters of the NPGP edge (Area B), the number of plastic fragments in the Micro1, Micro2 and Meso1 size class are 83.7, 47.2, and 5.4 times higher than in the Meso2 size class. Inside the NPGP (Area C), numerical concentrations are 117.3, 88.2 and 8.9 times higher in the Micro1, Micro2 and Meso1 size class than in the Meso2 size class. Thus, the observed numerical plastic concentrations outside the NPGP are lower than expected from the concentrations of Meso2 debris for all three smaller size classes. At the edge of the NPGP, the expected amount of Meso1 debris falls within the 75th percentile of the observed concentrations. In addition, measured concentrations of Micro1 and Micro2 debris have median values closer to the modelled steady-state values. Inside the NPGP, the observed relative abundances of Micro2 and Meso1 debris are in good agreement with the expected steady-state abundance-size distribution, yet small microplastics (Micro1) remain underrepresented. Plastic types H (hard fragments) and N (lines, ropes and fishing nets) are the dominant debris types in all regions, accounting for >95% of the number of collected plastic fragments. Plastic pellets (type P) account for between 1%–4% of the number of floating plastic items across the region. Foamed plastics (type F) contribute to 1.5%–3.5% of the number of floating plastic debris items in samples from outside the NPGP and to <1% in samples from the NPGP, respectively.
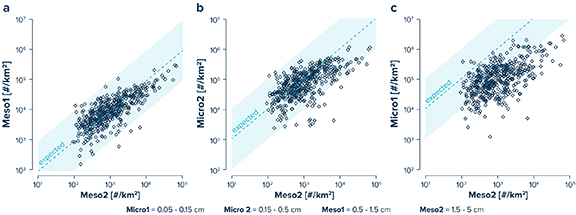
Figure 3. Observed correlations of numerical concentrations of floating plastic debris in the (a) Meso1 (0.5–1.5 cm), (b) Micro2 (0.15–0.5 cm), and (c) Micro1 (0.05–0.15 cm) size classes vs. the Meso2 (1.5–5 cm) size class. The dashed line represents the expected ratio based on the modelled steady-state size-abundance distribution (figure 2). The shaded areas indicate the ± one order of magnitude range from the expected distribution ratios.
Download figure:
Standard image High-resolution image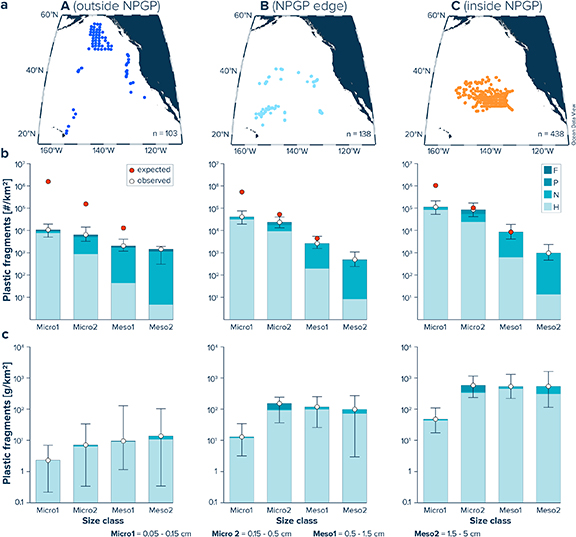
Figure 4. (a) Neuston trawl locations outside the NPGP (Area A), on the NPGP edge (Area B) and inside the NPGP (Area C), and C. (b) Numerical and (c) mass concentrations for different size (bars) and type (colors) classes for Areas A–C. For reference to plastic type and size classes, the reader is referred to table 2. White dots represent median values. Whiskers extend from the 25th to the 75th percentile. Red dots in (b) represent the steady-state values expected based on the fragmentation of the number of particles in the Meso2 size class (see figure 2).
Download figure:
Standard image High-resolution imageThe observed mass distribution of collected plastic fragments shows an inverse trend relative to the numerical abundance, with the lowest mass concentrations associated with the smallest size class (figure 4(c)). Across all three Areas (A–C), H-type plastic fragments contribute the most (>90%) to floating micro- and mesoplastic mass. We further observe that the average particle weight of the collected plastic fragments increases from the outside to the inside of the NPGP (figure S1). The trend in increasing particle weight towards the gyre appears to be generally present across all types of plastic fragments.
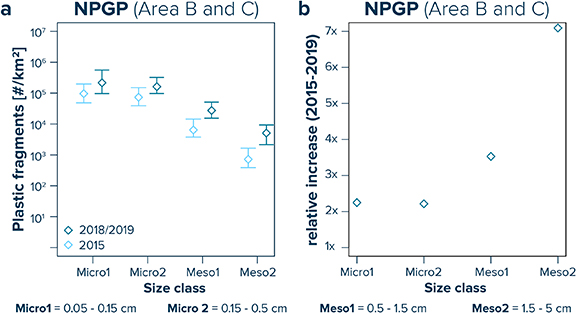
Lastly, our data indicate a temporal shift in size classes of plastic debris, with a higher relative increase in the amount of mesoplastic debris afloat in the NPGP compared to the measured increase in microplastic debris for samples collected in 2015 vs. 2018/2019 (figure 5). While observed numerical concentrations of mesoplastics seem to have increased by a factor of 3.5 (Meso1) and 7.1 (Meso2) between 2015 and 2018/2019, median numerical concentrations of microplastics (Micro1 and Micro2) indicate an increase by a factor of 2.2 only.
Figure 5. (a) Observed numerical plastic concentrations for samples collected from the North Pacific Garbage Patch (NPGP; i.e. Areas B and C). Light blue diamonds represent median values for samples taken in 2015, while dark blue diamonds refer to median values for samples collected in 2018/2019. Whiskers extend from the 25th to the 75th percentile. (b) Relative increase factor of median observed numerical concentrations per size class between samples collected in 2015 and 2018/2019.
Download figure:
Standard image High-resolution image
3.2. Spatially variable 'microplastic gap'
Consistent with previous studies (Cózar et al 2014, Eriksen et al 2014, van Sebille et al 2015), we find that concentrations of small microplastics (Micro1) are lower than expected based on modelled fragmentation of mesoplastic debris across the eastern North Pacific Ocean. However, our results reveal that this mismatch between expected and observed microplastic concentrations is highest in areas with low concentrations of floating plastic debris and that it is lower for areas with high amounts of floating plastic debris. Our results thus indicate that the accumulation and/or removal of microplastic fragments in the surface ocean show spatial differences between the center and the margins of subtropical oceanic gyres. Importantly, our data show that the relative abundance-size distribution of microplastics at the ocean surface approaches values closer to the expected equilibrium (i.e. steady-state) distribution in high accumulation areas such as the NPGP. This could be explained by (i) lower removal rates of positively buoyant microplastics in the center of subtropical oceanic gyres compared to the gyre margins, (ii) a preferential accumulation of small plastic fragments in the subtropical gyres, or (iii) the timescales associated with transport and fragmentation of plastic objects at the ocean surface. These three potential mechanisms for the observed abundance-size distribution are discussed below.
3.3. Microplastics removal and ocean productivity
Many of the removal mechanisms for initially positively buoyant microplastics, such as direct transport by vertically migrating organisms, biofouling, incorporation into sinking fecal pellets, entrainment or adsorption to marine snow, as well as aggregation with marine biogenic particles, are directly linked to the abundance and activity of marine organisms. Thus, microplastic removal could be more prevalent in systems with higher productivity (Fazey and Ryan 2016, Kaiser et al 2017).
Nutrient-rich surface waters in the margins of the eastern North Pacific Ocean exhibit high marine productivity, while the oligotrophic waters in the NPGP are characterized by low marine productivity, as observed by satellite-derived estimates of mean annual sea-surface chlorophyll a concentrations in the region (figure S2). By implication, if the removal of floating microplastics is linked to the activity of marine organisms, areas with higher marine productivity should have a more pronounced gap in the observed size distribution of floating microplastics. This hypothesis is supported by our observed lower relative abundance of floating microplastics along the gyre margins compared to the NPGP. However, to assess more accurately the relationship between ocean productivity and microplastic removal at the ocean surface, a better understanding of the biologically mediated sinking mechanisms is needed. At present, large knowledge gaps in the vertical transport of positively buoyant microplastics still remain. Our results highlight the need for more in-situ measurements of water column profiles and vertical fluxes of plastic particles across marine ecosystems with a range of biological productivity levels, as well as for the identification of the processes and carrier phases by which floating microplastic fragments are transported towards deeper water depths.
3.4. Differential dispersal for micro- and mesoplastic fragments
Plastic items afloat at sea are subject to wind-induced turbulent mixing (Kukulka et al 2012). This mixing and subsequent upward motion results in a vertical distribution of positively buoyant plastic particles within the upper water column, with mesoplastics drifting at shallower water layers than microplastics due to higher terminal rising velocities of larger plastics (Reisser et al 2015, Kooi et al 2016, Lebreton et al 2018). Given that the Stokes drift (a net drift velocity in the direction of wave propagation) in the upper layers is faster than in deeper layers, mesoplastics are likely to be carried faster by Stokes drift than microplastics (Isobe et al 2014). Consequently, rather than controlled by different rates of (biological) microplastic removal, the spatial heterogeneities in the observed microplastic abundance-size distribution observed here could also be explained by different physical transport mechanisms dominating the oceanic dispersal of positively buoyant micro- vs. mesoplastic particles, with the latter potentially being more influenced by open ocean Stokes drift. Such a selective transport for the two different size classes has been suggested for coastal waters, where larger and thus more buoyant plastics appear selectively trapped on the coastlines by the effect of the Stokes drift (Isobe et al 2014, Pedrotti et al 2016). Faster fragmentation of beached mesoplastics subsequently results in high relative abundances of microplastics in surface waters within short distances (∼1 km) from the coast (Isobe et al 2014, Pedrotti et al 2016). Our results, however, reveal that these elevated relative concentrations of microplastics appear not only restricted to the nearshore environment as shown by (Pedrotti et al 2016), but that the relative microplastic abundance increases again in the subtropical oceanic gyres.
To verify the proposed hypothesis of a preferential accumulation of small microplastics in ocean garbage patches, numerical models simulating the dispersal of floating plastic debris in the ocean will need to include a particle size dependent Stokes drift formulation. At present, these model parameters are difficult to constrain due to the limited observational and experimental data available. More standardized measurements for the abundance-size distribution of floating plastic debris are urgently needed, particularly for understudied regions beyond subtropical oceanic gyres. Such data is crucial for calibration and validation of global plastic dispersal models.
3.5. Non-steady-state abundance-size distribution
The third possible explanation for the apparent mismatch between the observed and modelled abundance-size distribution of small plastic fragments at the ocean surface is that the distribution of plastic mass per size class has not yet reached equilibrium. Large uncertainties remain in our understanding of how floating plastic debris is fragmented into micro- and nano-sized particles. It is therefore possible that due to relatively low rates of fragmentation of floating plastic debris in the surface ocean (Andrady 2011), small microplastics could still be in the process of formation but may continue to remain underrepresented as exponentially increasing emissions of larger plastic debris items into the ocean (Jambeck et al 2015) overwhelm degradation rates in the marine environment. In this study, we observe indications for a higher increase in mesoplastic concentrations in the NPGP between 2015 and 2019 than in microplastic concentrations for the same period (figure 5). As a result, the relative abundance of microplastics appears to have shifted further away from the expected steady-state distribution between 2015 and 2018/2019. This observation is in line with the postulated non-steady-state hypothesis. However, given the large spatiotemporal variability in plastic concentrations at the ocean surface (Law et al 2014), the significance of these temporal shift remains uncertain.
Dispersal models indicate that floating debris released from terrestrial sources could require on average a minimum of several years to reach subtropical oceanic gyres (Lebreton et al 2012, Maximenko et al 2012). Hence, there could be a significant time interval, on the order of several years to decades, between terrestrial emissions and representative accumulation of positively buoyant plastic debris in offshore waters (Lebreton et al 2019). Consequently, floating plastic debris accumulating in subtropical oceanic gyres is typically older and more degraded (Martí et al 2020), while most of the recent mesoplastic debris discarded into the marine environment is likely still circulating in surface waters of the coastal margins (Lebreton et al 2019, Olivelli et al 2020).
Our observed increase in average particle weight towards the NPGP could indeed indicate higher levels of weathering, thus suggesting that plastic particles in the NPGP likely have been afloat in the ocean for a longer period of time. The timescales associated with transport and fragmentation of buoyant plastic objects at the ocean surface could therefore result in the higher relative abundance of floating microplastics in surface waters of subtropical oceanic gyres as observed in this study. However, determination of fragmentation rates of positively buoyant plastic objects under in-situ conditions and development of analytical methods to age plastics of various sizes accumulating at the ocean surface are needed to further assess a potential disequilibrium in the relative abundance-size distribution of plastic debris afloat in offshore waters.
3.6. General discussion and implications
The relative abundance-size distribution of floating plastic debris in the eastern North Pacific Ocean reveals important insights into the transport, accumulation and removal of microplastic fragments in the surface ocean. Our results reveal that the apparent scarcity of microplastics at the sea surface is not equally distributed across the eastern North Pacific Ocean. Instead, we show that the relative abundance of microplastics vs. mesoplastics increases from surface waters with low concentrations of floating plastic debris, such as the Gulf of Alaska, towards surface waters in the NPGP. The spatial patterns of the microplastic/mesoplastic abundance ratios observed here could be explained by a spatially variable microplastic removal, a differential dispersal of floating micro- vs. mesoplastics, a non-steady-state abundance-size distribution, or by a combination of these processes. At present, it remains unclear whether the missing microplastic mass has sunk into deeper water layers, beached onto shorelines, been ingested by marine organisms, been converted into nanoplastics through accelerated fragmentation, or whether it has not formed yet (i.e. is still part of the mesoplastic debris mass). To resolve this, more data on the time required for the formation of micro- and nanoplastics of second origin, as well as the different transport mechanisms influencing the lateral and vertical dispersal dynamics of positively buoyant microplastics are needed.
Our results suggest that global estimates of the accumulation and removal of positively buoyant microplastics need to consider spatial aspects such as variations in ocean productivity, the dominant physical transport processes in a given area, as well as the distance to plastic emission sources (i.e. the time needed for a plastic object to reach the specific offshore location). Furthermore, the results presented here highlight the need to implement individual parameterizations for micro- and mesoplastic items in numerical models simulating the horizontal and vertical dispersal of floating plastic debris.
Acknowledgments
The authors thank The Ocean Cleanup donors who helped fund this research, as well as captain Alexander Pakker and his crew of the r/v Professor Kaganovskiy, and the captains and crew of the Maersk Transporter and the Maersk Launcher. We are further grateful to Fatimah Sulu-Gambari, Liliya Khatmullina and the crew of The Vortex Swim for assistance with sample collection and analysis, and to Boyan Slat for stimulating discussions. HydroBios is acknowledged for the technical and logistical support during the 2019 Gulf of Alaska Expedition. We also thank Mark de Boer and the Zoo of Rotterdam (Diergaarde Blijdorp) for providing access to their marine laboratory facilities and for support with sample analyses.
Data availability statement
All data that support the findings of this study are included within the article (and any supplementary information files).
Funding sources
This work was funded by the donors of The Ocean Cleanup Foundation.
Author contributions
M E and L L designed the study. M E, S J R, A C M, G A K, V I R, E A P and B P V H collected the samples. M E, R N, G L and L Q analyzed the samples. M E conducted the data analyses and the calculations, and prepared figures and tables. M E wrote the manuscript with contributions from L L. All authors reviewed the manuscript.