

Abstract
Volatile organic compounds (VOCs) play an essential role in climate change and air pollution by modulating tropospheric oxidation capacity and providing precursors for ozone and aerosol formation. Arctic permafrost buries large quantities of frozen soil carbon, which could be released as VOCs with permafrost thawing or collapsing as a consequence of global warming. However, due to the lack of reported studies in this field and the limited capability of the conventional measurement techniques, it is poorly understood how much VOCs could be emitted from thawing permafrost and the chemical speciation of the released VOCs. Here we apply a Vocus proton-transfer-reaction time-of-flight mass spectrometer (PTR-TOF) in laboratory incubations for the first time to examine the release of VOCs from thawing permafrost peatland soils sampled from Finnish Lapland. The warming-induced rapid VOC emissions from the thawing soils were mainly attributed to the direct release of old, trapped gases from the permafrost. The average VOC fluxes from thawing permafrost were four times as high as those from the active layer (the top layer of soil in permafrost terrain). The emissions of less volatile compounds, i.e. sesquiterpenes and diterpenes, increased substantially with rising temperatures. Results in this study demonstrate the potential for substantive VOC releases from thawing permafrost. We anticipate that future global warming could stimulate VOC emissions from the Arctic permafrost, which may significantly influence the Arctic atmospheric chemistry and climate change.
Export citation and abstract BibTeX RIS

Original content from this work may be used under the terms of the Creative Commons Attribution 4.0 license. Any further distribution of this work must maintain attribution to the author(s) and the title of the work, journal citation and DOI.
1. Introduction
Volatile organic compounds (VOCs) are ubiquitous gaseous constituents in the atmosphere originating from anthropogenic and natural sources (Kesselmeier et al, 1999, Friedrich et al, 1999). As a key precursor of tropospheric ozone and aerosol formation, VOCs significantly impact air quality and climate change. In the atmosphere, VOCs undergo a sequence of oxidative chemical processes and yield various oxidation products (Donahue et al 2012). Their condensable low-volatility oxidation products can largely enhance the formation and growth of secondary organic aerosols (Hallquist et al 2009, Ehn et al 2014, Bianchi et al 2016, Kirkby et al 2016), which further affect the Earth's radiation balance by scattering solar radiation and acting as cloud condensation nuclei (Maria et al 2004). In remote areas where anthropogenic influences are mostly small to negligible, VOC emissions from natural sources may play crucial roles in atmospheric processes.
Northern hemisphere permafrost soils contain 1460–1600 Pg organic carbon, almost twice the carbon in the atmosphere (Tarnocai et al 2009, Hugelius et al 2014). With the amplified warming in Arctic areas (double the rate of global average), permafrost thawing exposes this currently frozen organic carbon storage to microbial decomposition and hence leads to substantial releases of gaseous carbon. According to the Representative Concentration Pathway 8.5 (Collins et al 2013), the Arctic air temperature is projected to increase by 8.3 °C (±1.9 °C) in 2081–2100 compared with the temperature levels in 1986–2005. Under this high emission scenario, the average soil warming at 1 m depth in permafrost region is predicted to be +7 °C by 2100 (Lawrence et al 2015). The impact of thawing permafrost on carbon dioxide (CO2) and methane (CH4) emissions has been extensively studied and evaluated (Schädel et al 2016, Knoblauch et al 2018, Natali et al 2019). However, VOC emissions from carbon-rich permafrost soils, which have been rarely examined, could be potent but overlooked sources in the Arctic. This is a critical knowledge gap given that VOC emissions from thawing permafrost may cause important climate feedbacks, especially in the Arctic, where anthropogenic sources are weak and aboveground vegetation is scarce.
Upon permafrost thawing, organic vapors can be released directly from the trapped gases accumulated in the permafrost or via post-thaw microbial breakdown of soil organic matter (SOM) (Tang et al 2019). Till now, only two reports on VOC release from permafrost soils have been published (Kramshøj et al 2018, 2019). These studies have demonstrated that under aerobic conditions, the active layer microbiota would largely consume the VOC emissions from thawing permafrost and prevent their entrance to the air (Kramshøj et al 2018). However, in water-saturated thawing soils, anaerobic conditions slow down the microbial VOC consumption and may thus enable the release of volatile compounds into the atmosphere. When the ice-rich frozen ground thaws and collapses, thermokarst lakes or collapse fens form. Water-saturated and anaerobic conditions are expected in these landscape features. The amount and extent of thermokarst landforms are becoming more widespread due to the ongoing climate warming (Sannel et al, 2011, Olefeldt et al 2016). Even in upland permafrost regions where large scale soil drying may occur, the perched water table and saturated conditions may be maintained as a results of localized ground subsidence (Lawrence et al 2015). Furthermore, VOC releases upon permafrost thawing can be in direct contact with the atmosphere due to soil erosion, i.e. coastal erosion or retrogressive thaw slumps (Vonk et al 2012, Lewkowicz et al, 2019). In addition, due to the instrumental limitation of the existing studies, it remains unclear if less volatile compounds can be released from thawing permafrost. While less volatile compounds generally exist in smaller amounts than highly volatile species, they may play more important roles in atmospheric chemistry due to their lower volatility, probably higher reactivity and higher aerosol yield (Jaoui et al 2013). Therefore, a better understanding is urgently needed for the poorly characterized thawing permafrost as the potential source of VOC emissions.
To assess the impact of permafrost thaw on VOC emissions and enhance understanding of the present and future VOC release from permafrost regions, we incubated peat soil samples in a dynamic flow-through system and quantified the released VOC compounds using a Vocus proton-transfer-reaction time-of-flight mass spectrometer (PTR-TOF). Due to the significantly improved measurement precision and detection efficiency, the Vocus PTR-TOF allows measurements of a broader spectrum of organic vapors compared to conventional PTR instruments (Krechmer et al 2018). Particularly, larger hydrocarbons and oxygenated molecules which are present in small concentrations can be characterized by this mass spectrometer (Riva et al 2019, Li et al 2020). The temperature-dependency of VOC emissions was examined by sequentially increasing the temperature inside a climate-controlled growth chamber. We also complemented our observations with continuous measurements of CH4 as well as soil property analysis. We hypothesize that permafrost thawing will induce high VOC emissions from the unlocked soil carbon. Specifically, we expect higher emission rates of less volatile compounds with rising temperature.
2. Methods
2.1. Study site
The frozen peat and active layer soils were collected in early September 2019 from a palsa mire (Kevo, 68°53'N, 21°03'E), located in the sporadic permafrost zone of Finnish Lapland. The peatland was characterized by isolated permafrost mounds (palsas) a few meters high and surrounded by wet flarks (Zhang et al 2018). Collapse features are common along the palsa edges. The climate of the Kevo area is subarctic and relatively continental (Drebs et al 2002). The Kevo research station permafrost monitoring site reported a mean annual ground temperature of −0.2 °C and a mean annual air temperature of −1.0 °C during 2008–2009 (Christiansen et al 2010). The active layer thickness was ca. 60 cm. Borehole measurements revealed existence of warm permafrost close to 0 °C in this region, making it highly sensitive to climate change (Christiansen et al 2010). According to long-term observations of up to 65 yr, the mean annual air temperature in Kevo has shown a statistically increasing trend of +0.4 °C/decade (Merkouriadi et al 2017).
The vegetation at the site is dominated by dwarf shrubs, such as Empetrum nigrum ssp. hermaphroditum, Vaccinium vitis-idaea, Betula nana and Rhododendron tomentosum and lichens and bryophytes (Cladonia spp. and Dicranum sp.). Patches of bare peat occur on top of the palsa mounds.
2.2. Collection of permafrost and active layer soils
The permafrost soils were sampled by hammering down a steel pipe with an inner diameter of 30 mm into the permafrost and pushing out the frozen core with a wooden rod. For permafrost samples, a 10 cm-long section from around 100–110 cm depth was collected and kept frozen throughout the transportation to Helsinki for further analysis. In Helsinki, the samples were stored in a freezer at −20 °C until the start of analysis.
For the active layer samples, a 50 cm-long section was collected from the active layer using a box corer. In the laboratory in Helsinki, the layer extending from ∼15 cm to ∼25 cm depth was chosen for further comparison measurements and stored in the freezer (−20 °C).
The permafrost and active layer samples in this study came from a single palsa. Three frozen peat replicates of the same core, P1, P2, and P3, from around 100–110 cm depth were used for the permafrost peat property analysis, while four active layer replicates of the same core, AL1, AL2, AL3, and AL4, from around 15–25 cm depth were used to study active layer peat properties. Sample masses are provided in table S1.
2.3. Experimental setup
The schematic figure of the experimental setup is provided in figure S1 (https://stacks.iop.org/ERL/15/104097/mmedia). The experiments were performed in a climate-controlled chamber with a stainless steel interior (Aralab FitoClima D1200; internal dimensions (H × W × D) (mm): 1330 × 600 × 680), providing constant air temperature and the ability to regulate humidity and light level. Lights were off during the whole experiment to mimic natural soil conditions. Inside the chamber, soil samples were placed in 500 ml glass jars sealed with PTFE-coated screw caps. The glass jars and caps were carefully cleaned with Milli-Q water before the experiments. To assess the response of VOC release to temperature increase, the incubation temperature cycle for each sample was set as follows: 0 °C for 18 h, raised to 5 °C for 48 h, and then further increased to 15 °C for another 48 h.
VOC fluxes from soil samples were measured through a dynamic flow-through system. Ambient air was pressurized and passed through a zero-air generator (Parker Balzon HPZA-3500-220). A flow of 0.8 L min−1 set and monitored by a mass flow controller was then fed into the glass jar through a PTFE tubing (6 mm o.d., 4 mm i.d.). Finally, the sample flow from the glass jar was passed to the instrument using the same size of PTFE tubing and an overflow exhaust through T-connectors. To reduce evapotranspiratory losses from the soils, the inflow air was humidified through a bubbler before feeding to the glass jar. The experimental setup included an empty jar that contained no soil sample. Empty jar measurements were conducted before and after the experiments as blank samples to account for potential VOC contamination from the materials used or zero air.
Exactly the same procedures were applied to all experiments.
2.4. Measurements and quantification of VOC fluxes
A Vocus PTR-TOF (Tofwerk AG/Aerodyne Research Inc.) was deployed to quantify the VOC fluxes from soil samples. The PTR instruments have been widely used to measure most VOCs in air. Compared with traditional PTR instruments, the Vocus PTR-TOF implements an enhanced inlet and source design and minimizes contact between analyte molecules and inlet/source walls, enabling detection of semi- and low-volatility compounds (Riva et al 2019, Li et al 2020). With the improved detection efficiency, the Vocus PTR-TOF provides a much lower detection limit for various VOCs (<1 pptv for 1 min integration time). The instrument mass resolving power can reach up to 15 000 m dm−1 for m/Q > 100 Th. In this study, a high total sample flow of 5 L min−1 was used to draw the air to the entrance of the Vocus, which helped to reduce inlet wall losses. The instrument ionization source was operated at a low pressure of 1.4 mbar. At this pressure, around 0.1 L min−1 of the total sample flow went into the Vocus PTR-TOF, while the remainder was directed to other instruments and the exhaust. Data were recorded with a time resolution of 5 s. More details about the Vocus PTR-TOF technique are available in previous studies (Krechmer et al 2018).
Data were processed using the software package 'Tofware', which runs in the Igor Pro environment (WaveMetrics Inc. Lake Oswego, OR). Tofware enables the time-dependent mass calibration, baseline subtraction, and assignment of a molecular formula to the identified ions by high-resolution analysis. Signals were averaged over 15 min before data processing.
The instrument calibrations were conducted before and after the experiments using a calibration gas tank (Apel Riemer Environmental Inc.) containing 16 different compounds. It has been shown that the sensitivity of VOCs measured by PTR instruments is closely related to their elemental composition and functionality (Sekimoto et al 2017). The calibration gas tank included standards with the molecular formulas of CxHy, CxHyOz, and CxHyNz. Compounds with the formula of CxHy but not included in the standard mixture were quantified with the average sensitivity of the standards CxHy. For compounds with the formula of CxHyOz and CxHyNz but not included in the calibration tank, the average sensitivities of the standards CxHyOz and CxHyNz were used for them, respectively. There was no standard available for the compounds CxHyOzNp. In this study, the average sensitivity of the CxHyOz and CxHyNz standards was used for compounds with the formula of CxHyOzNp.
2.5. Calculation of VOC emission rates
The emission rates (E, ng g−1 dw soil h−1) of the investigated VOCs were calculated using the following equation:
where  (in L min−1) is the gas flow rate through the glass jar,
  and
and  (in ng L−1) are the VOC concentrations in the glass jar with thawing soils (sample measurements) and empty glass jar without soils (background measurements), and
  (in g) is the dry weight of soil samples. The number of 60 is used to convert minute to hour.
  is calculated by subtracting the background measurements with empty glass jar from the measured VOC concentrations with soil samples.
2.6. CH4 measurements
While the focus of this work is on non-methane VOC emissions, CH4 was measured in this study to provide a favorable benchmark regarding the behavior of soil processes during incubations. CH4 concentrations were measured by cavity ring-down spectroscopy (Picarro G2301). The analyzer was alternatingly connected to measure the air entering and leaving the sample container for 5 min each. The emission rate of CH4 was also calculated using equation 1.
2.7. Chronology
The bulk soil samples were 14C dated at the Laboratory of Chronology in Helsinki. The permafrost sample age 5665 BP (before present, when present is 1950 AD) was calibrated using the Calib 704 program (Stuiver and Reimer 1993) and the active layer age −228, pMC (% modern carbon) = 102.88 ± 0.25, indicating a modern age, was calibrated using the CALIBomb program (Reimer et al 2004).
2.8. Soil property analysis
After VOC flux measurements, samples were put into the oven and dried at 70 °C for 24 h. The gravimetric soil water content was determined based on the water loss after drying. Before SOM, total carbon, and total nitrogen content analysis, the dry materials were further put into the oven and dried at 105 °C for 12 h. Approximately 1.0 g of dry soils was used for SOM estimation based on weight loss on ignition at 550 °C for 4 h. Approximately 0.3 g of dry materials was used to determine total carbon and nitrogen content with an automated LECO 828 series elemental analyzer (LECO Corporation, St. Joseph, MI).
2.9. VOC volatility estimation
It is generally acknowledged that increasing carbon and oxygen numbers lower the volatility of organic molecules. To estimate the volatilities of individual organic compounds, we used a volatility parameterization based on the number of carbon ( ) oxygen (
 ) and nitrogen atoms (
 ) of the specific compound i (Donahue et al 2011, Mohr et al 2019). The volatilities are expressed as the logarithm of the saturation mass concentration
  for compound i:
where  =25,
=25,  =0.475,
  =0.2,
=0.2,  =0.9, and
  = 2.5. To investigate how the emissions of different compounds respond to temperature variations, the detected molecules in this study were further divided into three groups based on their volatility: VOCs, intermediate volatility organic compounds (IVOCs), and semi-volatile organic compounds (SVOCs).
3. Results
3.1. Total VOC fluxes
During the warming of the active layer and permafrost soils (soil characteristics of each sample in figure 1 and table S2), even at a low temperature of 0 °C, moderate amounts of VOCs were released (figure S2(a)). When the temperature was increased to 5 °C, the emission rate of VOCs peaked within one hour and then subsequently declined. The peak emission rate of total VOCs reached >2 µg g−1 dw soil h−1. To see the full potential of VOC emissions from thawing soils, we further raised the incubation temperature to 15 °C, when another rapid although relatively low VOC pulse was observed. The high emission pulse occurring immediately after thaw and its rapid increase and decline within several hours suggest that the direct release of old, trapped gases from buried and subsequently frozen peat layers is the main source of VOCs. This was further confirmed by the timing and shape of CH4 emissions upon permafrost thaw (figure S2(b)). We observed no detectable CH4 emissions from active layer soils, whereas the permafrost soils emitted a strong CH4 pulse immediately after thawing. According to the chronology analysis, the age of the permanently frozen soil sample was dated to 6450 cal. BP (calibrated years before present) and the active layer soil sample to 1955 AD.
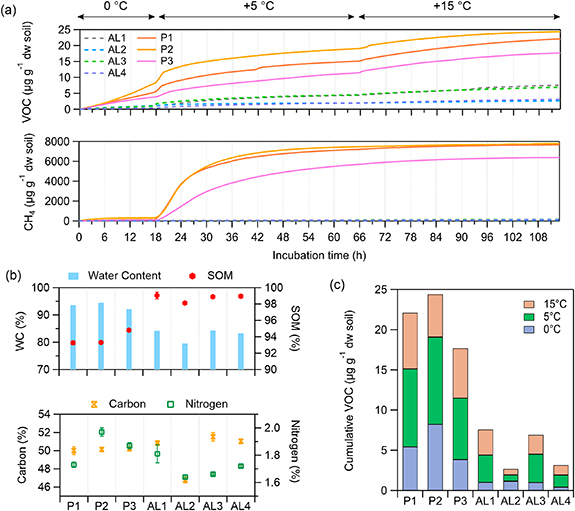
Figure 1. Cumulative VOC fluxes and soil properties of permafrost and active layer soils. (a) Cumulative VOC fluxes and methane fluxes during the incubation periods, with temperature varying from 0 °C to 5 °C and further to 15 °C. Measurement periods at different temperatures are shown at the top of the panel. (b) Water content (WC), soil organic matter (SOM) content, carbon content, and nitrogen content of permafrost and active layer soils. (c) Stacked cumulative VOC fluxes at different temperatures for thawing permafrost and active layer. P1, P2, and P3 are three peat core replicates from the same depth of frozen permafrost soils, and AL1, AL2, AL3, and AL4 are four active layer replicates from the same active layer soil depth. P, permafrost; AL, active layer.
Download figure:
Standard image High-resolution imageAs shown in figure 1, the average cumulative flux of total VOCs from the thawing permafrost during the whole observations is 21.4 ± 3.4 µg g−1 dw soil (mean ± SD), around four times as high as that from the active layer (5.1 ± 2.5 µg g−1 dw soil). Compared to total VOCs, the cumulative flux of CH4 emissions from the thawing permafrost is 7.3 ± 0.8 mg g−1 dw soil.
3.2. Speciated VOC fluxes
After subtracting the background signals measured with blank samples, 165 organic ions detected by Vocus PTR-TOF were identified as VOCs released from soil samples. Generally, the most abundant compounds showed both overlapping and differences between permafrost and active layer (figure 2). The cumulative fluxes of acetic acid (C2H4O2) and acetone (C3H6O) were the highest for both permafrost and active layer, on average accounting for 41.2% (32.9% ∼ 45.9%) and 18.5% (13.1% ∼ 23.2%) of total VOC release for the thawing permafrost and 19.9% (12.0% ∼ 25.3%) and 15.6% (8.9% ∼ 18.2%) for the active layer. In addition, acetaldehyde (C2H4O) and ethanol (C2H6O) also showed high abundances in total VOC emissions from the thawing permafrost and active layer soils.
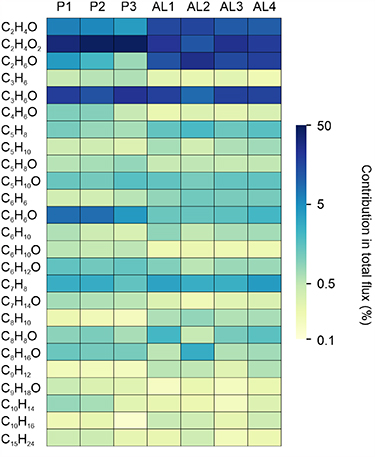
Figure 2. Highly emitted compounds from thawing permafrost and active layer. The rows correspond to different species and the columns are related to different samples. The heatmap is colored by the contribution of the species in total cumulative VOC fluxes for the corresponding sample during the whole measurements with temperature varying from 0 °C to 15 °C.
Download figure:
Standard image High-resolution imageWe furthermore observed the release of large quantities of aromatic compounds, such as benzene (C6H6), toluene (C7H8), xylene (C8H10), and phenol (C6H6O), which are listed in figure 2 as the highly emitted compounds from thawing soils. Among the emitted aromatic compounds, phenol and toluene were the most abundant species. For thawing permafrost, phenol on average contributed 6.9% (4.0% ∼ 8.5%) to total VOC emissions and toluene contributed 2.3% (1.5% ∼ 2.8%).
After thawing, emissions of isoprene, p-cymene, monoterpenes, sesquiterpenes, and diterpenes were measured from permafrost and active layer soils. For the thawing permafrost, the average emission rates of isoprene and monoterpenes during the whole measurements were 1.7 ± 0.6 ng g−1 dw soil h−1 and 0.4 ± 0.2 ng g−1 dw soil h−1, respectively (figure S3). While the emission rate of monoterpenes at 15 °C was lower than that at 5 °C, isoprene emissions were still high at 15 °C and comparable to its emissions at 5 °C. In particular, the less volatile sesquiterpenes and diterpenes were emitted with high fluxes. The average emission rate of sesquiterpenes from the thawing permafrost was 0.7 ± 0.3 ng g−1 dw soil h−1, higher than that of monoterpenes. Diterpenes were released with the average emission rate of 0.11 ± 0.03 ng g−1 dw soil h−1 for permafrost soils. As shown in figure S3, when the temperature was increased to 15 °C, sesquiterpenes and diterpenes were observed with higher amounts than at lower temperatures.
Figure 3 displays the overview of the speciated VOCs emitted from the thawing permafrost at different temperatures, with the mass defect (the difference between the exact mass and the nearest integer mass) of the measured compound plotted against the exact molecular mass of the compound. Based on the elemental composition, compounds of four categories were observed including CH, CHO, CHN, and CHON. The only compound in CHN group was acetonitrile (C2H3N), with the average emission rate of 0.1 ± 0.1 ng g−1 dw soil h−1 from the thawing permafrost soils. Due to the improved capacity of the Vocus PTR-TOF, larger molecules of the CH, CHO and CHON groups were measured from the thawing soils and were characterized with relatively lower volatility. More details can be found below.
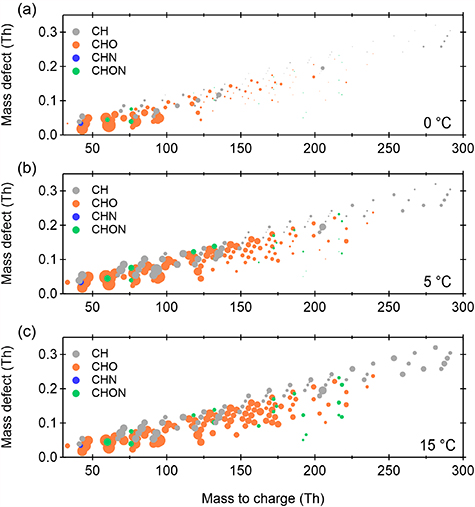
Figure 3. Mass defect plots of VOC emissions from thawing permafrost at different temperatures, displaying in total 165 organic ions measured by the Vocus PTR-TOF. The x-axis shows the mass-to-charge ratio and the y-axis the mass defect, which is the difference between the exact mass and the nominal mass. The mass defect plots show the detected compounds from thawing permafrost at (a) 0 °C, (b) 5 °C, and (c) 15 °C. Data points are color-coded by the ion family (CH, CHO, CHN, and CHON) and sized by the logarithm of peak area.
Download figure:
Standard image High-resolution image3.3. Temperature-dependence of VOC release from thawing permafrost
At higher temperatures, more compounds with larger molecular weight and lower volatility were released from the thawing permafrost. As shown in figure 3, when the temperature increased from 0 °C to 15 °C, much higher signals were observed for larger hydrocarbons (CH) and larger oxygenated molecules (CHO and CHON). Different VOCs showed their preferential responses to the varying temperature. For instance, aromatic compounds like toluene (C7H8), xylene (C8H10), and trimethylbenzenes (C9H12) were mostly emitted at 5 °C, and only a much smaller pulse was observed when the temperature rose to 15 °C (figure S4). However, for terpenes, particularly sesquiterpenes and diterpenes, much higher amounts were released with temperature increasing from 5 °C to 15 °C (figure S3). Figure S5 displays the correlation matrix among diverse VOCs for the variations in their emission rates during the whole incubation experiments with temperature varying from 0 °C to 5 °C and further to 15 °C, which illustrates whether the temperature-dependences of different volatile species are similar or not. The time series of the emission rates of all aromatic compounds correlated well with each other, consistent with the results in figure S4. For sesquiterpenes, diterpenes, and some larger oxygenated molecules like C9H14O, C8H14O3, C10H14O2, and C10H16O3, the variations in their emission rates during the whole temperature cycle correlated tightly with each other but showed no correlations with those of aromatic compounds.
Based on the volatility parameterization, the compounds in this study were categorized into VOC, IVOC, and SVOC, with IVOC and SVOC being less volatile than VOC. Figure 4 illustrates the average cumulative fluxes of VOC, IVOC, and SVOC from the thawing permafrost samples at 0 °C, 5 °C, and 15 °C. The total volatile emissions at different temperatures were largely dominated by VOCs, especially at 0 °C. The relative contributions of different species in the VOC group can be seen in figure 4, such as acetic acid, acetone, aromatic hydrocarbons, isoprene, and monoterpenes. When the temperature increased, the mass contributions of IVOCs and SVOCs were substantially enhanced (figures 4 and S6). The mass fraction of IVOCs in total volatile emissions rose from 0.01 to 0.18 with the temperature varying from 0 °C to 15 °C. In addition to sesquiterpenes, the IVOC group in this study included the compounds of C6−8HyO1−2, C9−12HyO1−2, and C12−15Hy. The SVOC group contributed a small fraction of <0.02 in total volatile emissions, which comprised the compounds of C13−16HyO1−2 and C20Hy.

Figure 4. Cumulative VOC fluxes from thawing permafrost at different temperatures. For each temperature, the left bar is stacked by VOC groups with different volatility. The right bar is stacked by corresponding VOC species. IVOC, intermediate volatility organic compound; SVOC, semi-volatile organic compound. Measurement periods at different temperatures can be found in figure 1(a).
Download figure:
Standard image High-resolution image
4. Discussion
In this work, the gradually increasing temperature mimics the warming conditions that will eventually affect the permafrost region and allows investigations of the temperature dependence of VOC emissions. Over recent years, the Arctic has experienced extreme heat waves when anomalies of daily temperature during October-December exceeded 16 °C in many locations spanning the Arctic area (Simpkins 2017). Therefore, the sequentially increasing temperatures to 5 °C and further to 15 °C during the incubations in this study provide a potential long-term prediction for future volatile emissions from thawing soils. By performing incubation experiments at 10 °C and 20 °C, Kramshøj et al (2019) found that emissions of alcohols, acids, esters, aldehydes, and terpenoids from thawing permafrost soils showed different temperature dependence. However, a full picture of speciated VOC emissions from thawing permafrost and how their emissions respond to temperature variation is still unclear. Particularly, due to the instrumental limitation in previous studies (Kramshøj et al 2018, 2019), the characterization of less volatile compounds is unavailable. In this study, the deployment of Vocus PTR-TOF enables the detection of many more VOCs including the less volatile compounds, thus providing a more comprehensive understanding of the volatile release from thawing permafrost. For the first time, emissions of sesquiterpenes and diterpenes were observed from thawing soils. With temperature increasing from 5 °C to 15 °C, much higher amounts of sesquiterpenes and diterpenes were released. The emissions of SVOCs and IVOCs were higher at 15 °C than at 5 °C. Therefore, it is expected that more compounds with lower volatility will be emitted from thawing permafrost with a continued warming trend. While the emission rates of sesquiterpenes and diterpenes from thawing permafrost are much smaller than those of other terpenes, they are characterized by higher reactivity and higher aerosol yield (Jaoui et al, 2013).
The results from this study are characteristic of water-saturated (anaerobic) thermokarst landscapes that form as a result of ground collapse following abrupt thaw. Under aerobic conditions, permafrost volatile emissions can be largely consumed by the active layer microbial processes (Kramshøj et al 2018). However, in anaerobic conditions, a larger part of volatile emissions from thawing permafrost can enter the atmosphere due to the weak microbial activity caused by excess water and lack of oxygen. Furthermore, the thermokarst processes directly expose the deep permafrost carbon pools to the air and thus provide quick access of the volatile release to the atmosphere. Thermokarst landscapes are estimated to cover ∼20% of the northern permafrost region, and abrupt thaw processes are projected to increase in a future warmer climate (Olefeldt et al 2016, Turetsky et al 2020). Under the scenario of RCP 8.5, 70.4 Pg of permafrost soil organic carbon in water-saturated soils are projected to thaw by 2100 versus 172.4 Pg C in non-saturated soils (Knoblauch et al 2018).
Our study highlights the need of many more studies, representing different soil and environmental conditions within the permafrost region, to explore VOC emissions from thawing soils. In this study, permafrost samples were collected from a single palsa peatland in Finnish Lapland. Permafrost peatlands cover the area of about 3556 × 103 km2, approximately 19% of Arctic and subarctic permafrost region (Hugelius et al 2014). Peatland soils are generally characterized by higher SOM content than mineral soils (Tarnocai et al 2009). Therefore, large regional differences regarding volatile releases are probable. For instance, the average VOC fluxes from permafrost peatlands in this study are more than two orders of magnitude larger than those from heath soils or fen permafrost soils reported previously by Kramshøj et al (2019). The average SOM content of permafrost soils is 93.8% ± 0.9% in this study while the average SOM contents of heath and fen permafrost soils are 2.3% ± 0.6% and 7.5% ± 1.3%, respectively, in Kramshøj et al (2019). Furthermore, the VOC emissions from thawing permafrost have been found to positively correlate with soil water content (Kramshøj et al 2018). While incubation results may differ greatly from natural processes, we aim to provide a potential extrapolation of volatile emissions budget from thawing permafrost peatlands to assess its significance. According to Hugelius et al (2020), northern permafrost peatlands store around 185 Pg C. It is projected that almost no peatland permafrost would remain at 6 °C global warming stabilization above the pre-industrial (around 4 °C ∼ 6 °C temperature increase by the end of this century relative to pre-industrial under the scenario of RCP 8.5; Hugelius et al 2020). With the average cumulative VOC fluxes of 21.4 µg g−1 dw soil and the average soil carbon content of 50.1% in this study, a rough estimation of 7.9 Tg VOC emissions can be expected from thawing permafrost peatlands. If we assume that the biogenic VOC emissions are evenly distributed in the Arctic land area and thus the distribution of these VOC emissions is proportional to the land cover area, the amount of VOC emissions from thawing permafrost peatlands by 2100 is almost six times as high as the annual biogenic VOC emissions in permafrost peatland areas (Sindelarova et al 2014). We acknowledge that large uncertainties can be incurred when we extrapolate from short-term lab experiment to processes occurring in the real environment over years or decades. In this study, soil incubations and VOC measurements were performed only over several days. However, in reality, the direct release of VOCs from thawing soils would last longer and the total emitted amounts can be higher than our observations. In addition, the VOC productions by the microbes in the thawing soils over long time scales are not included in this study. Therefore, we emphasize that more studies are needed to better understand and quantify VOC emissions from thawing permafrost in the circum-Arctic permafrost region.
When temperature increased, the shape of the high VOC fluxes from thawing soils displayed a rapid increase and then suddenly decreased in several hours. This behavior indicates the dominance of the direct release of old, trapped gases from the permafrost as microbial activities largely occur slowly and steadily (Altshuler et al 2017). Through 7 yr laboratory incubations, Knoblauch et al (2018) found that under anoxic conditions, active methanogen community only establishes over longer time periods, from a few weeks up to several years. One possible source of the old gases is that they are formed before permafrost aggradation and are trapped in the soils as the permafrost develops. In addition, the old gases can be produced by slow microbial activities in permafrost soils since soil microbes can be active even below freezing temperatures. These trapped gases accumulate in permafrost soils over long build-up periods and can be rapidly released when the soils thaw at higher temperatures. It is important to keep in mind the temporal scale of this study, as soil incubations were performed only over several days instead of several decades. For this reason, the effect of microbial community structure on microbial VOC release or consumption after permafrost thaw was not determined in this work. Therefore, the response of volatile release to permafrost thawing on climate-relevant timescales is still uncertain.
Nevertheless, our results highlight the potential for substantive volatile release from thawing permafrost under climate warming, which introduces additional uncertainties to global climate modeling. Particularly, the first observation of sesquiterpene, diterpene, and other SVOC and IVOC emissions from thawing soils may play a more important role in atmospheric chemistry with the continued warming trend. In the Arctic, with sparse vegetation cover and much lower anthropogenic influences, such high volatile emissions from thawing soils might contribute a lot in regional and global climate feedbacks. To provide an improved budget of future pan-Arctic volatile release from thawing permafrost, it is essential to better understand changes in landforms and hydrology in permafrost zones and spatial distribution of warming-induced volatile emissions significantly influenced by soil properties, with a particular emphasis on soil organic carbon content.
Acknowledgments
This project was financially supported by the European Research Council (grant nos. ATM-GTP (742206), CHAPAs (850614), and MEMETRE (757695)), the Academy of Finland (project 311932), and the Center of Excellence Program of the Academy of Finland (grant 272041). L K acknowledges support from a Marie Skłodowska-Curie Action Individual Fellowship (Grant Nos. PaTreME (843511)). A B K S, M V, and H L acknowledge funding from Arctic Avenue (a spearhead project between the University of Helsinki and Stockholm University), A B K S from the Swedish Research Council Formas (214-2014-562), and M V from the Academy of Finland (project 296519). We thank Tatu Polvinen from University of Helsinki for laboratory assistance to set up the experimental system, and Teemu Juselius from University of Helsinki for fieldwork assistance.
Author contributions
H L and F B designed the research. M V and A B K S collected the soil samples from permafrost region. M V organised age control. H L, M M and L K performed the experiments and analyzed the data. H L interpreted the results and wrote the paper with contributions from all authors.
Data availability statement
The data that support the findings of this study are available upon reasonable request from the corresponding authors.
Competing interests
The authors declare no competing interests.