


Abstract
Methane (CH4), an important greenhouse gas and pollutant, has been targeted for mitigation. Our recent California airborne survey identified >500 CH4 point source super-emitters, which accounted for 34%–46% of the statewide CH4 emissions inventory for 2016 (Duren et al 2019 Nature 575 180–184). Individual plumes were observed in close proximity to expected methane emitting infrastructure, including gas storage facilities, hydrocarbon storage tanks, landfills, dairy lagoons, and pipeline leaks. In order to systematically attribute these plumes to their sources, we developed Vista-CA a geospatial database, that contains more than 900 000 validated CH4 infrastructure elements in the state of California. In parallel, we developed a complimentary algorithm that attributes any individual CH4 plume observation to the most likely Vista-CA source with 99% accuracy. The present study illustrates the capabilities of the Vista-CA CH4 database along with the Airborne Visible/Infrared Imaging Spectrometer—Next Generation airborne CH4 retrievals to locate and attribute CH4 point sources to specific economic sectors to improve the state CH4 budget and identify mitigation targets.
Export citation and abstract BibTeX RIS

Original content from this work may be used under the terms of the Creative Commons Attribution 4.0 license. Any further distribution of this work must maintain attribution to the author(s) and the title of the work, journal citation and DOI.
1. Introduction
Methane (CH4) is a powerful greenhouse gas (GHG) responsible for sim 20% of radiative forcing since the Industrial Revolution [1]; however, uncertainty in the source apportionment of CH4 emissions poses a challenge for implementing mitigation, globally and in policy relevant domains. In the State of California, reductions in CH4 emissions are explicitly required by law (2016 SB 1383) as a way to achieve California's climate goals for significantly reducing overall GHG emissions by 2030 [2, 3]. To this end, it is necessary that California has an appropriate and sufficient CH4 observing system to evaluate progress towards its emission reduction goals given large uncertainties in current techniques [4].
Notable differences in CH4 source apportionment have been observed between atmospheric observations and expected GHG emissions for urban areas in the state [5–7]. These studies used measurements of CH4 and its tracer species in well-mixed air to infer the contributions of different source sectors to regional CH4 emissions, and found that these estimates differed from the source contributions detailed in regionally downscaled versions of the California Air Resources Board GHG Inventory (CARB GHG Inventory). Given that the CARB GHG Inventory is the primary tool used for tracking GHG emissions in the state, this discrepancy poses a challenge for verifying state-mandated CH4 mitigation efforts.
Another policy tool for tracking GHG emissions is facility-level governmental reporting programs. The California Air Resources Board Pollution Mapping Tool (CARB PMT: https://ww3.arb.ca.gov/ei/tools/pollution_map/) and the U.S. Environmental Protection Agency Facility Level Information on GreenHouse gases Tool (EPA FLIGHT: https://ghgdata.epa.gov/ghgp/main.do) show maps of facilities that exceed annual emissions of 10 000 or 25 000 metric tons CO2-e for CARB and EPA, respectively, along with their annual reported GHG emissions, including CH4. Facility level emissions tracking is useful because this is the scale where mitigation actions are most often taken; however, these emissions are not verified by independent methods. It is unclear how accurately CH4 emissions are represented given that these thresholds for emissions reporting are mostly driven by CO2 emissions, and CH4 is more difficult to inventory given the importance of fugitive sources and fat-tailed distributions.
Recent advances in airborne remote sensing of CH4 have enabled meter-scale imaging of CH4 point sources over areas from 1000 to 100 000 km [8–11] Using this technique, Duren et al [11] surveyed methane emission sources in California and found that a few hundred CH4 point sources contributed 34%–46% of the overall statewide emissions. The high spatial resolution, 1–3 m per pixel, of airborne imaging spectrometers is capable of visualizing CH4 plumes at the scale of their sources. Combining plume imagery with detailed geospatial information from high-resolution satellite imagery in a platform such as Google Earth, enables one to attribute CH4 emissions to specific facilities and infrastructure components [12–14]. However, analysis of these CH4 point sources requires an accurate, systematic method to identify infrastructure components at policy relevant (e.g. facility) levels. Such detailed information is not provided in a state level, aggregated inventory such as the CARB GHG Inventory or even in high resolution (sim 10 km) disaggregated inventories [e.g. Maasakkers et al 15 ].
A different approach for systematically understanding the distribution of CH4 sources was demonstrated by Carranza et al [16] for the Los Angeles (LA) Basin through the development of Vista-Los Angeles (Vista-LA) [16]. Vista-LA is a geospatial dataset of all anthropogenic CH4 infrastructure within the LA Basin that attempts to represent all potential sources of CH4 emissions regardless of the expected size of emissions. Vista-LA is organized in the same way as the CARB GHG Inventory for sectoral analyses, but is spatially disaggregated with representations of CH4 emission sources at the facility scale and down to individual components, such as gas pipelines. Combining this detailed dataset with new, high resolution observational data of CH4 emissions from airborne remote sensing enables a more thorough 'inventory' of CH4 based on actual observations that is likely to be more robust than activity/emission factor methods that do not capture fugitive or anomalously large sources that are thought to be common for CH4.
In this study, we expand the Vista approach to the whole state of California (Vista-CA) for analysis of CH4 plume data collected by the Airborne Visible/InfraRed Imaging Spectrometer-Next Generation (AVIRIS-NG) in California in 2016–218. Previously, we showed that Vista-CA was used for survey planning and manual source attribution for a subset of these flights (Duren et al [11]). Here, we (1) detail further updates to the Vista methodology to enable automated source attribution, and (2) compare its performance to attributions made from existing facility data from government reporting programs [11, 17], and (3) demonstrate that source attribution can be automated for fast-turnaround data processing for all 2016–2018 plume datasets using the Geospatial Source Attribution Automated Model (GSAAM).
2. Methods
2.1. Vista-CA data development
Vista-CA is a geospatial database of 901 009 validated elements of potential CH4 emitting infrastructure developed from publicly available datasets that have been validated and standardized for the entire state of California (figure 1). Vista-CA includes 17 different CH4 source layers that have been systematically categorized into facilities and sub-facilities. These include power plants, refineries, natural gas fueling stations, natural gas stations, pipelines, distribution pipelines, natural gas processing plants, natural gas storage fields, oil and gas facilities, oil and gas field boundaries, oil and gas wells, dairies, feedlots, digesters, composting sites, solid waste disposal sites, and wastewater treatment plants (table 1). New source layers were added to Vista-CA that were not present in Vista-LA because they were (1) not included as CH4 sources in the CARB inventory, but were observed to emit by AVIRIS-NG [11] (composting sites), (2) not present in the LA domain (digesters, feedlots), and (3) comprise datasets that were published after Vista-LA (oil and gas facilities). Federal and state data repositories were used as the primary data sources [8, 18–21]. These datasets were validated by cross-comparing multiple datasets for spatial consistency and accuracy. We used Google Earth aerial imagery to either identify or confirm geolocations as well to denote geographic extents of individual facilities and infrastructure. All feature datasets were georeferenced and updated with standardized metadata, and are freely available on the Oak Ridge National Laboratory Distributed Active Archive Center for Biogeochemical Dynamics [22]. Vista-LA layers that previously covered only the LA Basin were expanded to include the full extent of California [16, 17]. All datasets are formatted as vectors stored as either lines, points, or polygons (Table S1 (available online at stacks.iop.org/ERL/15/124001/mmedia)).
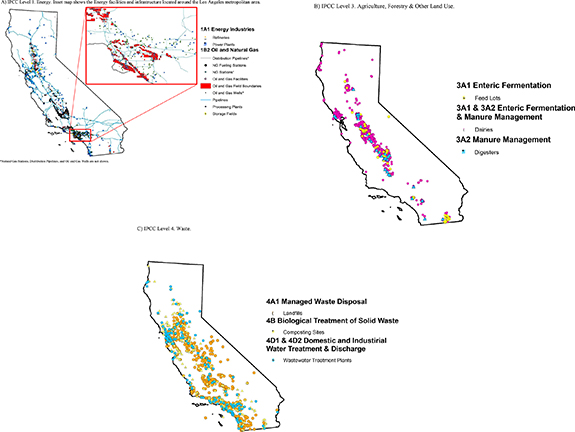
Figure 1. Vista-CA Maps. The maps on the following pages are grouped by the IPCC Level 1 structure: (A) Energy, (B) Agriculture, Forestry & Other Land Use, and (C) Waste. Each IPCC Level 1 map displays all the relevant infrastructure organized within IPCC Level 3 (table 1). (A) IPCC Level 1. Energy. Inset map shows the Energy facilities and infrastructure located around the Los Angeles metropolitan area. (B) IPCC Level 3. Agriculture, Forestry & Other Land Use. (C) IPCC Level 4. Waste.
Download figure:
Standard image High-resolution imageTable 1. Vista-CA Dataset. Vista-CA layers, representing CH4 sources corresponding to IPCC Level 3, are shown organized by IPCC greenhouse gas emission reporting classification. Layers are grouped into facility and sub-facilities based on a systematic spatial overlap analysis and a logical process-based relationship. The vector formats and the search radii required for appropriate attribution for each layer are also given (SUPPLEMENT).
| IPCC Level 1 | IPCC Level 3 | Vista-CA Facility | Number of Elements | Vista-CA Sub-Facility | Number of Elements |
|---|---|---|---|---|---|
| 1. ENERGY | 1A1 Energy Industries | Refineries (polygons at 0 m) | 26 | Sub-facility Oil & Gas Facility (polygons at 0 m) Sub-facility Power Plants (polygons at 0 m) | 2816 |
| Stand-Alone Power Plants (polygons at 0 m) | 326 | ||||
| sub-total | 352 | sub-total | 44 | ||
| 1B2 Oil & Natural Gas | Distribution Pipelines (polylines <11 m) | 5,69 609 | |||
| NG Fueling Stations (polygons at <3 m) | 209 | ||||
| NG Stations (points at 0 m) | 1120 | ||||
| Oil & Gas Facilities (polygons at 0 m) | 3261 | Sub-facility Power Plants (polygons at 0 m) | 16 | ||
| Oil & Gas Fields (polygons at 0 m) | 463 | Oil and Gas Wells (points at <25 m)Pipelines (polylines at <40 m) | 211 735 (total 225 766) 15 149 (total 96 823) | ||
| Processing Plants (polygons at 0 m) | 26 | Sub-facility Oil & Gas Facility (polygons at 0 m) Sub-facility Power Plants (polygons at 0 m) | 273 | ||
| Storage Fields (polygons at 0 m) | 12 | Sub-facility Power Plants (polygons at 0 m)Sub-facility Oil & Gas Facilities (polygons at 0 m) | 140 | ||
| sub-total | 5091 | sub-total | 7,96 580 | ||
| 3. AGRICULTURE, FORESTRY & OTHER LAND USE | 3A1 Enteric Fermentation | Feed Lots (points at <1402 m) | 72 | ||
| 3A1 & 3A2 Enteric Fermentation & Manure Management | Dairies (points at <1402 m) | 1715 | Digesters (polygons <10 m)Sub-facility Power Plants (polygons) | 312 | |
| sub-total | 1787 | sub-total | 33 | ||
| 4. WASTE | 4A1 Managed Waste Disposal | Landfills (polygons at <1 m) | 714 | Sub-facility Oil & Gas Fields (polygons at 0 m) Sub-facility Power Plants (polygons at 0 m) Sub-facility Wastewater Treatment Plant (polygons at 0 m) | 53 45 16 |
| 4B Biological Treatment of Solid Waste | Composting Sites (polygons* at <230 m) | 430 | |||
| sub-total | 1144 | sub-total | 114 | ||
| 4D1 & 4D2 Domestic and Industirial Water Treatment & Discharge | Wastewater Treatment Plants (polygons at 0 m) | 133 | Power Plants (polygons at 0 m) | 26 | |
| TOTAL Vista-CA Facility Elements | 8507 | TOTAL Vista-CA Sub-Facility Elements | 7,96 797 | ||
| TOTAL Vista-CA Elements | 9,01,009 | ||||
Vista-CA is organized according to the CARB GHG Inventory, which itself is based on the framework established by the Intergovernmental Panel on Climate Change (IPCC) [23]. However, both IPCC and CARB are process-based inventories that use state level activity data to estimate GHG emissions, whereas Vista-CA is database of actual facilities that may emit CH4 in California. Organizing Vista-CA source types in this way is critical for comparison with inventory and for categorizing contributions of different emission sectors.
2.2. Other emission datasets
CARB provides annual CH4 estimates for top-emitting facilities across California [18]. Their pollution mapping tool (PMT) is a geospatial database that enables users to query, locate, and view reported GHG and criteria pollutant emissions at the facility scale [18]. CH4 data is only reported for facilities emitting >10 000 metric tons CO2e annually. PMT contains facility addresses that are sometimes inaccurate, often giving the address of operator headquarters instead of the emitting facility. True addresses were obtained from publicly available records and were used to validate locations in the CARB PMT data. CARB PMT CH4 data for 2016 contained a geospatial dataset of 597 CH4 reporting facilities in California [18].
EPA FLIGHT is a geospatial database of the locations of approximately 8000 facilities that report annually to the EPA Greenhouse Gas Reporting Program (GHGRP). EPA FLIGHT tracks facilities that emit more than 25 000 MTCO2eq/year, and accounts for 85%–90% of emissions included in the official EPA GHG Reporting Program [24]. EPA FLIGHT CH4 data for 2017 contained geospatial data of 389 CH4 reporting facilities for California [20]. Both CARB PMT and EPA FLIGHT differ from the official GHG inventories from their respective agencies in that they are based on reported emissions at the facility scale, not activity data.
2.3. Airborne imaging spectrometer data
We used CH4 plume observations from a survey of California conducted using the Airborne Visible/Infrared Imaging Spectrometer—Next Generation (AVIRIS-NG) instrument [11, 17]. AVIRIS-NG is capable of detecting concentrated CH4 plumes by measuring ground-reflected solar radiation across 427 contiguous spectral bands ranging from 350 to 2500 nm wavelengths with 5 nm spectral sampling at 3 m spatial resolution. The CH4 retrieval is based on absorption spectroscopy between 2100 and 2500 nm and provides a mixing ratio length that represents CH4 enhancement integrated along the column beneath the aircraft in parts per million x meter (ppm m) [25]. AVIRIS-NG's spectral resolution, high spatial resolution, and high signal-to-noise ratio has permitted high-resolution mapping of CH4 as well as CO2 and H2O [12, 25–27]. AVIRIS-NG has consistently detected and quantified CH4 point sources from multiple emissions sectors for emissions as small as 2–10 kg CH4/hr, depending on surface albedo and aircraft/ground speed [11, 17]. For further information, the specific plume localization and identification process has been detailed by Duren et al [11].
We used AVIRIS-NG CH4 plume observations from 2016–2018 collected during the California Methane Campaign [11], in which 2424 CH4 plumes were identified manually with high confidence. These plume observations are available to the public at the Methane Source Finder web portal (https://methane.jpl.nasa.gov). Emissions from 1181 of the 2016–2017 plume detections were quantified and published by Duren et al [11] along with manual source attribution using Vista-CA. Here we performed source attribution on the additional 748 unpublished plumes from 2016–2017 for which emissions quantification was uncertain, and the 495 plumes from 2018.
2.4. Source attribution framework
The meter-scale resolution and geolocation accuracy of AVIRIS-NG observations enabled us to determine the source location of nearly all CH4 plumes within a radius of 5 meters or less. We then attributed each plume observation to an emission source facility/sub-facility in the Vista-CA database based on spatial proximity (figure 2). First, we manually identified the emissions origin of each observed CH4 plume using preliminary versions of Vista-CA. This process entailed overlaying orthorectified grayscale images of CH4 retrieved by a linearized matched filter (AVIRIS-NG Level 3 data) on high resolution Google Earth aerial imagery for broader context with Vista-CA infrastructure maps simultaneously displayed. This process was conducted for the 1181 plumes published by Duren et al [11]. We treat this manual attribution as the true attribution for development of automated attribution algorithms. Next, we automated the attribution of observed AVIRIS-NG CH4 plumes based on proximity to Vista-CA features (Figure S2). We developed a decision-tree framework to attribute AVIRIS-NG plumes to the nearest logical Vista-CA feature while considering the effect of known spatial biases that impact proximity attribution (figure 3). Specifically, there is a large degree of spatial overlap amongst Vista-CA source layers (Table S2). These overlaps often occur because Vista-CA layers are organized by source type, e.g. power plants, without considering whether each individual feature is part of a larger facility, such as a landfill or refinery which often contain their own power plants. An overlap analysis was conducted among all 17 Vista-CA source layers (Table S2) to distinguish facility vs. sub-facility scale features (table 1). Finally, within each branch and sub-branch of the framework, a specific radius was determined to maximize attribution accuracy and reduce the number of false positives and false negatives (table 1). Using the greatest distance between a methane plume and its source feature in Vista-CA, we determined a radius for each Vista-CA layer using the near function in ArcGIS.
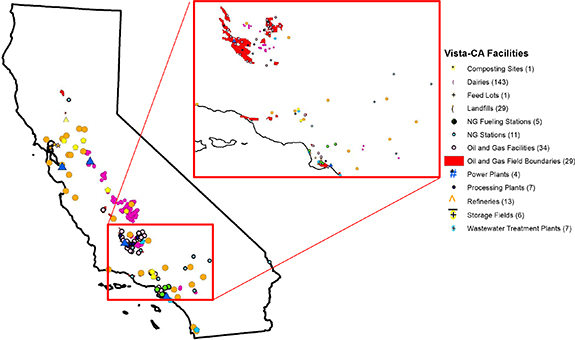
Figure 2. AVIRIS-NG Plumes—Vista-CA Unique Facilities Attribution. This map shows the locations of the 290 unique facilities as identified by the automated attribution of the 1181 AVIRIS-NG plumes using Vista-CA GSAAM V4. The inset shows greater detail for the southern San Joaquin Valley and the Los Angeles Basin, where 1043 plumes were observed.
Download figure:
Standard image High-resolution image
Figure 3. Geospatial Source Attribution Automated Model (GSAAM) V4 Decision-Tree Logic. (A) and (B) illustrate the framework used to for the model logic. The model uses a spatial function at each node (Vista-CA dataset) and to attribute a methane plume observation to a source from amongst Vista-CA infrastructure elements based on a predetermined distance from the feature. Each pathway (attribution) ends with one of three options: Facility (purple text); Sub-facility (red text); or Unknown (black text). GSAAM is organized by IPCC categories: (1) Agriculture, Forestry & Other Land Use (green boxes); (2) Waste (orange boxes); and (3) Energy (blue boxes).
Download figure:
Standard image High-resolution imageTo develop the automated model, we first employed an automated simple distance method to attribute 1181 plumes from the published Duren et al dataset to the nearest Vista-CA feature without providing any spatial logic or hierarchal considerations (figure 3). This baseline allowed us to see where improvements would have to be initiated, how to prioritize or develop the data hierarchy, and how to logically assess spatial complexities within the data. Consequently, a hierarchical structure was developed within the decision-tree framework to account for spatial biases in order to reduce the number of misattributions (figure 3). Attributions are done at the facility level, which also gives a sectoral attribution by IPCC source category. Further, we attribute plumes to sub-facilities if present to enable better understanding of the emitting process. For example, if the workflow attributed a given plume to a refinery, it would further assess whether it could also be attributed to relevant sub-facility components such as an oil & gas well or a sub-facility power plant. If so, they would be appropriately attributed; if not, they would simply stay as being attributed to the refinery facility-level. If a plume was unable to be identified by any of these features, then the plume would pass to the next sector for attribution according to the decision tree structure. This process would continue until all sectoral, facility, and sub-facility Vista-CA data is parsed. The remaining un-attributed plumes are labeled 'Unknown'.
Manually attributing plumes required significant time and effort; however, the decision-tree workflow was strategically designed for easy automation. The resulting GSAAM is an efficient plume-to-source attribution framework designed with 2 main inputs: latitude/longitude (X, Y) coordinates as a comma-separated values spreadsheet and Vista-CA geospatial datasets. After all attributions have been completed according to the decision tree, the model merges the result together into a final product outputting a tabular spreadsheet along with an ESRI point shapefile (Table S1).
3. Results
We used Vista-CA to perform source attribution of 2424 methane plumes observed by AVIRIS-NG during the 2016–2018 California Methane Survey (figure 2) [11]. First, we manually attributed plumes to facilities in Vista-CA to determine the maximum possible number of sources attributed using the Vista-CA dataset. Of the total 2424 methane plumes observed, 2407 (99.3%) were manually attributed to a Vista-CA feature (table 2). Unattributed plumes, hereafter called unknowns, were either found far from any methane emitting infrastructure, such as in an agricultural field, or were found associated with methane emission sources not included in Vista-CA, such as a beef processing plant [11].
Table 2. Vista-CA GSAAM-AVIRIS-NG Attribution Results. Maximum Source Attribution Potential is calculated by taking the total potential plumes that have been attributed with Vista-CA and adding the total number of false negatives. The facility and sub-facility accuracies are calculated by taking the total correct attributions for each and subtracting the number of unknown attributions. Unknown attributions show the total number of plume attributions that were unable to be identified by GSAAM using Vista-CA datasets. The False Positive Rate is measured by taking the total number of plumes falsely attributed to another Vista-CA feature. The False Negative Rate is measured by taking the total number of plumes that were not attributed to a Vista-CA facility even though a Vista-CA facility for them logically exists.
| Data Source | Maximum Source Attribution Potential | Vista-CA Facility Accuracy | Vista-CA Sub-Facility Accuracy | N umber of Unknown Attributions | False Positive Rate | False Negative Rate | ||||||
|---|---|---|---|---|---|---|---|---|---|---|---|---|
| AVIRIS-NG Unpublished Fall2016-Fall 2017 Campaign (748 Plumes) | 744/748 | 99.47% | 738/740 | 99.73% | 118/118 | 100% | 8/748 | 1.07% | 2/748 | 0.27% | 4/748 | 0.53% |
| AVIRIS-NG Published Fall2016-2017 Campaign (1181 Plumes) | 1170/1181 | 99.07% | 1158/1170 | 98.97% | 271/271 | 100% | 1 111 181 | 0.93% | 111 181 | 0.08% | 0/1181 | 0.00% |
| AVIRIS-NG Unpublished Fall2018 Campaign (495 Plumes) | 493/495 | 99.59% | 488/493 | 98.99% | 79/79 | 100% | 2/495 | 0.40% | 5/495 | 1.01% | 0/495 | 0.00% |
| OVERALL PERFORMANCE | 99.38% | 99.23% | 100% | 0.87% | 0.45% | 0.18% | ||||||
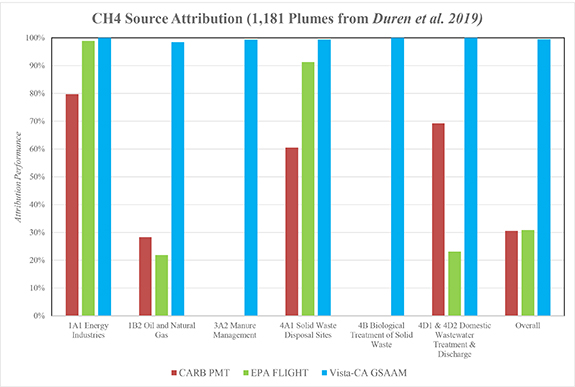
We compared manual attribution with the Vista-CA dataset to manual attribution with other CH4 facility databases: CARB PMT and EPA FLIGHT for a subset of 1181 plumes with high confidence emissions estimates from 2016–2017 (published in Duren et al [11]). Manual attribution of airborne CH4 plume detections with both CARB PMT and EPA FLIGHT data resulted in significantly lower attribution accuracies across the 6 IPCC sectors (figure 4). Use of CARB PMT attributed 39.5% of observed CH4 plumes (466/1181), and after comparison with the original manual attribution, only 30.6% of plume attributions using PMT were considered correct (361/1181 plumes) (figure 4). CH4 plume attribution with EPA FLIGHT had similar results, with attribution of 38.8% of CH4 plumes (458/1181), with 30.9% correct (366/1181 plumes) (figure 4). Performance of PMT and FLIGHT varied greatly across sectors, with much better source attribution for Energy (IPCC 1A1) and Waste (IPCC 4A1) compared to Oil and Natural Gas (IPCC 1B2) and Manure Management (IPCC 3A2) (figure 4). In total, CARB PMT only had 18% (52) and EPA FLIGHT only had 15% (44) of the 290 unique facilities in Vista-CA that were observed to be emitting CH4 by AVIRIS-NG in our dataset (table 3).
Figure 4. Overall Attribution Accuracy Results. Manual attribution performance as a percentage for CARB PMT, EPA FLIGHT, and Vista-CA GSAAM attribution model performance for IPCC Level 3 source categories. (3A1 Enteric Fermentation: 0 Attributions detected for Feed Lots).
Download figure:
Standard image High-resolution image
Table 3. Facilities/Features Comparison. Number of facilities/features in CARB PMT, EPA FLIGHT, and Vista-CA have been categorized and binned into specific Vista-CA categories for comparison. The number of unique facilities for which CH4 observations by AVIRIS-NG have been attributed for each dataset is shown in parenthesis.
| IPCC Level 1 | IPCC Level 3 | Vista-CA Categories | CARB PMT | EPA FLIGHT | Vista-CA |
|---|---|---|---|---|---|
| Number of Facilities/Features | Number of Facilities/Features | Number of Facilities/Features | |||
| 1. ENERGY | 1A1 Energy Industries | Refineries | 24 (13) | 19 (8) | 26 (13) |
| Power Plants (Facility & Sub-facility) | 209 (7) | 113 (5) | 433 (4) | ||
| sub-total | 233 (20) | 132 (13) | 459 (17) | ||
| 1B2 Oil & Natural Gas | Distribution Pipelines (Sub-facility) | 0 (N/A) | 3 (N/A) | 569 609 (N/A) | |
| NG Fueling Stations | 0 (0) | 0 (0) | 209 (5) | ||
| NG Stations | 13 (6) | 11 (3) | 1120 (11) | ||
| Oil & Gas Facilities | 39 (8) | 0 (0) | 3356 (34) | ||
| Oil & Gas Fields | 0 (0) | 0 (0) | 516 (29) | ||
| Oil & Gas Wells (Sub-facility) | 0 (N/A) | 0 (N/A) | 225 766 (N/A) | ||
| Pipelines (Sub-facility) | 10 (N/A) | 3 (N/A) | 96 823 (N/A) | ||
| Processing Plants | 0 (0) | 7 (1) | 26 (7) | ||
| Storage Fields | 0 | 3 (2) | 12 (6) | ||
| sub-total | 62 (14) | 27 (6) | 897 437 (92) | ||
| sub-total | 295 (34) | 159 (19) | 897 896 (109) | ||
| 3. AGRICULTURE, FORESTRY & OTHER LAND USE | 3A1 Enteric Fermentation | Feed Lots | 0 (0) | 0 (0) | 72 (1) |
| 3A1 & 3A2 Enteric Fermentation & Manure Management | Dairies | 0 (0) | 0 (0) | 1715 (143) | |
| 3A2 Manure Management | Digesters (Sub-facility) | 0 (N/A) | 0 (0) | 33 (N/A) | |
| sub-total | 0 (0) | 0 (0) | 1320 (144) | ||
| 4. WASTE | 4A1 Managed Waste Disposal | Landfills | 14 (13) | 99 (24) | 714 (29) |
| 4B Biological Treatment of Solid Waste | Composting Sites | 0 (0) | 0 (0) | 430 (1) | |
| 4D1 & 4D2 Domestic and Industirial Water Treatment & Discharge | Wastewater Treatment Plants | 14 (5) | 1 (1) | 149 (7) | |
| sub-total | 28 (18) | 100 (25) | 1293 (37) | ||
| TOTAL Number of Facilities/Features | 331 (52) | 263 (44) | 901 009 (290) | ||
Next, we used Vista-CA to automate source attribution based on spatial relationships between observed CH4 plumes and Vista-CA infrastructure. As discussed previously, a simple distance analysis to attribute each CH4 plume to a Vista-CA feature served as the validation baseline for measuring model performance. Vista-CA GSAAM V4 improved attribution accuracy over the simple distance method from 51.3% to 99.6% at the facility level across all seven IPCC Level 3 source categories. The total number of facilities broken down by Vista categories along with the number of unique correctly attributed facilities across all three datasets was also calculated for a direct comparison of completeness (table 2).
For all plume observations, Vista-CA GSAAM V4 correctly attributed 2384 of 2403 (99.2%) total plume observations at the facility level, excluding the 21 plumes from unknown sources described above (table 2). Only 8 plumes were attributed to incorrect Vista-CA facilities, yielding a false positive rate (mis-attributions) of 0.45% (6 times for Harris Ranch Meat Plant and 2 times for the Palos Verdes Landfill). The overall false negative rate, indicating missed attributions when there was in fact a source from manual attribution, was 0.18%. Moreover, GSAAM attributed 19.5% of the plumes to sub-facility level infrastructure with an attribution accuracy of 100% (table 2). We achieved ideal 1:1 plume-to-source attribution accuracies (100%) for three of the six IPCC source categories: 1A1 Energy Industries, 4B Biological Treatment of Solid Waste, and 4D1 & 4D2 Domestic Wastewater Treatment & Discharge, with the other three categories averaging 99.19% (figure 4).
4. Discussion
The identification, geolocation and attribution of anthropogenic CH4 emissions remains a major challenge for emissions monitoring and mitigation. We developed a method for high confidence attribution of meter scale CH4 plume observations to their emission sources at the facility scale by spatially relating the locations of airborne CH4 plume detections to geographic datasets that represent locations of potential CH4 emission sources. We demonstrate this using Vista-CA and CH4 plumes observed by AVIRIS-NG in both a manual and automated mode. We found that the vast majority of CH4 plumes in California were found in association with infrastructure known to handle or produce CH4, consistent with the expectation that these large point sources are anthropogenic, and thus potential targets for CH4 mitigation. Vista-CA and AVIRIS-NG results are visually depicted in NASA JPL's Methane Source Finder (https://methane.jpl.nasa.gov/).
We compared the ability of our Vista-CA dataset to attribute CH4 plume observations to facility-level regulatory datasets, CARB PMT and EPA FLIGHT (figure 4). Unlike GHG emission inventories that encompass emissions at the level of a state, the CARB PMT and EPA FLIGHT reporting program datasets provide facility-level spatial information and reported estimates of CH4 emissions. However, they were not as effective as Vista-CA for CH4 source attribution. The threshold for inclusion in CARB PMT and EPA FLIGHT, based on total expected facility GHG emissions, is ill suited for CH4 emissions that are characterized by fugitive sources and skewed emissions distributions that make inventories of CH4 challenging to construct. In contrast, Vista-CA was designed to assume that CH4 emissions can potentially come from any CH4 relevant infrastructure. Vista-CA includes (1) sources previously omitted from the regulatory inventories, such as composting sites and natural gas fueling stations, (2) sources with emissions expected to be too small or zero, but that might still be emitting, such as closed landfills [5], and (3) sources for which there are not readily available public maps, such as dairy farms [28]. In addition, Vista-CA has confirmed geolocations for all sources, avoiding the problem of the address of an emitter differing from the actual location of emissions, as occurs in regulatory datasets. Finally, much effort was put into delineating the geographic extents of Vista-CA sources that have large spatial extents, such as landfills. These spatial extents improve the ability of an automated model to match a plume location with its source facility compared to point locations
Proximity-based attribution methods are limited by the availability of datasets that are used to inform them. 1.6% (39/2424 plumes) of plumes that were either unknown or misattributed, come from 16 sources that are not currently included in Vista-CA: one meat processing plant; one liquified natural gas terminal; two oil and gas tanks that were not associated with an oil and gas field, facility, or refinery; five landfills; two agricultural sites; one dairy; and four related to oil and gas fields with no other spatial details. False negatives—plumes that were not attributed to any feature—persisted mainly due to inconsistent spatial coverage in the oil and gas field boundary dataset. Better accounting for the spatial extents of various facilities in Vista-CA, such as dairies, could reduce these problems, but manual digitizing of facility extents would require significant additional effort. For these more complex or confounding cases, we suggest a 'human-in-the-loop' method to reconcile some of these discrepancies.
We also distinguished facility level sources from sub-facility features in the Vista-CA dataset to improve automated source attribution. Vista-CA was originally designed with a focus on the facility level because of its relevance for mitigation activities; however, linking CH4 plume observations to sub-facility level infrastructure can give deeper insight into the process producing emissions. This has been demonstrated with AVIRIS-NG data for underground storage fields and landfills [12, 14]. We recognize that sub-facility level infrastructure included in Vista-CA is very limited, given that we rely on public databases for our data sources. This problem is most acute in oil and gas fields, which account for 122 plume attributions without more detailed sub-facility attribution. Oil fields such as Midway-Sunset can span hundreds of kilometers, but we have limited information on the oil and gas production infrastructure located therein, such as gathering pipelines, storage tanks, and other oil and gas facilities that are present but not currently included in the Vista-CA oil and gas facilities source layer. This can be further improved with more complete accounting of oil and gas production structures located within these CH4 source areas. Because of the vast extent of oil and gas fields, we include oil and gas fields at the end of the attribution tree to avoid mis-attribution of CH4 plumes located there to the oil and gas field when another possible CH4 emission infrastructure is present (e.g. a dairy located on an oil and gas field). In addition, we distinguish urban from non-urban oil and gas fields, since urban oil and gas fields are much more likely to include CH4 emission sources that are not related to oil and gas production activities.
One assumption of our approach is that the apparent origin of the plume in hyperspectral imagery is indeed its source; this may not be the case under swirling or still wind conditions [29]. This uncertainty is particularly relevant in areas densely populated with potential sources where Vista-CA facilities overlap one another or are in close spatial proximity. In industrial urban areas, for example, high spatial density of sources from multiple collocated sectors complicates source attribution.
By cataloguing all potential CH4 emission sources in Vista-CA, we add to a growing body of evidence that a small number of emitters contribute to a large fraction of the total CH4 emissions [11], with 3.3% (290/8878) of Vista-CA facilities responsible for all CH4 plumes observed by AVIRIS-NG (figure 2, table 3). Given that the spatial extent of Vista-CA is only 3.46% of California's area, both the Vista-CA spatial model and the attributions of AVIRIS-NG observations to a subset of Vista-CA allows for a more focused approach when it comes to developing mitigation strategies.
Our source attribution methodology can attribute observed CH4 plumes down to individual sub-facility infrastructure elements, enabling detailed investigation of sectoral contributions of CH4 point source emitters, comparison to reported emissions at the facility level, reporting of anomalous activity to facility operators, and investigation of emissions distributions within a source category, as demonstrated in Duren et al [11]. Moreover, we demonstrated that source attribution can be automated, enabling rapid analysis of large surveys. This is a critical step toward operationalizing airborne CH4 emissions monitoring, and similar approaches may be needed for analyzing CH4 point sources detected globally by new satellite missions [30]. A typical plume dataset from an airborne campaign consists of 2000 plumes, and requires roughly 15–20 h for manual attribution analysis with a tool like Vista in hand, which is reduced to approximately 5 min with automation, and close to 99% attribution accuracy (figure 4). While presently limited to the state of California, Vista-CA and GSAAM are useful tools for any future CH4 monitoring the state undertakes by allowing a more focused mitigation approach. We suggest the Vista approach may also be applied more broadly for CH4 point source attribution with new imaging spectrometry from airborne and spaceborne platforms. Expanding Vista globally will require additional automation and methods to deal with the different degrees of sectoral data and metadata available in different regions.
Acknowledgments
This work was supported by NASA's Advancing Collaborative Connections for Earth 337 System Science (ACCESS) Methane Source Finder project and by the Lawrence Berkeley National Laboratory under LBNL-CEC agreement PIR-17-015. A portion of the research in this study was performed at the Jet Propulsion Laboratory, California Institute of Technology, under contract with the National Aeronautics and Space Administration. Government support acknowledged. The authors are responsible for the content of the paper and the findings do not represent the views of the funding agencies.
Data availability statement
The data that support the findings of this study are openly available at the following URL/DOI: https://daac.ornl.gov/cgi-bin/dsviewer.pl?ds_id=1726.