

Abstract
Extreme precipitation is one of the most devastating forms of atmospheric phenomenon, causing severe damage worldwide, and is likely to intensify in strength and occurrence in a warming climate. This contribution gives an overview of the potential and challenges associated with using weather radar data to investigate extreme precipitation. We illustrate this by presenting radar data sets for Germany, the U.S. and the UK that resolve small-scale heavy rainfall events of just a few km2 with return periods of 5 years or more. Current challenges such as relatively short radar records and radar-based QPE uncertainty are discussed. An example from a precipitation climatology derived from the German weather radar network with spatial resolution of 1 km reveals the necessity of radars for observing short-term (1–6 h) extreme precipitation. Only 17.3% of hourly heavy precipitation events that occurred in Germany from 2001 to 2018 were captured by the rain gauge station network, while 81.8% of daily events were observed. This is underlined by a similar study using data from the UK radar network for 2014. Only 36.6% (52%) of heavy hourly (daily) rain events detected by the radar network were also captured by precipitation gauging stations. Implications for the monitoring of hydrologic extremes are demonstrated over the U.S. with a continental-scale radar-based reanalysis. Hydrologic extremes are documented over ∼1000 times more locations than stream gauges, including in the majority of ungauged basins. This underlines the importance of high-resolution weather radar observations for resolving small-scale rainfall events, and the necessity of radar-based climatological data sets for understanding the small-scale and high-temporal resolution characteristics of extreme precipitation.
Export citation and abstract BibTeX RIS

Original content from this work may be used under the terms of the Creative Commons Attribution 4.0 license. Any further distribution of this work must maintain attribution to the author(s) and the title of the work, journal citation and DOI.
1. Introduction
Understanding precipitation variability is important since the frequency and severity of extreme events have significant impacts on nature and society. Extreme precipitation is associated with hazards such as flash floods, shallow landslides, and debris flows world-wide, causing severe damage and loss of life. The characteristics of extreme precipitation are receiving more attention from the international community. There is growing evidence that precipitation extremes at the daily-scale have increased over the past few decades (e.g. Westra et al 2013, Donat et al 2016, Fischer and Knutti 2016), with potentially larger increases at sub-daily durations (e.g. Barbero et al 2017, Guerreiro et al 2018). Information for monitoring and characterization of extremes is generally derived from in-situ gauges, mainly providing daily precipitation accumulations, but recent international initiatives have produced sub-daily accumulations, mainly at an hourly time-scale (Lewis et al 2019, Alexander et al 2019). To allow for standardized assessment of extreme precipitation events, the World Meteorological Organization Commission for Climatology (WMO-CCl) and the Research Programme on Climate Variability and Prediction (CLIVAR) Expert Team on Climate Change Detection, Monitoring and Indices (ETCCDI, Karl et al 1999) have provided a list of 11 recommended indices for extreme precipitation out of 27 indices,8 all at the daily or multi-day time-scale. Indeed, most precipitation totals used to derive Intensity-Duration-Frequency (IDF) curves9 for hydro-meteorological research, weather monitoring and hydrologic structure design are not shorter than daily, although in practice (sub-)hourly estimates are highly needed for many applications, e.g. urban drainage design (e.g. Dale et al 2017, 2018).
Due to its high spatial and temporal variability, quantifying precipitation is a challenge for researchers and operational weather services. Atmospheric processes generating extreme precipitation often take place over short space (e.g. sub-kilometre) and time (e.g. sub-hourly) scales that are rarely resolved by gauges and satellite-borne systems, providing a gap in knowledge of extreme precipitation. Daily precipitation observations from station-based networks have limited spatial and temporal representativeness, with hourly observations from dense ground networks potentially underestimating point-scale precipitation extremes by as much as 20% (Schroeer et al 2018). Many, especially short-term, precipitation events are of limited spatial extent (few km2) and cannot be captured by gauge station networks. Sensors on-board satellite platforms can provide precipitation estimation with global coverage at more relevant scales but are often affected by larger quantitative uncertainty because of more indirect relations between satellite observations and surface precipitation. Sub-daily indices are not yet available to characterize precipitation extremes at the global scale (but see Alexander et al 2019, for prospects), and the corresponding precipitation frequency estimates are often derived by applying empirical scaling factors to daily estimates.
Weather radar systems are more commonly used to monitor precipitation, and radar networks are now operated by national weather services worldwide. Radar offers an interesting alternative with respect to both in-situ measurements and observations from satellites, providing areal precipitation estimates at high spatial and temporal resolution (e.g. 1–2 km and 5–10 min). However, it is only in the last 10 years that radar observations have been reprocessed with consistent correction procedures and made available for climatological applications. Here we discuss the potential and challenges in using radar networks to document extreme precipitation, with special focus on the ability of radar systems to provide information on the spatial variability of extreme rainfall events and to detect extreme precipitation events with limited spatial extent. Comprehensive catalogues of precipitation events derived from radar networks in Germany and the UK are used to determine the proportion of events missed by stations that can be exclusively captured by remote-sensing instruments. An approach to identify and compare extreme hydrological responses to heavy rainfall in ungauged areas based on radar observations is presented for the US.
2. Characteristics of extreme precipitation: how are they resolved by precipitation sensors?
Extreme precipitation has several characteristics: Orlanski (1975) presented atmospheric scales for precipitation generation, suggesting frontal systems bring long-lasting (>day) moderate to heavy rainfall on spatial scales of more than 100 km whereas the cumulus clouds and deep convection responsible for extreme short-term rainfall (10 mins to a few hours) have a spatial extent of ∼1 km. Borga et al (2008) indicated that observing convective cells requires monitoring capabilities of weather radar systems rather than gauge networks. Terink et al (2018) concluded that 12 gauges per km2 are required to capture the spatial variability of radar rainfall.
National Weather Services and other agencies have established more than 250 000 precipitation stations in the last century (Groisman and Legates 1995). One station hence represents an area of 600 km2 assuming a homogeneous distribution over 150 Mio km2 of the Earth's land surface. Yet the global distribution of gauges available from the Global Precipitation Climatology Centre (GPCC10 ) is heterogeneous, with higher densities in more populated regions and lower densities in rural and remote areas. Gauges are routinely used to represent areas of 100 to 3000 m2 from measurements taken over a few square centimetres. Interpolation of rain gauge observations is mandatory to obtain spatial information. Yet the spatial representativeness of each gauge measurement depends on the autocorrelation distance of precipitation (e.g. Delahaye et al 2015). While the autocorrelation increases with time integration, it varies greatly with precipitation regime and is typically short for extreme events. Assuming that individual convective cells have a typical size of 5 km2, only about 1% of the Earth's surface is monitored by GPCC gauges (Kidd et al 2017). Critically, the number of gauges available also depends on their temporal sampling resolution, with stations sampling at finer scales being rarer.
Rain gauges directly measure rainfall depth accumulated over time and records frequently span more than 100 years. These are therefore the best source for long-term studies of precipitation extremes and trends, but their measurements have systematic errors, causing under-catch for all rain gauge types (Michelson 2004, Pollock et al 2018). Measuring variations in drop size distribution and the vertical structure of events is essential for understanding precipitation processes but cannot be captured by rain gauges. Newer disdrometers provide information on drop size distribution but there are few worldwide and periods of record are short.
Remote sensing is the only way to explicitly observe the spatial distribution of precipitation. However, complex interactions between the spatio-temporal variability of precipitation processes, sensor resolution, sensitivity, and calibration, the indirect nature of the precipitation retrieval introduce complications. The last decade has witnessed the growing use of satellite-based remotely-sensed observations for seamless observation of precipitation over land and oceans, with quasi-global coverage for climate applications (e.g. Skofronick-Jackson et al 2017). Yet most spaceborne observations are performed with passive sensors, providing indirect observations of surface rainfall amounts. For further information on infrared (IR) and passive microwave sensors (PMW), and the accuracy of satellite algorithms, see Kirstetter et al (2012, 2014, 2018) and Stephens and Kummerow (2007). Multi-sensor precipitation retrievals, such as the Integrated Multi-satellite Retrievals for the Global Precipitation Mission (GPM) (IMERG: Huffman et al 2015), combine IR and PMW to produce near-real time estimates at high spatial and temporal resolution with quasi-global coverage (30 min, 0.1°). A detailed description and an intercomparison of current global precipitation data sets from stations and satellites can be found in Sun et al (2017).
Precipitation extremes are associated with specific generating processes, such as convection, orographic enhancement in complex terrain, landfalling hurricanes, or warm rain processes. Their microphysics, such as hail formation or collision-coalescence, require continuous 3D observations. In the last decades, weather radar systems have become a valuable tool to fill multiple observational gaps in time, surface 2D, and 3D. Through real-time, high-resolution volume scanning allowing for three-dimensional observations of precipitation events, weather radars offer new and comprehensive information on the horizontal and vertical structure of rainfall. Radar networks upgraded with dual-polarization technology give additional insights into precipitation microphysics specifically on the size, shape, orientation, and phase of hydrometeors. Ground-based weather radar data are now widely used by national weather services for quantitative precipitation estimation (QPE) at fine scales (e.g. 1 km/5 min). Radar QPE is subject to specific uncertainties (i.e. sensor calibration, attenuation depending on the radar frequency, ground clutter and beam blocking, variation of reflectivity with height, conversion from radar moments to precipitation rate, etc, e.g. Delrieu et al 2009, Villarini and Krajewski 2010, Berne and Krajewski 2013). The characterization of these uncertainties has motivated studies for several decades (Zawadzki 1982, Creutin et al 1997, Ciach and Krajewski 1999, Ciach et al 2007, Habib et al 2008, Germann et al 2009, Kirstetter et al 2010, 2015). Radar–raingauge merging approaches combining the fine spatio-temporal resolution of radar and the local accuracy of gauges have been proposed for QPE (e.g. Delrieu et al 2014) and are applied operationally (e.g. Zhang et al 2016), with novel approaches being developed to integrate uncertainty as part of the quantitative estimation process (e.g. Kirstetter et al 2015, Neuper and Ehret 2019). Radar systems reveal precipitation characteristics, including intermittency, types (e.g. stratiform, convective, snow, and hail), and rates, with better resolution and accuracy than gauges and satellites and improve knowledge on precipitation extremes.
3. Proof of concept: applications of radar data to characterize and monitor extremes
Extreme rainfall occurs relatively infrequently. Therefore, long time series of precipitation data are crucial for investigating and characterizing those extremes and their trends. Although the first weather radars were installed in 1959 by the National Weather Service in the US, time-series from radars are an order of magnitude shorter than rain gauges, spanning decades or less instead of up to two centuries. Despite the recent installation of multiple radar systems, global coverage is still limited: most parts of the USA, Europe, South-East Asia, South Africa and New Zealand are covered by radar, as well as parts of coastal regions of Australia and South America. Large parts of Asia, Africa and South America are, however, not as widely covered (GCOS-Report No. 223 2019; Saltikoff et al 2019).
While newer radar systems using dual-polarization have potential for more accurate QPE than single-polarization systems, historical radar datasets useful for trend analyses and extreme precipitation statistics mainly contain single-polarization observations. Also, reprocessing radar data is necessary to achieve homogeneous series for investigating and comparing extreme rainfall patterns over time.
Several radar-based climatological datasets exist for different regions. Croft and Schulman (1989) presented first a 5 year radar dataset of convective summer precipitation from four local radar sites in New Jersey. In Europe, Tabary (2007) was among the first to provide a 10 year precipitation reanalysis from the French radar network, followed by a 10 year data set for the Netherlands by Overeem et al (2009). Thorndahl et al (2014) and Goudenhoofdt and Delobbe (2016) presented reprocessed data sets over 11 years from single radars in Denmark and Belgium, respectively. For the conterminous United States (CONUS), products such as Stage IV11 provide blended radar-gauge hourly/4 km resolution precipitation estimates from 2002-present. The Multi-Radar/Multi-Sensor (MRMS; https://mrms.nssl.noaa.gov/; Zhang et al 2016) provides a decadal reanalysis of 5 min/0.01° radar-based precipitation rates (Zhang and Gourley 2018).
These climatological data sets can be useful for understanding the characteristics of precipitation events. Panziera et al (2018) showed that daily and sub-daily extreme precipitation are more intense along the slopes than at the crest using a 12 year radar-based climatology in the Swiss Alps. Lengfeld et al (2019) determined characteristic spatial extents of daily and hourly rainfall from a radar climatology for Germany and found that daily precipitation affects areas 5.5 times larger than hourly precipitation. Marra and Morin (2015) derived radar-based IDF-curves for 14 case studies in Israel. Soderholm et al (2017) quantified the characteristics, drivers and risks of severe thunderstorms based on an 18 year radar data set in Southeast Queensland, Australia and found that sea-breeze air masses may become favourable for convection after sufficient modification during inland propagation. To demonstrate their superior capabilities to monitor and characterize extreme precipitation we show monitoring examples from Germany and UK. We also provide insights on their capabilities for related hydrological activity in ungauged areas based on radar observations in the U.S.
3.1. Ability of radars to observe extreme precipitation events: examples from Germany and the UK
Radar networks provide comprehensive spatial coverage of precipitation events with high resolution. This is in distinct contrast to station networks that frequently miss heavy short-term precipitation events due to their limited spatial extents. The weather radar network in Germany operated by Deutscher Wetterdienst (DWD) currently consists of 17 C-band radars. An annually-updated nationwide climatological product on a 1 km grid from 2001 is freely available with more than 90% data availability (Winterrath et al 2018). A re-processing procedure has been applied to the dataset of terrain-following precipitation scans, including artefact, beam blockage and attenuation correction as well as adjustment to gauge data (Winterrath et al 2017).
From this dataset, we extracted all rainfall events that exceeded DWD's warning level 3 for extreme precipitation for 11 durations, D, between 1 h and 72 h (table 1). Assuming that the affected area increases with duration, the minimum size of events was set at 9 km2 for D < 4 h and D*3 km2 for longer events to avoid false small-scale but long-term events due to possibly remaining ground clutter. Events could not spatially overlap when occurring at the same time and two events in the same area had to have a temporal gap of
Table 1. Thresholds for heavy precipitation for event detection based on DWD's warning level 3 for severe weather. Bold values are the official warning levels for durations of 1, 6, 12, 24 and 72 h. Thresholds for other durations are interpolated from the official warning levels.
| 1 h | 2 h | 3 h | 4 h | 6 h | 9 h | 12 h | 18 h | 24 h | 48 h | 72 h | |
|---|---|---|---|---|---|---|---|---|---|---|---|
| RR [mm] | 25 | 27 | 29 | 31 | 35 | 37.5 | 40 | 45 | 50 | 60 | 90 |
to ensure spatial and temporal independence. In case the same event exceeded the warning threshold for more than one duration, the event with the highest extremity Eta according to Müller and Kaspar (2014) was chosen for the catalogue. Eta combines the return period, T, and the affected area, a, of an event:
with the number of grid points n of the event, which equals a in this case because of the spatial resolution of 1 km2, and T dependent on the rain rate R:

The coefficients u and w for each grid cell were determined from a linear regression over a partial time series comprising the L (= 2*number of years) highest precipitation rates from the radar climatology, following the guidelines provided by the German Association for Water, Wastewater and Waste DWA (2012). u and w are highly dependent on the considered duration (e.q. u typically is between 10 and 20, for 24 h it is around 40 and 70, w is around 3–5 for hourly and 5–15 for daily rainfall. The plotting position Tk for each element k of the partial time series is determined by:
where M is the length of the time series in years. A double logarithmic regression of u and w is performed over all durations to ensure for unambiguous rain rates. As a last step, fields of u and w were smoothed within a circle of 10 km around the grid cells to minimize the influence of single events with return periods clearly larger than the 18 years of radar data.
The catalogue comprises roughly 20 000 events and represents the first ever comprehensive list of extreme rainfall events occurring in Germany between 2001 and 2018. In the last two decades DWD's station network of almost 4000 stations has been halved but the number of stations providing hourly data enhanced to currently 1864 stations relatively evenly distributed, complemented by 546 stations from external sources with the same temporal resolution. A constant network is assumed during the investigation period. Each station therefore represents roughly 150 km2 of Germany. Considering the aforementioned changes to the station network, the ability to detect hourly (daily) rainfall has increased (decreased) during the 18 years of radar observations.
Figure 1(a) reveals that only 17.3% of hourly events listed in the catalogue were observed by the current rain gauge network, and only 13.7% by DWD stations. In 82.7% of the hourly events, the stations were located in areas with less extensive rainfall not exceeding the warning level 3, or the precipitation field was not observed by any of the stations. There is a higher probability of observing events with longer durations within the station network as they usually have a larger spatial extent. Figure 1(b) illustrates that for daily events there is 81.8% chance of being observed by one or more rain gauges (75.7% by DWD stations). This is highlighted by figures 1(c) and (d), showing the spatial extent of hourly and daily rainfall events from the catalogue, respectively. For hourly precipitation, many (small-scale) extreme events are not observed by the rain gauge network, while for daily precipitation only a few, small-scale, extreme events are not detected. In general, the percent missed events by gauges increases monotonely with decreasing duration between 1 and 72 h, mainly because the size of the events decreases with decreasing duration (not shown here). The limited capability of the current DWD rain gauge network to observe short-term extreme events is revealed by this study. It underlines the importance of areal observations of rainfall as provided by a radar network.
A similar analysis was performed for precipitation observations in 2014 from the weather radar network operated by the UK Met Office (UKMO), which has been recently upgraded to contain 15 C-band dual-polarisation radars with Doppler capability. We compare radar data with 5 km spatial and 1 h temporal resolution as a composite over the UK from the Nimrod database (Golding 1998, Met Office 2003) with an hourly rainfall gauge dataset for the UK quality-controlled by Blenkinsop et al (2017) and Lewis et al (2018, 2019) consisting of roughly 1350 gauges (slightly changing from hour to hour throughout the year) from the UKMO, the Environment Agency, National Resource Wales and the Scottish Environment Protection Agency. Each station represents ∼180 km2 of the UK on average, although they are denser in the south and east of the UK and become less dense moving northwards.
The warning levels from DWD are not applicable for Nimrod data due different precipitation climatologies and instead their 99th percentile was used to determine extreme precipitation events for each duration. If an event was considered 'extreme' for more than one duration, only the one with the highest precipitation amount was included. Due to the coarser spatial resolution of 5 km for the radar data, the minimum size for sub-daily events was set to 75 km2 and for daily events to 100 km2. The rain gauge station network captured only 36.6% of the hourly extreme precipitation events in 2014 (figure 2(a)) and 52% of extreme daily precipitation events. The spatial distribution of hourly and daily events (figure 2(c) and d, respectively), indicates that longer events dominate in the maritime UK climate compared to the continental climate of Germany, whereas more short-duration (hourly) events were detected. This may be due to differences in the definition of extreme events between the two datasets, in the minimum size for sub-daily events, and in the station network density.
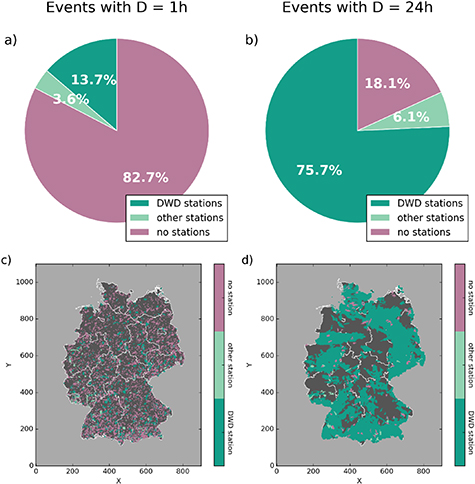
Figure 1. Events in Germany between 2001 and 2018: (a) Percentage of hourly events that are observed by DWD rain gauge stations (dark green), other stations (light green) and events that are not observed by any station (violet), (b) Same as (a) for daily events. Spatial extents of hourly (c) and daily (d) events. Dark and light green represent events that are observed by DWD and other stations, respectively, violet indicates events that are not measured by stations.
Download figure:
Standard image High-resolution image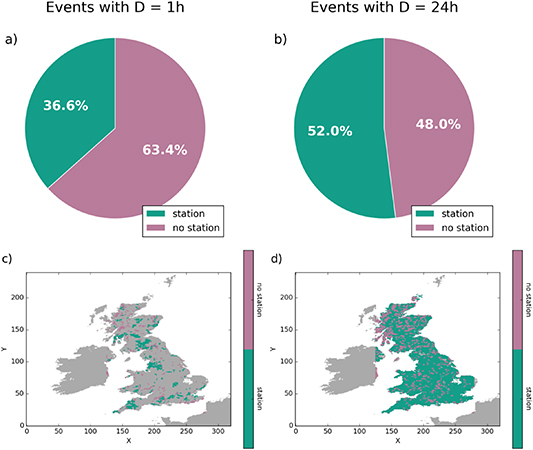
Figure 2. Same as figure 1, but for Nimrod data for 2014.
Download figure:
Standard image High-resolution image3.2. U.S. radar reanalysis for investigation of hydrologic extremes
Stream gauge networks are often as limited in capturing the spatial variability of stream discharge as rain gauge networks are in capturing the spatial variability of precipitation. In the U.S., automated streamflow measurements are collected by the U.S. Geological Survey (USGS) at ∼10 000 gauges, leaving large areas unmonitored. Radar precipitation reanalyses can be used to monitor hydrological activity beyond gauged basins and to identify hydrological hotspots.
The U.S. NEXRAD radar network operated by the National Weather Service (NWS) involves 159 S-band weather radars. It was upgraded with dual-polarimetry technology beginning in 2013. Studies have evaluated the potential of NEXRAD radar-based precipitation for frequency analysis (e.g. Durrans et al 2002, Eldardiry et al2015) and highlighted quantitative uncertainties for extreme precipitation. To address this challenge, Kirstetter et al (2015) proposed probabilistic QPEs to interpret radar measurements in terms of the likelihood of observing extreme precipitation. The MRMS framework developed at the NOAA/National Severe Storms Laboratory and the University of Oklahoma mosaics quality-controlled radar moments onto a common 3D grid, corrects for error sources (e.g. beam blockage due to mountain, range effects, bright band), and delivers a suite of high-resolution severe weather and hydrological products including precipitation type and rates Zhang (et al 2016). At the hourly time step, MRMS adjusts radar estimates with automated rain gauge networks. A high resolution 0.01°/5 min MRMS reanalysis created for the time period from 2001 to 2011 provides the basis for extreme precipitation frequency analysis.
The MRMS reanalysis is used here as forcing for the Ensemble Framework For Flash Flood Forecasting (EF5) to generate a hydrological reanalysis that extends and regionalizes hydrologic extremes monitoring from gauged basins to a 1-km grid covering the CONUS. EF5 is a distributed hydrologic model matching the MRMS resolution designed to simulate real-time discharge at flash flood scale to support the U.S. NWS operations (Gourley et al 2017). Note that the hydrologic model has skill over most of the CONUS with the exception of the mountainous west where lower quality precipitation estimates from degraded radar coverage impairs the simulations. Unit peak discharges (discharge normalized by drainage area) are simulated over the ∼10 year period to generate a flash flood climatology. To focus on extreme flood conditions, the mean annual maximum unit discharge values from 2002–2011 are computed at every grid pixel and shown in figure 3 along with the locations of USGS stream gauges. With 10 M+ pixels, the radar-based hydrologic reanalysis documents hydrologic extremes over ∼1000 times more locations than stream gauges, allowing identification and comparison of extreme hydrological activity in ungauged areas. Figure 3 highlights the West Coast, Arizona, the Front Range, Flash Flood Alley in central Texas and a band of flood-prone areas extending from southwestern Texas to Oklahoma, Arkansas, Kansas, and Missouri. These findings are consistent with the study by Saharia et al (2017) focusing on flood severity over the U.S.

Figure 3. The mean annual maximum unit discharge [m3.s−1.km−2] simulated by EF5 with MRMS precipitation from 2002–2011. Black dots indicate the location of USGS gauges.
Download figure:
Standard image High-resolution image
4. Conclusions
Precipitation is a key factor in the climate system and its observation remains a challenge. In particular, short-duration extreme precipitation lasting an hour or less and covering only a few km2 cannot be captured satisfactorily by widely-used rain gauge networks or satellites. We have demonstrated that the gap between rain gauge networks and satellite observations can be filled by weather radar networks, providing precipitation measurements at high temporal and spatial resolution. The challenges with radar observations are known within the community and are addressed in the processing chain from raw data to QPE. Despite relatively short time series of 10–20 years, radar networks are already providing valuable new insights into extreme precipitation processes.
An example from the German radar climatology with spatial resolution of 1 km revealed the necessity of radars for observing short-term extreme precipitation. Only 17.3% of hourly heavy precipitation events that occurred in Germany from 2001 to 2018 were captured by the rain gauge network, while 81.8% of daily events were observed. This result is underlined by a similar study using data from the UK radar network for 2014. Only 36.6% (52%) of heavy hourly (daily) rain events detected by the radar network were also captured by precipitation gauges. Implications for the monitoring of hydrologic extremes are demonstrated over the U.S. with a continental-scale radar-based reanalyses. Hydrologic extremes are documented over ∼1000 times more locations than stream gauges.
In the coming years, time series from radars will become longer and the spatial coverage around the globe is constantly growing (Saltikoff et al 2019). Improvements in radar technology (e.g. the use of dual-polarisation) will lead to enhanced data quality and provide new parameters to investigate the development of extreme precipitation events, their typical spatial extent and duration, and precipitation type. New precipitation estimation approaches (e.g. integrating uncertainty) open new perspectives in the quantification of extremes. Therefore, precipitation climatologies derived from weather radar networks are and will be an essential tool for understanding characteristics of extreme precipitation and to study its variability related to global warming in the future.
Acknowledgments
The German radar climatology data utilised, originates from the project 'Generation of a decadal radar-based high-resolution precipitation climatology for Germany for the retrieval of recent changes in precipitation extremes (short title: Radar Climatology)' that has been a joint research project of the Strategic Agencies' Alliance 'Adaptation to Climate Change' among the Federal Office of Civil Protection and Disaster Assistance (BBK), the Federal Institute for Research on Building, Urban Affairs and Spatial Development (BBSR), the Federal Agency for Technical Relief (Bundesanstalt Technisches Hilfswerk, THW), the German Environment Agency (Umweltbundesamt, UBA), and the German Weather Service (Deutscher Wetterdienst, DWD). HJF is supported by the INTENSE project funded through the European Research Council (grant ERC-2013-CoG-617329), the NERC-funded FUTURE-STORMS project (NE/R01079X/1) and by the Wolfson Foundation and the Royal Society as a Royal Society Wolfson Research Merit Award (WM140025) holder. Pierre Kirstetter acknowledges support through the NASA Precipitation Measurement Missions award NNX16AE39G and #80NSSC19K0681, the NASA Ground Validation Program award NNX16AL23G, the NOAA GOES-R Risk Reduction Science Program award NA16OAR4320115, and the NOAA Joint Technology Transfer Initiative award NA17OAR4590170.
Data availibility statement
The data that support the findings of this study are partly openly available. The German radar climatology data can be found at DOI: 10.5676/DWD/RADKLIM_RW_V2017.002. The German hourly gauge data is openly available in the database of the DWD https://opendata.dwd.de/climate_environment/CDC/observations_germany/climate/hourly/precipitation/. The UK radar climatology data can be found at https://catalogue.ceda.acuk/uuid/f91b2c5399c5bf689e29bb15ab45da8a. The UK hourly gauge data is detailed in Lewis et al (2018) and can be obtained directly from the authors, after licensing issues have been addressed. The EF5 discharge simulation data over the CONUS that support the findings of this study are available upon request from the authors.
Footnotes
- 8
The total ETCCDI list can be retrieved from http://etccdi.pacificclimate.org/list_27_indices.shtml.
- 9
e.g. NOAAs Atlas 14 with point precipitation frequency estimates on https://hdsc.nws.noaa.gov/hdsc/pfds/index.html.
- 10
Number of rain gauges per 1° grid cell in the GPCC Precipitation Climatology Version 2018 retrievable from https://kunden.dwd.de/GPCC/Visualizer_intro?p_dataset=gpcc_normals_v2018_10&p_coast=1&p_art=3&p_out=0&p_season=17&p_scale=1.4&p_year=2019&p_as=0&p_zoom=1&p_area=0&p_lonmin=–180.&p_lonmax=%2B180.&p_latmin=–90.&p_latmax=%2B90.&p_color=1&p_proj=1.
- 11
U.S. National Stage IV QPE Product available from http://www.emc.ncep.noaa.gov/mmb/ylin/pcpanl/stage4/.