

Abstract
The availability of seasonal weather forecast information in Africa has potential to provide advanced early warning of rainfall variability, informing preparedness actions to minimise adverse impacts. Obtaining accurate forecast information for the spatial scales at which decisions are made is vital. Here we examine the impact of spatial scales on the utility of seasonal rainfall forecasts in Africa. Using observations alongside seasonal forecasts from the European Centre for Medium-Range Weather Forecasts (ECMWF), we combine measures of local representativity and skill to assess optimal spatial scales for anticipating local rainfall conditions. The results reveal regions where spatial aggregation of gridded forecast data improves the quality of information provided at the local scale, and regions where forecasts have useful skill without aggregation. More generally this study presents a novel approach for evaluating the utility of forecast information which is applicable both globally and at all timescales.
Export citation and abstract BibTeX RIS

Original content from this work may be used under the terms of the Creative Commons Attribution 4.0 license. Any further distribution of this work must maintain attribution to the author(s) and the title of the work, journal citation and DOI.
1. Introduction
Millions of livelihoods across Africa rely on rain-fed agriculture as their main source of income and food. Rainfall is a major water source for crops in Africa and therefore rainfall deficits can lead to reduced soil moisture, low yield (Rockström et al 2003, Traore et al 2013, Black et al 2016) with impacts on food security (Khan et al 2014, Adebayo et al 2014). Accurate forecasts of seasonal rainfall variability (i.e. forecasts of seasonal rainfall at lead times of one to several months ahead) are vital to help decision-makers anticipate and prepare for drought conditions that could be detrimental to rain-fed agriculture.
To help anticipate drought events in Africa, the main source of operational seasonal forecast information available to decision makers are regional consensus seasonal rainfall forecasts produced and disseminated by the Regional Climate Outlook Forums (RCOFs) in Southern, Western and Eastern Africa (O'Brien et al 2003, Tarhule and Lamb 2003, Ogallo et al 2008). Each RCOF reviews current climatic conditions alongside a variety of seasonal forecast information from dynamical and statistical models for the coming season to produce a regional 'consensus' forecast (Ogallo et al 2008). The consensus forecast is summarised by a regional map indicating the probability of seasonal total precipitation falling within tercile categories. Fixed tercile probabilities are issued over relatively large areas or zones, on the order of several 100 km, considered more likely to experience the same seasonal rainfall variability. This is justified by the assumption that the main source of predictive skill at seasonal timescales is from large-scale forcings (such as anomalous sea-surface temperatures; SSTs) which typically drive a large-scale atmospheric response, in turn generating relatively spatially homogeneous anomalous rainfall signals (Haylock and McBride 2001, Moron et al 2006, 2007).
While RCOF forecasts have some prediction skill (e.g. Mason and Chidzambwa 2008, Hansen et al 2011, Bliefernicht et al 2019, Walker et al 2019), issuing fixed tercile probabilities over large regions is problematic as it increases the likelihood that the forecast information is irrelevant for sub-regional scales, particularly over regions with marked spatial variability in rainfall due to localised features such as topography (Patt and Gwata 2002). Finer horizontal-scale forecast information however is available from dynamical models which predict the evolution of physical processes in the climate system on a horizontal grid. Dynamical forecasts of seasonal rainfall exhibit predictive skill at lead times of 0 to 5 months over East Africa during the October-November-December short rains season (Mwangi et al 2014, Ogutu et al 2017, Walker et al 2019) and over southern Africa during December-January-February (Weisheimer and Palmer 2014). Moreover, seasonal forecasts from dynamical models may have more skill than regional RCOF forecasts, as has been shown during the short rains over East Africa (Walker et al 2019). This suggests that skillful dynamical forecast information at sub-regional spatial scales could be more useful for decision making.
Spatially coarse (e.g. 200–300 km) model predictions are commonly transformed to more locally relevant, finer spatial scales using dynamical and statistical downscaling methods. Dynamical downscaling is the approach of nesting high-resolution regional model simulations within those of a spatially coarse global climate model, whereas statistical downscaling calibrates coarse simulations to local long-term observations using various techniques such as bias correction, regression analysis and spatial interpolation. Although both approaches may improve seasonal prediction skill in Africa (Landman et al 2009, Siegmund et al 2015, Kipkogei et al 2017) sometimes they result in no clear skill improvements relative to coarse simulations (Diro et al 2012, Nikulin et al 2018). Since seasonal predictions from dynamical models are increasingly moving towards higher resolutions (< 100 km, e.g. MacLachlan et al 2015, Johnson et al 2019), this highlights the importance of assessing whether current seasonal dynamical forecasts are both skillful and relevant for local scales in Africa.
Taking into account the spatial scales at which seasonal forecast information is issued is important if the forecast is to be both representative of, and skillful (able to accurately predict anomalous conditions) for, local scales. Even in the presence of a spatially homogeneous large-scale circulation regime, tropical rainfall is highly localised due to the erratic nature of convection and complexity of surface characteristics such as orography. Since fine-scale rainfall fields are thus highly spatially heterogeneous (noisy), spatial aggregation of a gridded rainfall forecast may reduce this less predictable heterogeneity (noise) by elucidating the more predictable signal due to the large-scale circulation (Gong et al 2003). Consequently, spatial aggregation may increase forecast skill (Gong et al 2003, Diro et al 2012, Chardon et al 2016), but comes with the obvious disadvantage of losing representativity of local conditions. This trade-off of course depends on the 'regime' of spatial variability, as illustrated in an idealised sense by figure 1. Over regions where rainfall variability is spatially homogeneous (potentially because of the influence of a large-scale driver, for example), spatial aggregation may provide little benefit, leading to only small increases in forecast skill (figure 1(a)). In contrast, spatial aggregation may substantially improve skill over a spatially heterogeneous rainfall region especially if the forecast initially has poor skill at smaller spatial scales (figure 1(b)). However in such cases, spatial aggregation will also lead to a large loss of representativity. There is therefore an obvious trade-off between spatially aggregating to maximise skill without losing representativity if a forecast is to be usable for sub-regional scales. A representative forecast is useless if it has no prediction skill, whereas a skillful forecast is useless if it is not-representative.

Figure 1. Schematics depicting idealised relationships between the horizontal spatial resolution (spatial aggregation scale) of rainfall and the estimation/prediction skill (left y-axis), and representativity of local rainfall conditions (right y-axis), for (a) spatially homogeneous and (b) spatially heterogeneous regimes of spatial rainfall variability. Skill can be defined as the accuracy of rainfall predicted by a weather forecast relative to some observational reference data.
Download figure:
Standard image High-resolution imageThe aim of this paper is therefore to investigate the impact of spatial scale on the representativity and skill of regional seasonal forecast information for providing information on drought risk at local scales. We explore these aspects using rainfall observations and seasonal forecasts from a dynamical forecast model, described further in section 2. This is followed by the results and conclusions in Sections 3 and 4.
2. Methods and data
2.1. Methodological approach
Our overarching aim is to investigate the representativity and skill of regional seasonal forecast information for anticipating local rainfall conditions in Africa. We analyse seasonal total rainfall during the four calendar seasons of December-January-February (DJF), March-April-May (MAM), June-July-August (JJA), September-October-November (SON), assessing the utility of regional information of the interannual variability of seasonal rainfall, with emphasis on measuring variability of the seasonal rainfall distribution using tercile categories. Whilst it could be argued that finer quantile categories (e.g. quintiles or deciles) might provide more detailed and 'useful' information on the seasonal rainfall distribution, terciles are analysed here since they are the primary format used to communicate seasonal forecast information to users. It should further be noted that the agricultural sector in Africa is highly sensitive to rainfall variability and even variability that is not statistically extreme (i.e. lower tercile events) is likely to have widespread and severe impacts.
2.1.1. Evaluating representativity
We use high horizontal resolution (0.05°) rainfall observations (section 2.2.1) to quantify representativity of regional rainfall variability of local conditions. We measure regional representativity by linearly correlating regional-mean with local inter-annual seasonal rainfall observations using Pearson's correlation coefficient. Correlation magnitudes can range between -1 (negative linear correlation) to 0 (no linear correlation) to 1 (positive linear correlation). Positive correlations close to 1 indicate strong co-variability of regional and local rainfall and thus high representativity. Conversely, positive (or negative) correlations close to 0 indicate weak or no co-variability and thus little to no-representativity. Correlations are only presented if they are statistically significantly different from a correlation of zero at the 95% confidence level (p-value < 0.05) computed using a two-tailed t-test.
We also quantify regional representativity of the inter-annual variability of the seasonal rainfall distribution as summarised by tercile categories. We measure this using the probability of detecting (POD) the observed local tercile, using the tercile observed at the regional scale, defined as follows:
Where, H is the total number of hits, i.e. the number of times that the local tercile is correctly detected by the regional tercile, and M is the total number of misses, i.e the number of times that the local tercile is not detected by the regional tercile, for a given tercile category. POD values therefore range from 0 to 1, with 1 representing perfect local tercile detection and 0 indicating that all local tercile events were missed. Computing the POD in observations therefore provides an indication of the maximum possible representativity that could be obtained if a regional tercile forecast was perfect.
2.1.2. Evaluating skill
We evaluate the skill of ensemble seasonal rainfall hindcasts (re-forecasts) from a dynamical forecast model, which are gridded at a horizontal resolution of 1° (section 2.2.2). Skill is evaluated in two ways. First, we quantify the potential 'local' skill of this type of forecast information by verifying the 1° predictions against 0.05° observations. Second, we quantify the impact of spatial aggregation on forecast skill by verifying the predictions aggregated to different spatial scales against observations aggregated to the same spatial scales as the model.
We use two skill scores to verify the skill of the ensemble seasonal hindcasts. Ensemble mean skill is assessed using the Anomaly Correlation Coefficient (ACC); the Pearson correlation between the observed anomalies and forecast anomalies. The ACC ranges from -1 to 1, with positive values indicating agreement between the observed and hindcast anomalies. ACCs are deemed statistically significantly different from a correlation of zero using the 95% confidence level (p-value < 0.05). Note that for a given season, observed anomalies are computed relative to the observed climatology, whereas hindcast anomalies are computed relative to the hindcast climatology. Moreover, anomalies for each year are always computed with the year removed from the respective climatology to simulate an independent skill evaluation.
We also assess the skill of tercile probabilities from the hindcasts using the Relative Operating Characteristic (ROC) Area which measures the ability of the hindcast probabilities to discriminate events for a given tercile category. The ROC area is the area under a ROC curve, created by plotting the hit rate against the false alarm rate for different hindcast probability thresholds for the tercile category of interest. ROC Area values of 1 correspond to perfect discrimination, values of 0.5 correspond to no discrimination skill and are equivalent to the skill of random chance (equal likelihood of a hit and false alarm), and values < 0.5 indicate that events may be discriminated but mislabelled. The statistical significance (p-value < 0.05) of the ROC Area values are calculated using a Mann-Whitney U test (Mason and Graham 2002). For each year in a given season, respective tercile boundaries in observations and hindcasts are computed with the year of interest removed from the corresponding observed and hindcast climatologies.
2.1.3. Combining representativity and skill
As described in section 1, skill and representativity must be examined in tandem in order to find the optimal spatial scale to use a forecast (e.g. figure 1). We illustrate this within the context of tercile forecasts, by determining the amount of spatial aggregation required to reach a certain threshold of forecast skill, whilst maintaining a reasonable level of representativity of the local scale. The optimal spatial scale is the scale at which the hindcasts meet pre-defined thresholds of both tercile skill and representativity metrics defined previously (sections 2.1.1 and 2.1.2). To find the optimal spatial scale, we apply the following two-step process:
- (a)As model skill depends on spatial scale and can be improved by applying spatial aggregation to obtain the skillful spatial scale (Von Storch et al 1993), we first compute the skillful spatial scales for each grid-box of the hindcasts. We define this as the smallest spatial aggregation scale at which the tercile hindcast probabilities satisfy a skill threshold when evaluated against observations at the same scale. Using the ROC Area, the skill threshold applied is that at which the ROC Area is statistically significant at the 95% level (p < 0.05) computed from a Mann-Whitney U test. This ensures that the skill threshold is both statistically robust and sufficiently large to exceed the skill of random chance.
- (b)We obtain the representativity of the skillful spatial scales found in (a) using the POD representativity metric at the equivalent scale in the observations. If the POD at that scale satisfies the pre-defined representativity threshold, then the forecast is considered both skillful and representative. Otherwise, the forecast is considered not-representative.
2.2. Data
2.2.1. CHIRPS rainfall observations
For reference rainfall observations, we use seasonal rainfall totals accumulated from daily rainfall estimates from the Climate Hazards Group InfraRed Precipitation with Station data (CHIRPS) version 2.0 (Funk et al 2015a). CHIRPS is ideal for examining spatial rainfall variability due to its high spatial resolution of 0.05° and complete long-term daily record from 1981 to present. CHIRPS rainfall estimates are derived from geostationary infrared satellite retrievals of cloud top temperature merged with available rain gauge data. We use CHIRPS for the period 1983 to 2017 as CHIRPS is more reliant on re-analysis rainfall during the early 1980s, due to missing satellite data over Africa during this period (Knapp et al 2011, Dinku et al 2018). Evaluations against rain gauge observations show that CHIRPS performs very well over many regions of Africa (Tote et al 2015, Funk et al 2015a, Maidment et al 2017, Muthoni et al 2019) especially when accumulated over timescales of several days to months (Dinku et al 2018, Ayehu et al 2018). However, it should be highlighted that, like all satellite-gauge based rainfall estimates, CHIRPS will be more uncertain over regions with low gauge density, such as central Africa (Funk et al 2015a).
2.2.2. Dynamical hindcasts of seasonal rainfall
We analyse hindcasts repetition of seasonal total precipitation produced by the European Centre for Medium-Range Weather Forecasts (ECMWF) seasonal forecasting System 5 (SEAS5, Johnson et al 2019) obtained from the Copernicus Climate Change Service (C3S) Climate Data Store (Raoult et al 2017). The hindcasts have 25 ensemble members, are at a horizontal resolution of 1° and span the 24 year period of 1993-2016. 23 re-forecast samples are used per season to keep sample sizes the same as DJF (e.g. DJF 1994 includes December 1993, January 1994 and February 1994). We use hindcasts initialised at a lead time of 1 month before the start of the season, which is within the timescale at which seasonal forecast information is utilised for decision-making. We additionally analysed hindcasts from three other dynamical seasonal forecasting systems produced by the UK Met Office, Météo France and Deutscher Wetterdienst. However, for brevity we only present results for SEAS5 because it has highest overall skill compared to the other models. Skill results for all models are presented in Supplementary Material (stacks.iop.org/ERL/15/094023/mmedia).
3. Results and discussion
3.1. Representativity of regional forecasts at the local scale
Comparisons between representativity and spatial scale for wet seasons at five locations in Africa are illustrated in figure 2. As spatial scale is increased, both the correlation between regional and local inter-annual rainfall variability and the POD for the lower tercile category decrease at a rate highly dependant on location (figures 2 (c) and (d)). This location-dependence of representativity can be seen by examining both metrics at 5°; a typical spatial scale at which a regional forecast might be issued. At three locations (Zambia, Somalia, DRC), regional-local rainfall is strongly positively correlated (> 0.9) and the POD is relatively high (> 0.8) suggesting that regional variability is highly homogeneous and thus representative of local variability there. In contrast, lower correlations at Fort Portal, Uganda and the Jos Plateau, Nigeria where the topography is complex, reveal that the regional scale is less-representative due to highly localised inter-annual variability due to orographic effects and the characteristics of convective systems.

Figure 2. (a) Topographic map of Africa (height in meters above sea-level; m.s.l.) and (b) magnification of Fort Portal, Uganda and the surrounding region illustrating the context of different spatial scales. Coloured stars in (a) mark five locations used for (c) Pearson correlations (statistically significant at the 95% level) between CHIRPS seasonal rainfall totals at nominal spatial resolution of 0.05° and areal mean rainfall in  square regions surrounding each 0.05° location. (d) Probability of Detecting (POD) lower tercile events at 0.05° using the tercile observed from areal mean rainfall in
  square regions surrounding each location in (a). Panels (e)-(h) show mean total seasonal rainfall and (g)-(j) show the Pearson correlations between seasonal rainfall observed at 0.05° and areal mean rainfall in
  square regions surrounding each 0.05° pixel between 1983 and 2017. Correlations in panels (c) and (i)-(l) are only shown where they are statistically significant at the 95% level and where seasonal mean rainfall totals are > 100 mm as outlined by the black contour. The geographic coordinates of the four locations are provided in table S1.
Download figure:
Standard image High-resolution imageThe representativity of the typical spatial scale of a regional forecast varies seasonally and spatially across Africa, as shown by mapping correlations between regional (5°) and local (0.05°) interannual variability at every 0.05° grid-box in the CHIRPS data (figures 2(i)–(l)). High correlations indicate regionally homogeneous interannual variability, highlighting regions where seasonal rainfall is modulated by large-scale drivers. Such regions include southern Africa (DJF wet-season), East Africa (MAM; long rains and SON; short rains) and the Guinea Coast of southern West Africa (JJA; West African monsoon) where rainfall variability is known to be strongly linked to large-scale drivers (Black et al 2003, Cook et al 2004, Hastenrath 2007, Nicholson 2013, Cretat et al 2019, e.g.). Strong spatial homogeneity in inter-annual variability over East Africa during the short rains corroborates with previous studies (Moron et al 2007, Camberlin et al 2009). Conversely, lower correlations indicate increasingly localised variability and exhibit more complex spatial patterns over central Africa and highland areas, including the Ethiopian, Cameroon and Guinea Highlands, and the East African Rift system (c.f. figure 2). Such regions experience high interannual variability in deep convection (Hart et al 2019), are where convective systems preferentially form (Rowell and Milford 1993, Laing and Fritsch 1993, Hodges and Thorncroft 1997, Laing et al 2008, Jackson et al 2009), and rainfall is locally enhanced by orography (e.g. Kamara 1986, Nicholson 1996). Crucially, these correlation maps suggest that regional-scale forecasts of seasonal rainfall, such as those produced by RCOFs, are more likely to be representative and therefore locally useful over southern Africa and East Africa where there is strong co-variability between regional and local seasonal rainfall. Note that these representativity results may be less certain over some regions with low gauge density in CHIRPS (e.g. Central Africa). However, the spatial precipitation patterns estimated by CHIRPS can be treated with some confidence since they are highly dependant on satellite observations of deep convective systems, underpinned by a high-resolution climatology (Funk et al 2015a,b).
The local representativity of regional forecasts also depends on whether their information content (i.e. tercile probabilities) is a representative indicator of local conditions. This is evaluated by mapping the local tercile POD when using the terciles observed at the regional spatial scale of 5° in CHIRPS (figures 3(a)–(h)). Unsurprisingly, POD values for the below normal tercile are high over regions of homogeneous inter-annual variability and low over regions of heterogeneous variability, introduced previously in figure 2. Similar spatial patterns and magnitudes of POD are found for the above normal tercile category as shown in figure S1 in Supplementary Material. However, for the normal category the POD is substantially lower (< 0.6), revealing frequent disagreement between the regional tercile and normal tercile observed at the local scale. This disagreement might be expected since by definition the normal category is more constrained, requiring rainfall totals to fall within both the lower and upper boundaries of the category. Conversely, single boundaries for the lower and upper terciles are more likely to be crossed in the presence of a large-scale anomalous atmospheric signal driven by external forcing. However, the low POD for the normal category strongly emphasises that the information content of any regional tercile forecast of the normal category, is frequently unrepresentative and therefore has little value for decision-making at local scales. This is of particular concern for regional scale tercile forecasts issued by RCOFs of the normal category, which tend to be over-forecast and for which the probabilities are generally not reliable (Mason and Chidzambwa 2008, Hansen et al 2011, Bliefernicht et al 2019, Walker et al 2019). In contrast, re-calculating the POD using a regional scale of 1° instead of 5° causes a widespread increase (POD > 0.7) in representativity even over heterogeneous rainfall regions. This marked increase can be explained by the fact that the smaller spatial scale of 1° is much closer to the spatial correlation scales of rainfall variability from convective systems at seasonal timescales (Lebel and Le Barbe 1997, Ali et al 2003, Maidment et al 2013). Therefore a skillful tercile forecast at a spatial scale of 1° could be highly relevant for local monitoring. Skillful forecasts at even smaller spatial scales may yield higher representativity over some regions (e.g. figure 2(d) observed POD ≥ 0.8 at spatial scales ≤ 1°). However, the relatively high POD at 1° is encouraging since 1° is approximately the typical spatial scale at which gridded dynamical forecasts are available for users.
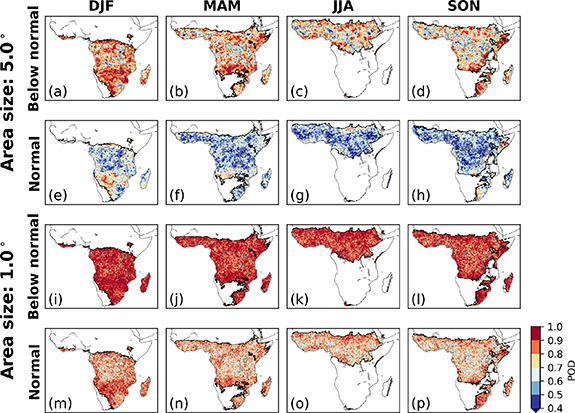
Figure 3. Probability of detecting (POD) the local (0.05°) interannual rainfall tercile using the tercile derived from the  (below normal, (a)-(d); normal, (e)-(h)) and
  (below normal, (i)-(l); normal, (m)-(p)) regional mean during DJF, MAM, JJA and SON, 1984-2017. POD values are only shown where seasonal mean rainfall totals are > 100 mm as outlined by the black contour. Results for the above normal tercile category are shown in figure S1 in Supplementary Material.
Download figure:
Standard image High-resolution image3.2. Skill of dynamical seasonal forecasts at the local scale
An assessment of the prediction skill of 1° SEAS5 hindcasts verified against the 0.05° CHIRPS observations is shown in figure 4. Regions of ensemble mean skill (ACC > 0) and lower tercile probability skill (ROC Area > 0.5) are very similar, with the skill patterns consistent with a spatially coarser evaluation of SEAS5 at 2.5° by Johnson et al (2019). Similar skill patterns are also found for the above normal tercile category, and in hindcasts from three other dynamical models (see figures S2-S5 in Supplementary Material). Statistically significant high skill regions include Southern Africa (DJF), East Africa (DJF, SON) and southern West Africa (JJA), where seasonal rainfall has known predictability (Weisheimer and Palmer 2014, Mwangi et al 2014, Ogutu et al 2017, Walker et al 2019) due to strong teleconnections with SST variability particularly in the Pacific (via the El-Ni o Southern Oscillation; ENSO) and Indian Oceans (Mason et al 1996, Nicholson and Jeeyoung 1997, Indeje et al 2000). Over high skill regions the SEAS5 hindcasts can therefore be expected to provide skillful predictions of the expected sign of the seasonal rainfall anomalies and the lower and upper terciles of the rainfall distribution. In contrast, no skill (ACC ≤ 0, ROC Area = 0.5) is present over areas in Central Africa, Northern West Africa (JJA, SON), Southern Africa and orographic regions, where deep convective activity is frequent (Bennartz and Schroeder 2012, Hart et al 2019) and precipitation processes are complicated by localised orographic effects (Kamara 1986, Oettli and Camberlin 2005). Note that the lack of statistically significant skill regions are a likely consequence of the relatively short hindcast period analysed. The overall skill patterns are comparable with the representativity results described in section 3.1. Regions of statistically significant high skill are strongly concomitant with the spatially homogeneous and thus representative regional rainfall regions presented in figures 2 and 3. Higher forecast skill over regions experiencing larger spatial scales of rainfall variability has also been shown at sub-seasonal timescales by Moron and Robertson (2020). This is expected since regions of highly spatially homogeneous rainfall variability are more likely to represent areas where the rainfall variability is driven by more predictable large-scale anomalous conditions (Haylock and McBride 2001, Moron et al 2006, Moron et al 2007).
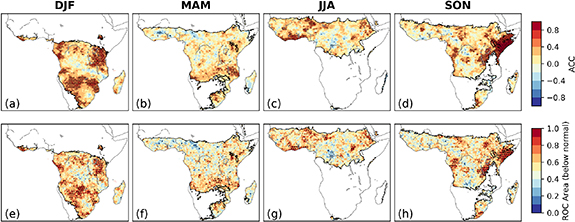
Figure 4. Evaluation of SEAS5 prediction skill at 1° using CHIRPS at 0.05°. Panels (a)-(d) show the skill of the ensemble mean measured using the Anomaly Correlation Coefficient (ACC) and (e)-(h) show skill for lower tercile probabilities using the Relative Operating Characteristic (ROC) Area. Stippling denotes regions where skill scores are statistically significant at the 95% confidence level (p < 0.05) and skill scores are only shown where seasonal mean rainfall totals are > 100 mm as outlined by the black contour.
Download figure:
Standard image High-resolution image3.3. Impact of spatial aggregation on skill
Figure 5 shows the dependence of SEAS5 skill on spatial aggregation when evaluated against CHIRPS at the same spatial aggregation scales at the five locations introduced previously in figure 2. The skill dependence with spatial aggregation is highly variable between the locations which have been chosen specifically to illustrate the 'regimes' of skill and representativity introduced in figure 1. Livingstone and Southern Somalia (SON) are locations with skill within homogeneous regions, whereas Northern DRC and Southern Somalia (MAM) are locations with no-skill within homogeneous regions (c.f. figure 5 and figures 2(c) and (d)). In contrast, the Jos Plateau is a location with skill within a heterogeneous region, while Fort Portal is a location with no-skill within a heterogeneous region. While spatial aggregation increases skill at Southern Somalia (MAM), Northern DRC and Fort Portal, it has no impact on skill in Southern Somalia (SON) and even degrades skill at Jos Plateau. Moreover, the skill response to spatial aggregation can be different for the ensemble mean compared to the lower tercile probabilities (e.g. Livingstone). Skill increases with aggregation may indicate locations where aggregation helps to reduce the less-predictable noise of localised rainfall variability, isolating the large-scale predictable rainfall signal (Gong et al 2003). However, skill increases with aggregation may also be due to the conflation of gridpoints from neighbouring regions with higher skill. In contrast, skill degradation with aggregation may indicate locations where aggregation conflates neighbouring regions with different climatic rainfall regimes and/or low skill. These results also reveal that the skill response to aggregation can be opposite over locations with similar representativity. For example, skill increases with aggregation at Fort Portal and decreases with aggregation at Jos Plateau even though both are located within relatively spatially heterogeneous regions. Moreover, even if spatial aggregation improves skill, representativity may be substantially lost (e.g. Fort Portal, c.f. figure 1). These combined impacts of aggregation emphasise the importance of using representativity alongside skill to decide whether spatial aggregation is useful.
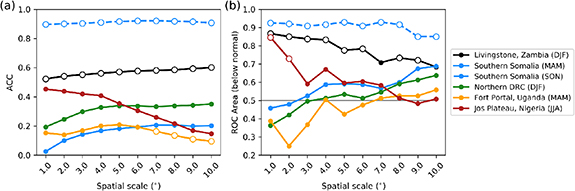
Figure 5. (a) Anomaly Correlation Coefficient (ACC) and (b) Relative Operating Characteristic (ROC) Area for the below normal tercile category as a function of spatial aggregation scale at five locations in Africa during 1994-2016. SEAS5 is verified against CHIRPS at the same spatial scales. Open circles denote skill scores which are statistically significant at the 95% confidence level (p < 0.05).
Download figure:
Standard image High-resolution image3.4. Optimal spatial scales for presenting seasonal forecast information
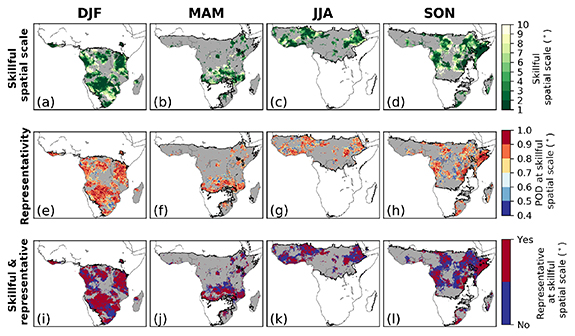
Finally, we combine skill and representativity to map out the optimal spatial scales for presenting seasonal forecast information across Africa, using SEAS5 as an example (figure 6). The spatial aggregation scales at which the SEAS5 tercile probabilities of below normal rainfall exhibit skill are shown in figures 6(a)–(d) (see figures S6 and S7 in Supplementary Material for equivalent results for the above normal and near-normal tercile categories). Aggregation is not required over spatially homogeneous rainfall regions where SEAS5 is already skillful at 1° (e.g. Southern and East Africa, c.f. figures 2 and 4). However, increasing aggregation is typically required towards the edges of such regions. In these transition regions, seasonal rainfall variability progressively becomes less predictable at smaller scales because of the stronger influence of more localised rainfall processes and weaker influence of large-scale drivers. The skill threshold is not exceeded over areas of Central Africa, East Africa, West Africa, Madagascar and the outer regions of the domain, highlighting deficiencies in skillful seasonal prediction there which cannot be sufficiently resolved by spatial aggregation.
Figure 6. (a)-(d) spatial aggregation scales at which the ROC Area for lower tercile probabilities from SEAS5 hindcasts for each season are statistically significant ( ) according to a Mann-Whitney U test. (e)–(h) probabilities of detecting (POD) the local tercile observed at 0.05° by CHIRPS using the tercile observed at the 'skillful' spatial aggregation scales in (a)–(d). (i)–(l) yes/no maps delineating areas where the spatial aggregation scales of skill (a)–(d), have a POD of the lower tercile in (e)–(h) greater than 0.75. In each panel grey areas denote regions where the ROC Area threshold is not fulfilled by spatial aggregation. Results are only shown where seasonal mean rainfall totals are
  mm as outlined by the black contour.
Download figure:
Standard image High-resolution image
We next present the 'local' representativity of the skillful aggregation scales using the CHIRPS lower tercile POD at the skillful spatial aggregation scales of SEAS5 at each grid-box (figure 6(e)–(h)). Over many regions where hindcasts meet the skill criteria without aggregation, such as East Africa (SON), the POD is near 1 and thus the native 1° scale of the model is both skillful and representative of local conditions. Conversely, locations where spatial aggregation both satisfies the skill criteria and exhibits relatively high POD values (e.g. > 0.7) are extensive but more localised. Many areas where substantial spatial aggregation is needed to obtain skill (> 5°) are associated with POD < 0.5, highlighting regions where skill gains from aggregation reduce the utility of the forecast because of the large representativity lost.
To help delineate such regions, we finally apply a representativity threshold of 0.75 to the POD values in figure 6(e)–(h) to combine skill and representativity, showing where the skillful aggregation scales of the hindcasts are locally useful (figure 6(i)–(l)). Skillful and representative locations are spatially variable and not only limited to the more predictable homogeneous rainfall regions (e.g. central Africa). Although such results depend on the skill and representativity thresholds used, they provide an example of the type of approach which could be used to diagnose the utility of seasonal forecast information alongside spatial scale, while allowing a user the flexibility to choose thresholds relevant to their risk aversion and requirements of the forecast information.
4. Conclusions
Due to the marked spatial variability of rainfall across Africa, it is important that the spatial scales at which seasonal forecast information is presented are optimised such that forecasts are both representative and skillful at scales most relevant for decision making. Consequently, we have examined the impact of spatial scale on the representativity and skill of seasonal forecast information in Africa. The main conclusions are summarised as follows:
- (1)Representativity: Regional and local scale seasonal inter-annual rainfall variability is highly correlated over areas of East, Southern and West Africa, and thus regional scale seasonal forecast information, including that summarised using lower and upper terciles of the rainfall distribution, can be highly representative over such regions. However, near-normal tercile events at regional and local scales frequently disagree and therefore the normal tercile category at a regional scale is unrepresentative over most regions of Africa.
- (2)Skill: 1° gridded ensemble mean and probabilistic tercile hindcasts from the SEAS5 dynamical seasonal forecasting model have highest skill over representative regions in Africa where seasonal rainfall has known predictability due to strong teleconnections with large-scale drivers. These results are also reflected in three additional dynamical forecasting systems (see Supplementary Material). Spatially aggregating the hindcasts may increase skill over regions with low skill.
- (3)Representativity and Skill: An approach applied to assess the optimal spatial scales to maximise representativity and skill of gridded seasonal forecast information reveals that spatial aggregation can both maintain representativity and improve skill over certain regions with low forecast skill. However, in more predictable climates, seasonal forecasts should be presented at their native scale to maximise representativity. This approach can be applied to other forecasting models, globally and at all timescales.
Overall, these findings have important implications for both providers and users of regional-scale seasonal forecast information. Regional forecast providers, particularly those involved in producing the RCOF consensus forecasts, should consider alternatives to issuing regional forecasts of the normal tercile and also consider moving towards issuing more locally-relevant, higher spatial resolution forecasts guided by available information on the seasonal forecast skill of dynamical models. Users must interpret regional-scale seasonal forecasts of the normal tercile category with great caution, including regional forecasts issued over regions with heterogeneous inter-annual rainfall variability.
It is also important to stress that the conclusions based on CHIRPS may be less reliable over regions with low gauge density (e.g. central Africa) which is an unavoidable source of uncertainty in observing rainfall variability in Africa (Washington et al 2013, Maidment et al 2015). Additionally, our results are based upon seasonal forecast data provided by the Copernicus Climate Change Service's Climate Data Store, which is freely available to users, but limited to a relatively short hindcast period (24 years) and a horizontal resolution of 1°. Short hindcasts may limit obtaining robust estimates of model skill (Barnston et al 2012, Shi et al 2015). Moreover, the original horizontal resolution of the SEAS5 model is ∼ 35 km; almost three times higher than the SEAS5 data available on the Climate Data Store. Whilst higher resolution forecasts like this could be even more representative of local conditions (figures 2(c)–(d)), these data are not as accessible to users in Africa, and our analysis of CHIRPS shows that data at scales of 1° can still be highly representative (figure 3). Future work will examine these aspects alongside the relationship between spatial scale, skill and representativity at sub-seasonal timescales and its impacts on other agriculturally-relevant metrics, such as soil moisture and dry spells.
Acknowledgments
The research leading to this publication has been supported by the climate division of the National Centre for Atmospheric Science and the Global Challenges Research Fund, via Atmospheric hazard in developing Countries: Risk assessment and Early Warning (ACREW) (NE/R000034/1). VH was self-funded when contributing to this research during her time at the University of Reading, and is now supported by a NERC GW4+ Doctoral Training Partnership studentship from the Natural Environment Research Council (NE/L002434/1). EB also acknowledges the support of SatWIN-ALERT (NE/R014116/1) and DRiSL (NE/R014272/1). DA is supported by a studentship implemented by CIMMYT as part of Taking Maize Agronomy to Scale in Africa (TAMASA), made possible by the generous support of the Bill and Melinda Gates Foundation (BMGF).
Data availability
The data that support the findings of this study are openly available. The CHIRPS v2.0 data are available from https://www.chc.ucsb.edu/data and the seasonal forecast data can be accessed through the Copernicus Climate Change Service Climate Data Store at https://cds.climate.copernicus.eu/. The representativity and skill data presented in figure 6 are openly available from the University of Reading Research Data Archive at DOI:10.17864/1947.252.