

Abstract
Meeting the increasing global demand for agricultural products without depleting the limited resources of the planet is a major challenge that humanity is facing. Most studies on global food security do not make projections past the year 2050, just as climate change and increasing demand for food are expected to intensify. Moreover, past studies do not account for the water sustainability limits of irrigation expansion to presently rainfed areas. Here we perform an integrated assessment that considers a range of factors affecting future food production and demand throughout the 21st century. We evaluate the self-sufficiency of 165 countries under sustainability, middle-of-the-road, and business-as-usual scenarios considering changes in diet, population, agricultural intensification, and climate. We find that under both the middle-of-the-road and business-as-usual trajectories global food self-sufficiency is likely to decline despite increased food production through sustainable agricultural intensification since projected food demand exceeds potential production. Contrarily, under a sustainability scenario, we estimate that there will be enough food production to feed the global population. However, most countries in Africa and the Middle East will continue to be heavily reliant on imports throughout the 21st century under all scenarios. These results highlight future hotspots of crop production deficits, reliance on food imports, and vulnerability to food supply shocks.
Export citation and abstract BibTeX RIS

Original content from this work may be used under the terms of the Creative Commons Attribution 4.0 license. Any further distribution of this work must maintain attribution to the author(s) and the title of the work, journal citation and DOI.
1. Introduction
The increasing demand for agricultural products as a result of demographic growth and dietary transitions is raising new concerns on the extent to which humanity will be able to continue to feed itself with the limited resources of the planet (Godfray et al 2010, Foley et al 2011, Kummu et al 2017). According to some predictions global crop production will need to at least double by 2050 to meet projected food demand resulting from population growth and the ongoing shift to richer diets (Godfray et al 2010, Tilman et al 2011, Alexandratos and Bruinsma 2012). At the same time, it is necessary to ensure food security for the 821 million people now chronically undernourished (United Nations 2018). However, current crop yield trends do not put us on track to double food production by 2050 (Ray et al 2013). The combination of current levels of chronic malnutrition, rapid population growth, changes in diets and predicted stagnation or even decreases in crop yields is alarming (e.g. Brown 2012).
Previous studies have assessed the avenues by which humanity can meet future food needs by reducing demand and/or increasing production (e.g. Foley et al 2011). For instance, there are ways to moderate food demand by decreasing meat consumption and shifting to plant-based diets (Cassidy et al 2013, Jalava et al 2014, Davis et al 2014), reducing food waste (Kummu et al 2012), minimizing inefficiencies in resource use through improved technology and management (Springmann et al 2018), optimization in the spatial distribution of crops (Davis et al 2017), or more efficient fertilization and watering techniques (e.g. Jägermeyr et al 2016). Other studies have estimated ways to increase food production by sustainably increasing crop yields on existing croplands, while preventing agricultural expansion into biodiversity-rich ecosystems (Phalan et al 2011, Garnett et al 2013, Pretty 2018). In fact, it has been estimated that much of the world's croplands can still attain higher crop yields potentially increasing crop production by 45%–70% (Mueller et al 2012). Importantly, narrowing yields gaps—the difference between biophysical potential yield and current yield (Lobell et al 2009, Van Ittersum et al 2013)—in underperforming croplands will enhance food self-sufficiency in developing countries where almost all the increase in food demand will come from (Alexandratos and Bruinsma 2012).
Water and nutrients are important factors limiting crop production (Mueller et al 2012). While advances in technologies have allowed humanity to economically produce fertilizers (Erisman 2008), water still remains a major limiting factor constraining crop production (e.g. Falkenmark and Rockstrom 2004, D'Odorico et al 2018). Sustainable irrigation expansion to enhance crop yields on current water-limited rain-fed croplands has recently received particular attention as a viable strategy to meet the increasing demand for food (Rosa et al 2018, 2020). Sustainable irrigation expansion ensures that freshwater stocks are not depleted and environmental flows are maintained, while preventing agricultural expansion into biodiversity-rich ecosystems (Rosa et al 2019). Currently, 500 million small farms world-wide (most of which are rain-fed croplands), provide approximately 80% of food consumed in the developing world (United Nations 2018). Hence, by sustainably expanding irrigation onto rain-fed croplands in locations where sustainable irrigation is deemed feasible (Rosa et al 2018, 2020), crop production and food availability can be increased without incurring in the environmental impacts arising from the expansion of the land footprint of agriculture into pristine ecosystems. The focus here is on water resources as the limiting factor to yield gap closure because nutrient limitations can be overcome through fertilizer applications. Conversely, irrigation water scarcity can seldom be addressed with physical water transfers, as irrigation water volumes are too cumbersome and heavy to be transported over long distances.
The extent to which yield gaps will be narrowed will also depend on climate change, which is expected to decrease crop productivity in major global breadbaskets (Schleussner et al 2018, Aggarwal et al 2019, Vogel et al 2019). Climate change will alter yields through changes in temperature, precipitation, insect pests, and atmospheric concentration of CO2 (Lobell and Gourdji 2012, Warszawski et al 2014, Deutsch et al 2018, Ostberg et al 2018). Importantly, yields are likely to be reduced in low-input agricultural systems characterized by large yield gaps (Rosenzweig et al 2014). For example, rain-fed croplands will be severely exposed to more unpredictable rainfall and precipitation patterns (Rojas et al 2019, Fitton et al 2019).
Most studies on global food security do not make projections past the year 2050 (e.g. Godfray et al 2010, Fader et al 2013), just as climate change and increasing demand for food are expected to intensify. Moreover, previous studies have accounted for major drivers of global food production and demand independently, without considering the full-suite of factors that will affect future food security: population growth, dietary changes, climate change, and the extent by which crop yield gaps can be sustainably narrowed with the limited freshwater resources of the planet.
Here we assess food production and demand throughout the 21st century. Food production is evaluated by accounting for changes in crop yields due to climate change for four major crops under three Representative Concentration Pathway (RCP) scenarios (IPCC 2014, Warszawski et al 2014) and assuming that current yields will be boosted through sustainable irrigation expansion (Rosa et al 2018), to 80% of yield potential. Using the agricultural demand indicators of three Shared Socio-economic Pathways (SSP) (O'Neill et al 2014, Riahi et al 2017, Popp et al 2017), we assess changes in plant- and animal-based demand in diets, while also accounting for different population growth forecasts. While the SSP scenarios allow for an increase in cropland area, here we use them only to infer future dietary shifts without changing the spatial extent of farmland. Rather, we account for the increase in crop production that would result from the sustainable intensification of agriculture. Indeed, the goal of this study is to evaluate the extent to which it is possible to sustainably meet the increasing food demand without further encroachment of agriculture into natural ecosystems. By combining food demand and production, we assess self-sufficiency ratios for 165 countries, considering different scenarios of population growth, climate change, and dietary changes under sustainable irrigation expansion.
This analysis sheds light on possible pathways of food self-sufficiency in the 21st century in the context of food availability. This study solely considers the food availability pillar of food security and does not consider food access and utilization (Sen 1981, FAO 2002). Nevertheless, food security depends on the ability of agricultural lands to produce enough food to meet rising demand. Thus, here we focus on the sustainable intensification of agriculture through irrigation, complementing previous studies on food system resilience and economic access to food (Puma et al 2015, Suweis et al 2015, Seekell et al 2017, Kinnunen et al 2020). Self-Sufficiency ratios inform us about which countries may produce enough crops to meet their domestic demand, and which will likely depend on international food trade to feed their population (Puma et al 2015, Suweis et al 2015, Seekell et al 2017). The results of this study could be used to determine future hotspots of crop production deficits or surpluses, the reliance of countries on food imports (Macdonald 2013, Porkka et al 2013), and their vulnerability to food supply shocks (Puma et al 2015, Marchand et al 2016).
2. Methods
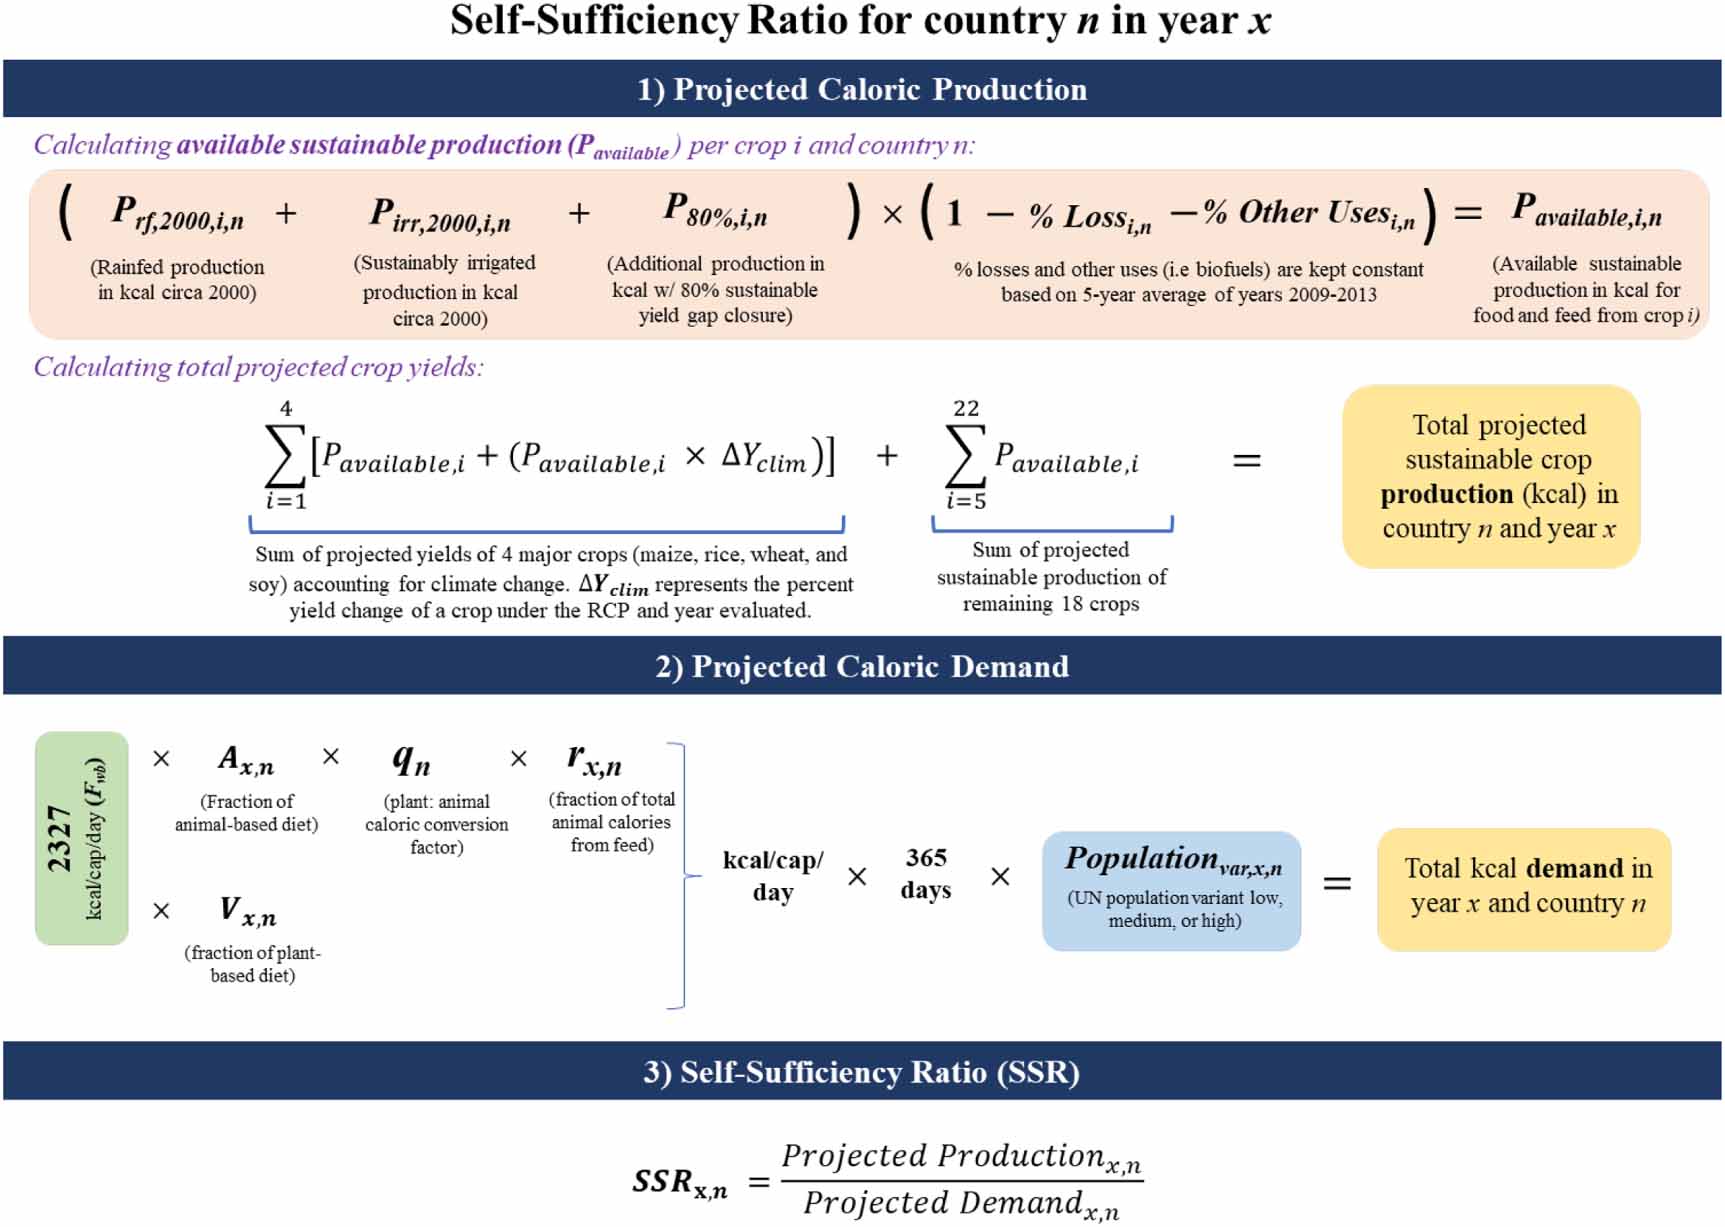
We define self-sufficiency as the ability of a country to meet the caloric demand of its population through domestic food production in a given year. The country-specific self-sufficiency ratios (SSR) are measured as the total estimated kcal production divided by the total estimated kcal demand of each individual country for the years 2030, 2050, 2080, and 2100. A country is considered self-sufficient (in terms of food availability) if it has an SSR of 1 or greater (>1 indicates a surplus), while a country with an SSR less than 1 is not self-sufficient. For countries that are not self-sufficient, the number of people that cannot be fed is derived by subtracting the self-sufficiency ratio from 1 and multiplying by the projected population of the respective country. Figure 1 shows the conceptual framework used to assess the projected production and demand in the 21st century.

Figure 1. Self-sufficiency ratio framework. This figure shows the methodological framework used to carry-out our analysis. Note that  depends on RCP;
  and
and  depend on SSP; and population variant depends on scenario evaluated.
Download figure:
Standard image High-resolution imageProjected food production is a function of sustainable irrigation expansion, and changes in yield due to climate change (figure 1). We assume that current yields for 22 crop classes will be boosted to 80% of yield potential through sustainable irrigation intensification globally (Rosa et al 2018). The percentage of losses and other uses (e.g. biofuels) per crop were calculated as the five-year average of the 2009–2013 period (FAO 2017a) and assumed to remain constant. Estimates of percent yield change under climate change were derived for the four major crops (rice, maize, wheat and soy) under three RCP scenarios (RCP 2.6, RCP 6.0, and RCP 8.5) from five global gridded crop models (GGCMs) (GEPIC, LPJ-GUESS, LPJmL, PEGASUS, and pDSSAT) forced by the bias-corrected global climate model HadGEM2-ES from the Inter-Sectoral Impact Model Intercomparison Project (ISIMIP) (van Vuuren et al 2011, Taylor et al 2012, Rosenzweig et al 2014, Warszawski et al 2014, Ostberg et al 2018). The multi-model mean of percent yield change ( ) for the four major crops was calculated for each of the three RCPs for the years 2030 to 2100. The projected production accounting for climate change for maize, rice, wheat and soybean was then added to the current available production data of the remaining 18 crops (without accounting for possible effects of climate change) to find the total available production in kilocalories for food and feed (Pavailable) for each country, year, and RCP scenario.
Projected demand is a function of dietary changes and population growth forecasts (figure 1). Under SSP1, diets with low-animal calorie shares prevail; under SSP2 caloric consumption and animal calorie shares converge towards moderate levels; and under SSP3 diets with higher animal shares prevail (Riahi et al 2017, van Vuuren et al 2017, Fricko et al 2017, Fujimori et al 2017, Popp et al 2017). The annual fractions of animal-based consumption and vegetal-based consumption of per capita diets were extrapolated from the IIASA agricultural demand data (SSP Database Version 2.0) (Riahi et al 2017, Popp et al 2017). We assumed that for human well-being, an individual should consume a daily energy requirement, Fwb, of 2327 kcal per capita per day (e.g. D'Odorico et al 2019a). The diet scenarios considered in this study differ in the fraction of animal and plant products consumed, but not in the caloric intake itself, which is assumed to be constant. In order to calculate the crop calorie demand from animal products (i.e. the feed demand), the plant to animal caloric conversion factors (q) per country and the initial fraction of total animal calories from feed-fed production (r) were taken from Davis et al (2014). We estimated the total annual projected caloric demand per country by multiplying the per capita demand by the estimated population of a country under the corresponding population variant (var) (figure 1). Population estimates were taken from the United Nations (2019) World Population Prospects which include low, medium, and high population variants (United Nations 2019). We define three main scenarios in which we group these factors—sustainability, middle-of-the-road, and business-as-usual. Under the sustainability scenario, we pair the low climate change scenario (RCP 2.6), diets with low animal-calorie shares (SSP1), and the low population variant. Under the business-as-usual scenario, we pair the high climate change scenario (RCP 8.5), diets with high animal-calorie shares (SSP3), and the high population variant. The middle-of-the-road scenario pairs RCP 6.0, with moderate diets (SSP2), and the medium population variant (Riahi et al 2017, Popp et al 2017). A more detailed description of the methods is in the Supplementary Materials (available online at stacks.iop.org/ERL/15/095004/mmedia).
3. Results
3.1. Future food demand
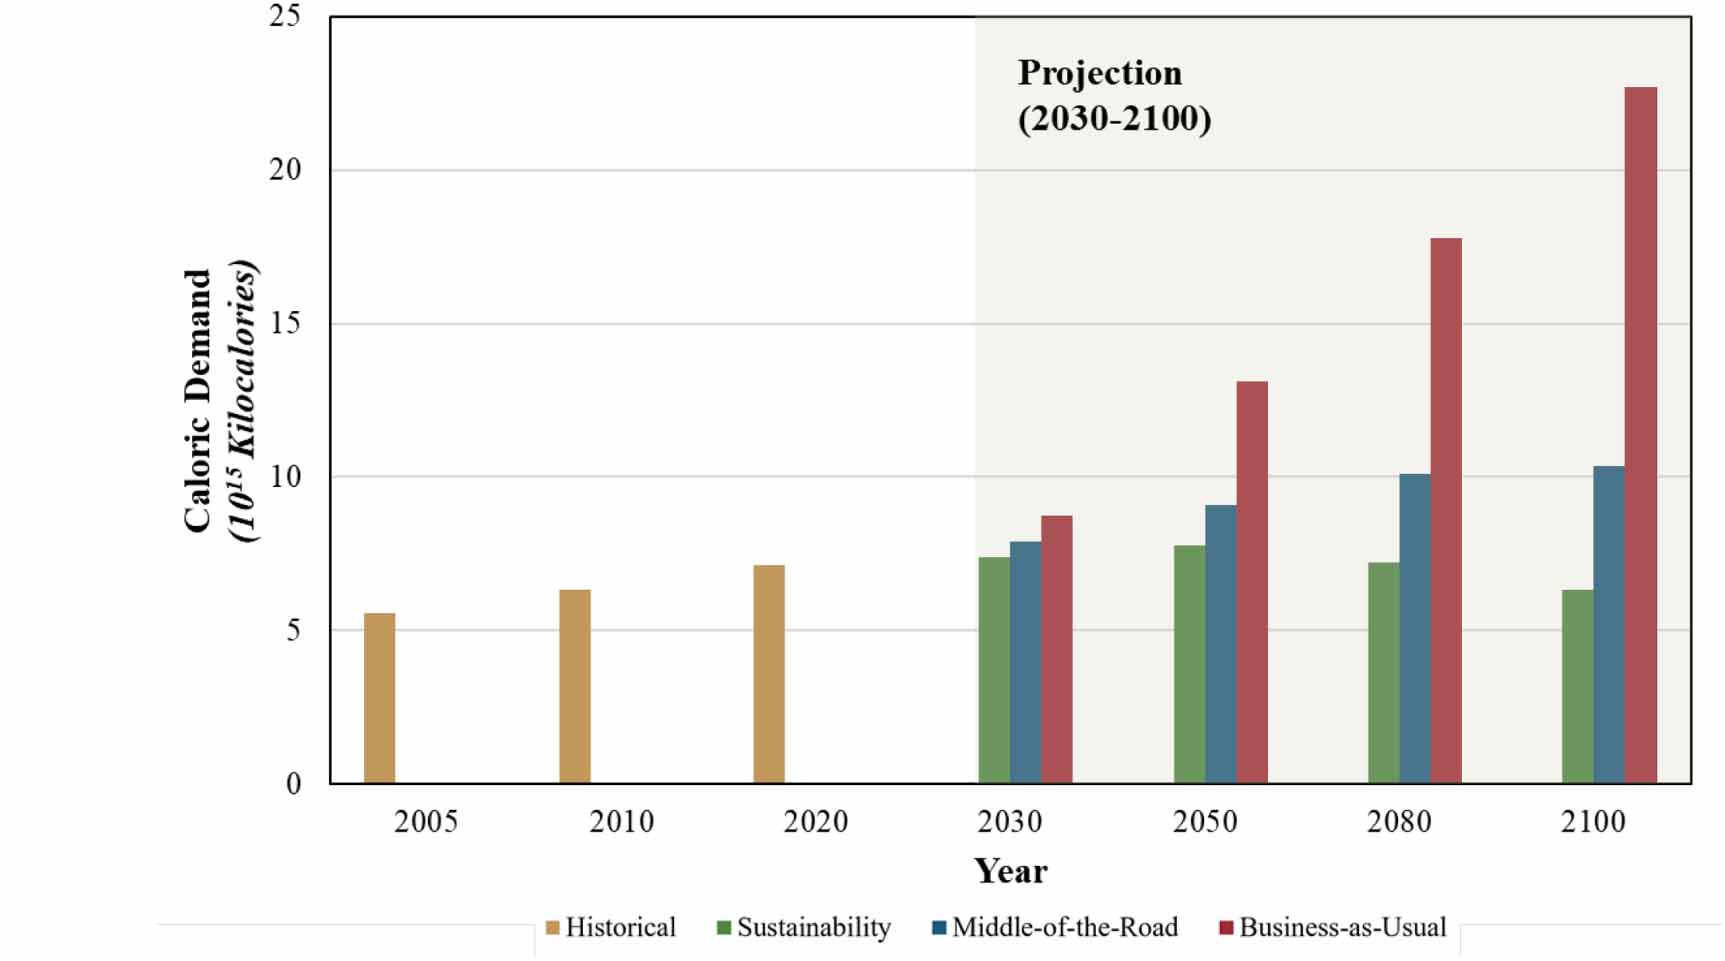
We find that future food demand will strongly depend on the population estimates and future diets of the scenario pursued. Under the sustainability scenario, food demand for crops and animal products increases gradually until mid-century and then decreases by 12% by 2100 compared to 2019 (figure 2). Under the middle-of-the-road scenario food demand for crops and animal products increases by approximately 45% by the end of the century. Under the more conservative sustainability and middle-of-the-road scenarios, the share of animal-based products in diets will range from 5% to 12% globally, respectively. Under a business-as-usual scenario, animal-based product consumption may be up to 52% in OECD countries and will increase in every region. We find that current food production will have to triple by 2100 to meet demand under business-as-usual (figure 2).

Figure 2. Global caloric demand in the 21st century. This figure shows the historical (gold) and projected global caloric demand from 2005–2100 based on the projected dietary trends paired with low, medium, and high population growth estimates for the sustainability (green), middle-of-the-road (blue), and business-as-usual (red) scenarios, respectively.
Download figure:
Standard image High-resolution image3.2. Self-sufficiency in the 21st century
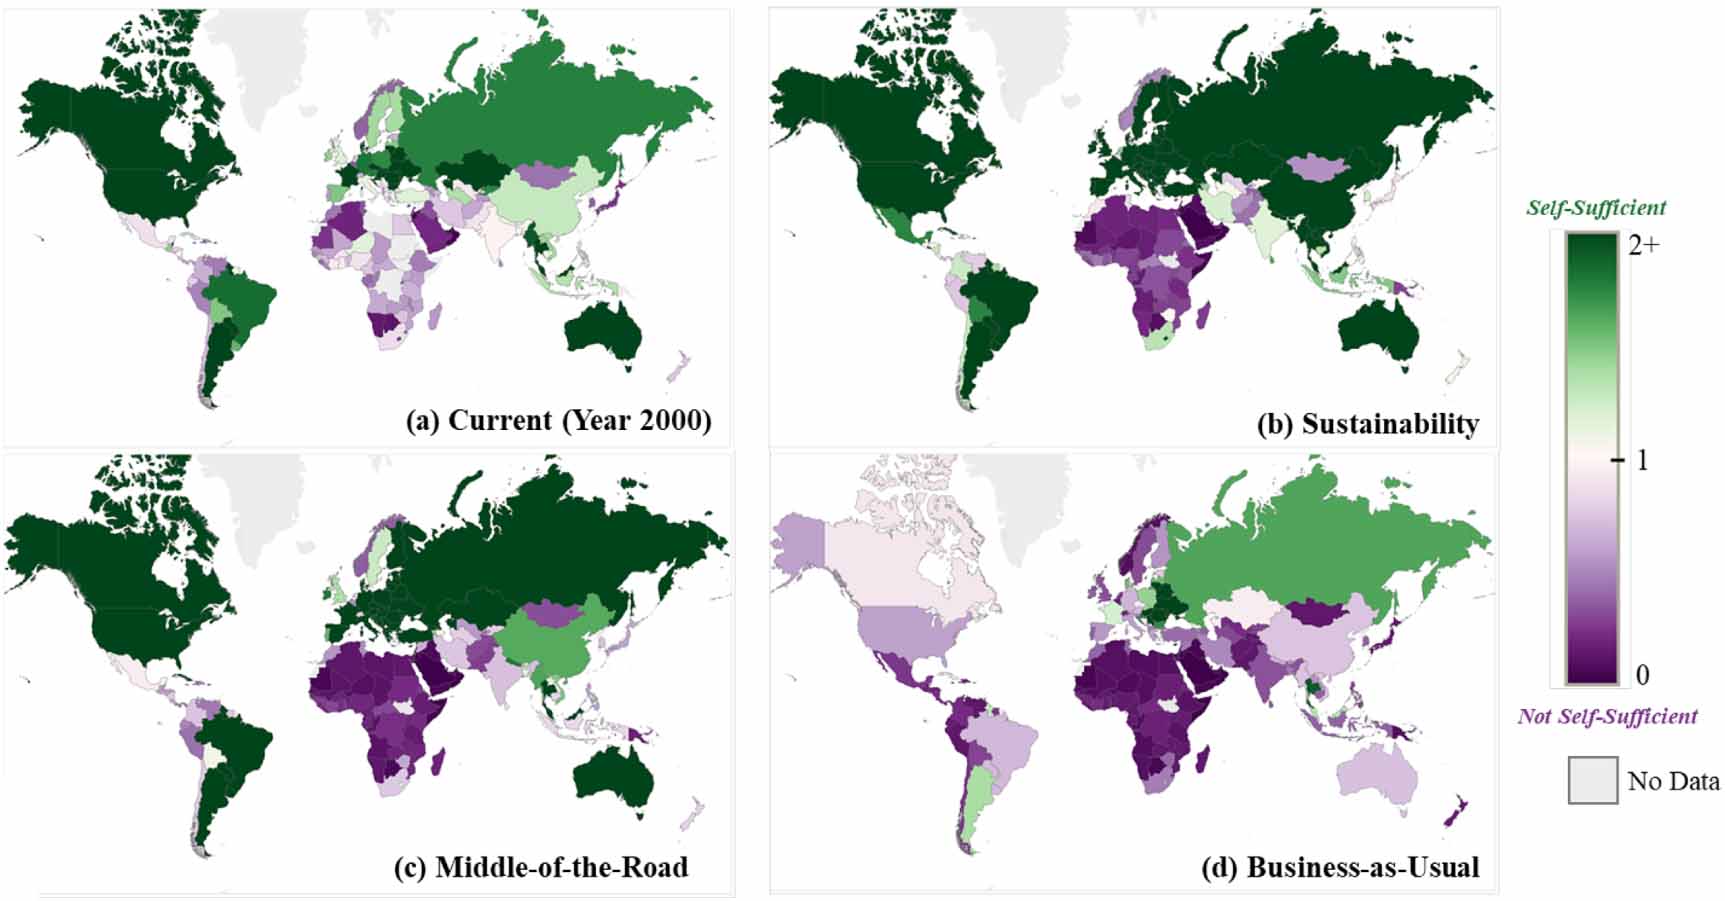
We currently produce enough food globally to feed today's global population (Holt-Giménez et al 2012). In year 2000 most countries were self-sufficient and there was enough excess food production in certain regions to meet demand with trade in countries that were not self-sufficient (figure 3(a)).

Figure 3. Global self-sufficiency ratios in the 21st century. This figure displays current country-specific self-sufficiency ratios in year 2000 (a) and projected country-specific self-sufficiency ratios in year 2100 under the three scenarios considered in this study—sustainability (b), middle-of-the-road (c), and business-as-usual (d). A country is considered self-sufficient if it has a SSR of 1 or greater (>1 indicates a surplus) shown in green, while a country with an SSR of less than 1 will not be self-sufficient (purple).
Download figure:
Standard image High-resolution image3.3. Sustainability scenario
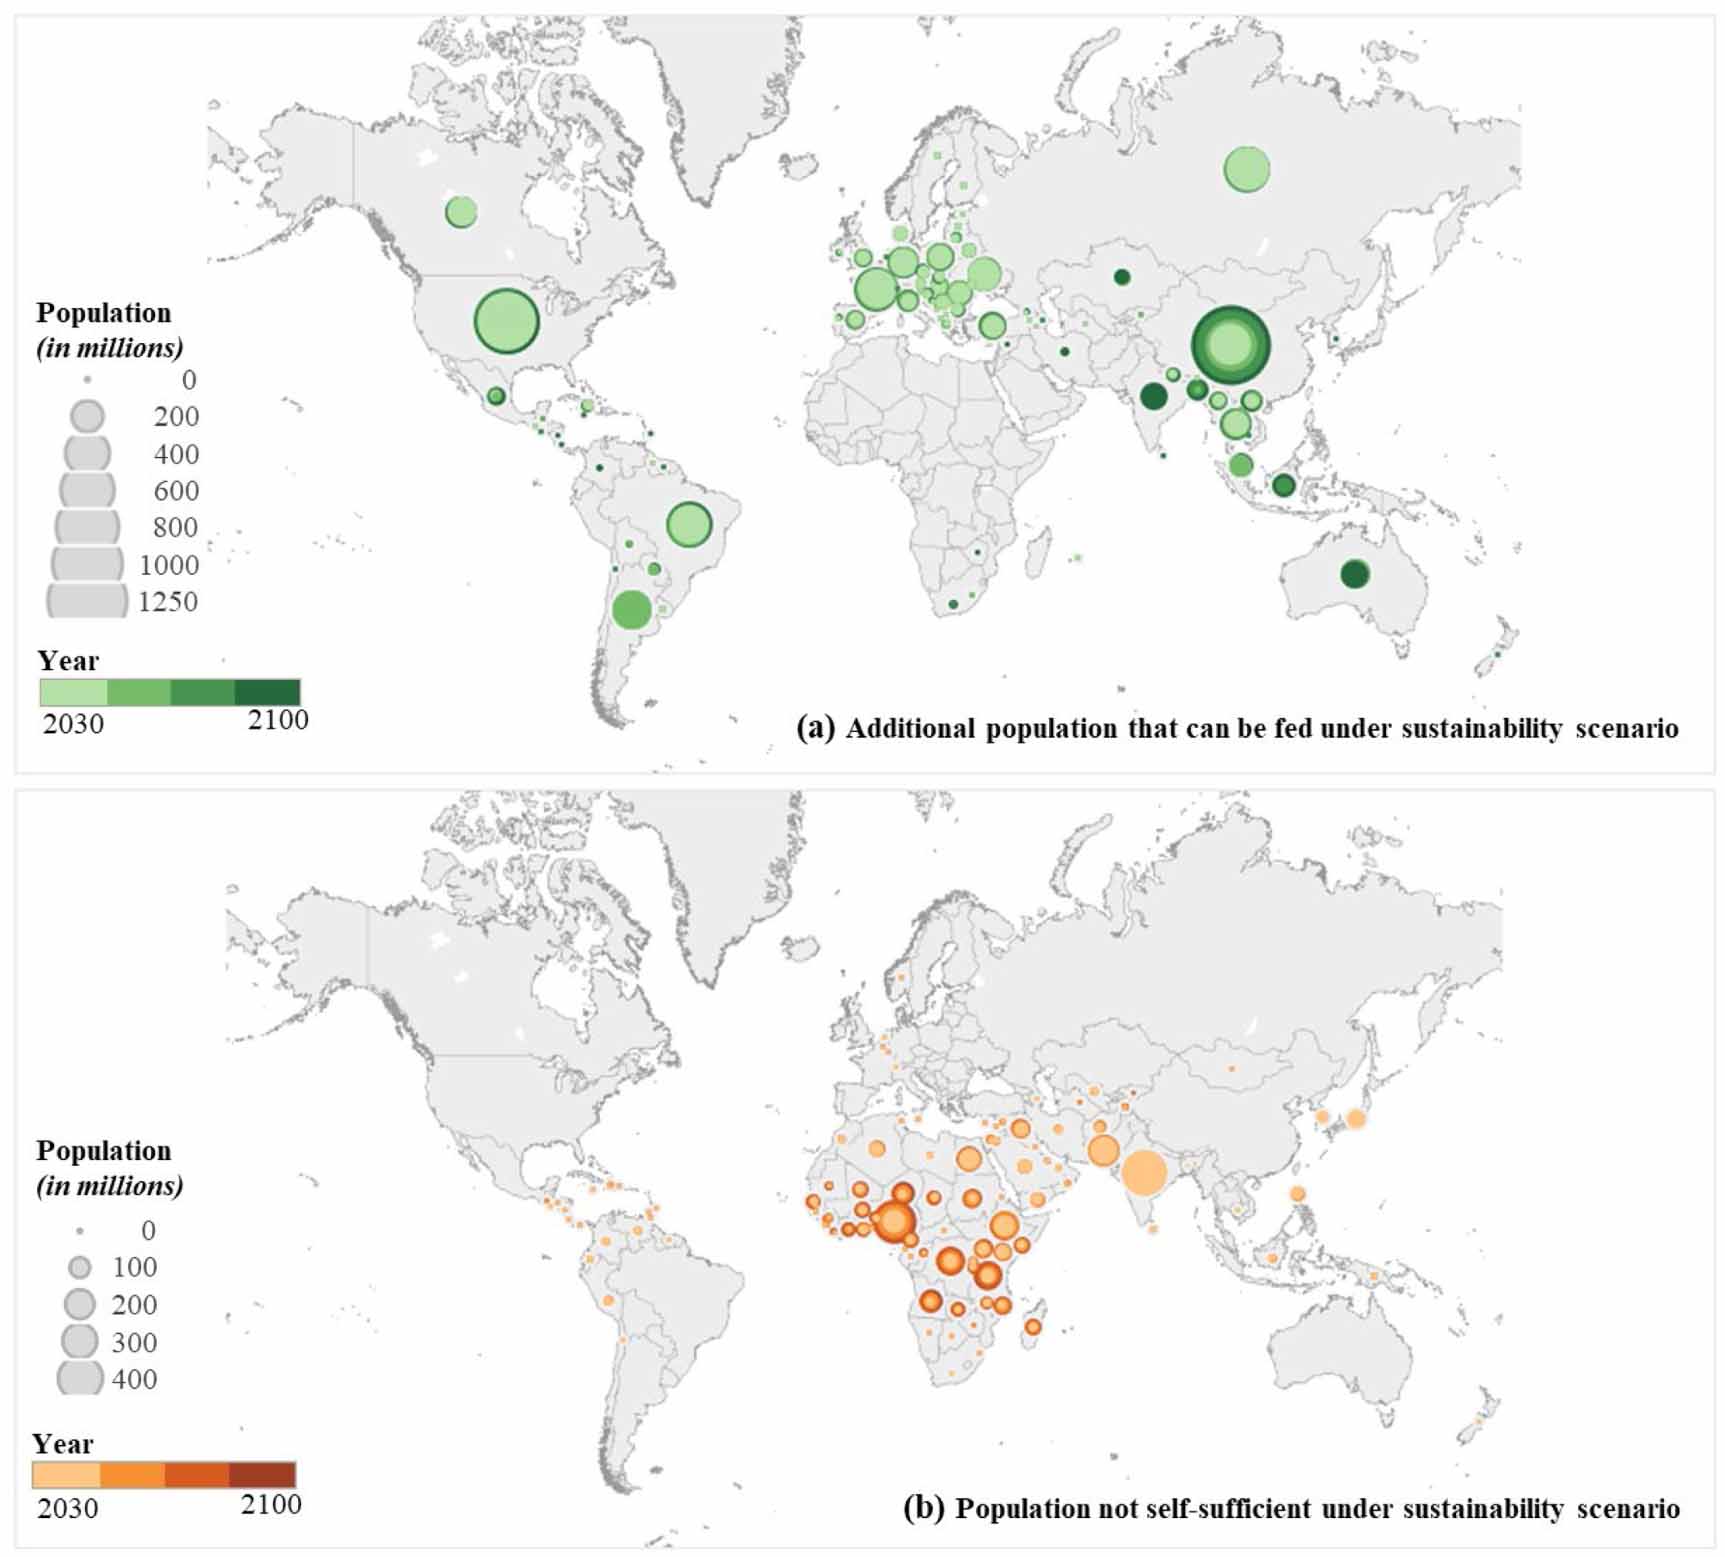
We deduce that by the end of the century under a sustainability scenario, half of the world's countries will be self-sufficient whilst the other half will be dependent on food imports (figure 3(b)). In 2100, Nigeria, Democratic Republic of Congo, Ethiopia, and the United Republic of Tanzania will need to import vast quantities of food to feed an estimated 885 million people (figure 4(b)), while China, the United States, Brazil, Russia, Argentina, Ukraine, Canada, and Australia will produce a surplus of food that could be exported and potentially feed 3.65 billion people (figure 4(a)). Under this scenario, by 2100 enough food could be produced to feed the forecasted global population of 7.3 billion people (table 1). Interestingly, China will transition to a state of surplus production and net export as a result of narrowing yield gaps through sustainable irrigation expansion and the expected stagnation in food demand.

Figure 4. Excess population that can be fed (a) and population for which caloric demand will not be met (b) (in millions of people) from years 2030–2100 under sustainability scenario. (a) country-specific additional population that could be fed under sustainable yield gap closure based on excess crop production. (b) population whose food demand will not be met through domestic food production in each country. Population (in millions) is represented by the varying bubble sizes. The years are represented by the respective color scales with the lightest shade for year 2030 and the darkest shade for 2100. If a country has a deficit in one year and excess another, it will appear on both panels. This figure represents the sustainability scenario. A similar figure for the middle-of-the-road scenario can be found in the supplementary materials figure 4.
Download figure:
Standard image High-resolution imageTable 1. Population self-sufficiency per region under three scenarios (in millions of people). The table gives the total number of additional people that can be fed or the number of people that will be food insecure (negative values) under the sustainability, middle-of-the-road, and business-as-usual scenarios for years 2050 and 2100.
| Sustainability RCP 2.6, | Middle-Of-The-Road RCP 6.0, | Business-As-Usual RCP 8.5, | |
|---|---|---|---|
| Region | SSP 1, Low Pop Variant | SSP 2, Medium Pop Variant | SSP 3, High Pop Variant |
| 2050 | |||
| Asia | 98 | −674 | −1152 |
| Latin America | 556 | 415 | 251 |
| Middle East and Africa | −1684 | −1925 | −2219 |
| OECD | 2374 | 2047 | −293 |
| Former Soviet Union | 669 | 667 | 492 |
| WORLD | 2013 | 529 | −2921 |
| 2100 | |||
| Asia | 1856 | 72 | −3229 |
| Latin America | 836 | 444 | −570 |
| Middle East and Africa | −2332 | −3780 | −5577 |
| OECD | 2669 | 2040 | −608 |
| Former Soviet Union | 677 | 669 | 131 |
| WORLD | 3706 | −555 | −9852 |
3.4. Middle-of-the-road scenario
Following a middle-of-the road trajectory and reaching a population of 10.8 billion people by 2100, only 36% of countries worldwide will be self-sufficient, while 64% of countries will not produce enough crops domestically to feed their population (figure 3(c)). Under this scenario, Nigeria, India, Pakistan, Ethiopia, and the Democratic Republic of Congo will heavily depend on imports while, while China, the United States, Russia, Brazil, Argentina, Ukraine, Canada, and Australia will produce a surplus of food that could be exported and potentially feed 2.69 billion people (supplementary figure 4). However, even accounting for all excess production under the middle-of-the-road scenario, we find that approximately 555 million people would remain food insecure in 2100 (table 1).
3.5. Business-as-usual scenario
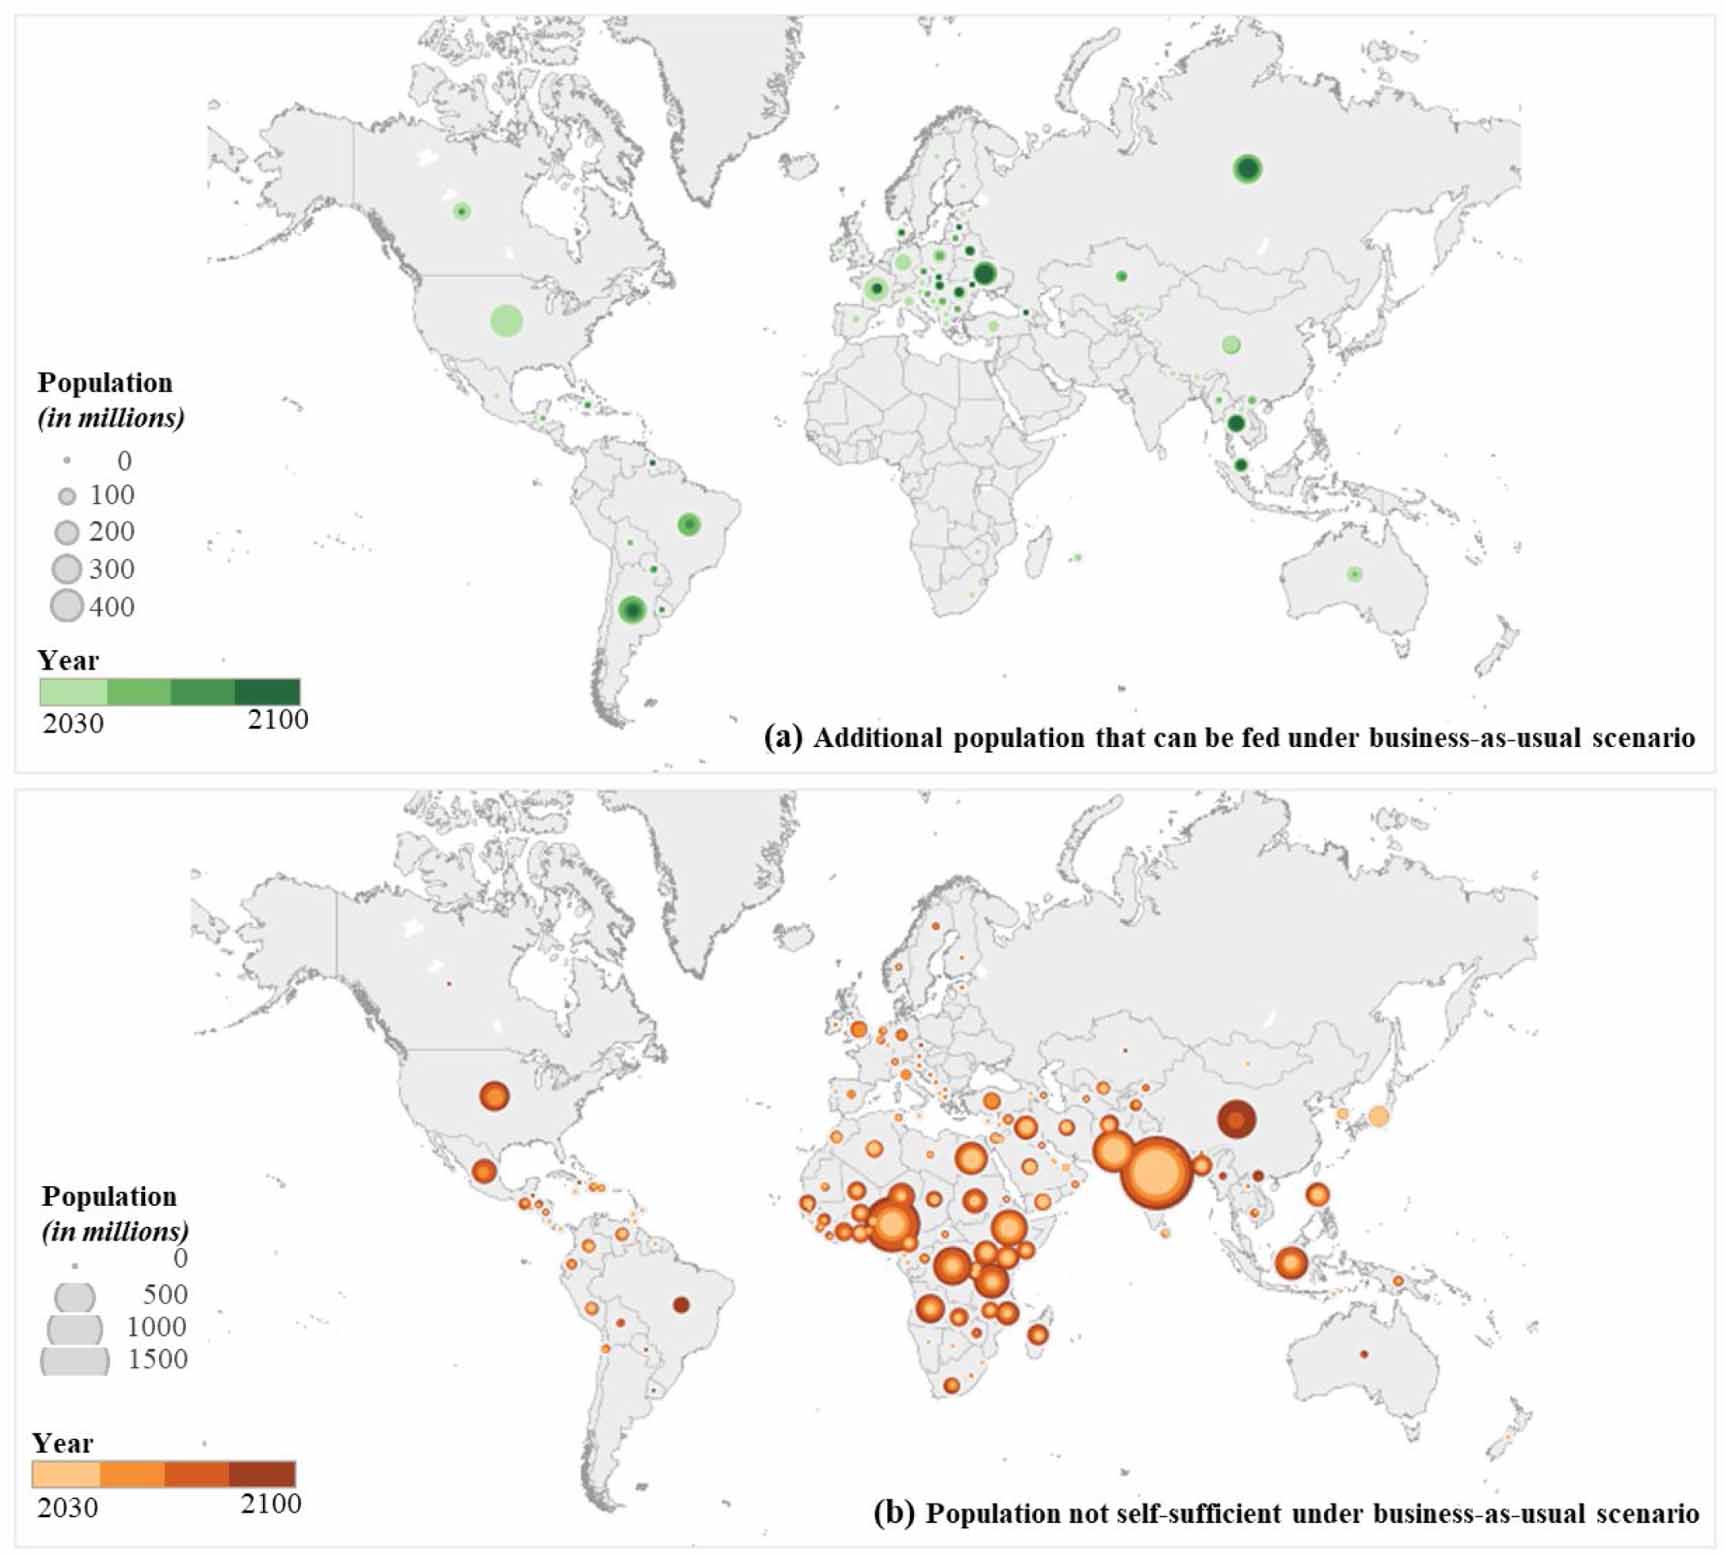
Under business-as-usual, some countries continue to be self-sufficient with excess production before mid-century (i.e. United States and China) (figure 5 and supplementary figure 3). However, if a business-as-usual pathway is pursued and global population reaches 15.6 billion people, global food demand will dangerously outpace food production by the end of the century. In other words, 141 countries will not be self-sufficient (figure 3(d)) and food production will not suffice to meet the caloric demands of approximately 9.8 billion people (∼63% of the global population in year 2100) (figure 5(b) and table 1). Only 14% of countries in the world will be self-sufficient and have excess crop production. Our study points to Russia, Eastern Europe, and Thailand as the major bread baskets with export capabilities at the end of the century (figure 5(a)).

Figure 5. Excess population that can be fed (a) and population for which caloric demand will not be met (b) (in millions of people) from years 2030 to 2100 under business-as-usual scenario. (a) country-specific additional population that could be fed under sustainable yield gap closure based on excess crop production. (b) population whose food demand will not be met through domestic food production in each country. Population (in millions) is represented by the varying bubble sizes. The years are represented by the respective color scales with the lightest shade for year 2030 and the darkest shade for 2100. If a country has a deficit in one year and excess another, it will appear on both panels. This figure represents the business-as-usual scenario.
Download figure:
Standard image High-resolution image4. Discussion
We show the evolving fragility of the global food system considering different socio-economic pathways in the 21st century. In pairing the crop demand data with the crop production data, we found that under a sustainability scenario with a low population estimate of 7.3 billion people eating diets with lower animal-calorie shares, there will be enough crop production to feed the global population and an additional 3.4 billion people by 2100 (table 1). These results agree with recent studies (Gerten et al 2020) that found that within the current extent of croplands it is possible to sustainably feed 10.2 billion people (though, without accounting for changes in yields due to climate change). Under a middle-of-the-road pathway with a medium population estimate of 10.8 billion people with moderate diets, there will not be sufficient food production to meet the dietary needs of approximately 555 million people by 2100. Failure to pursue a sustainable trajectory and continuing a business-as-usual trajectory, will result in insufficient food availability to meet the dietary needs of approximately 9.8 billion people (table 1).
Today, most countries in Middle East and Africa are not self-sufficient. Our results suggest that this region will continue to be heavily reliant on imports throughout the 21st century under all future scenarios. Population in this region is expected to grow significantly under middle-of-the-road and business-as-usual scenarios—increasing the number of people that may be food insecure (in terms of food availability). Contrarily, our study finds that many Former Soviet Union states are going to be major food producers and exporters through the 21st century. While, some of the deficit may be supplemented by international food trade (D'Odorico et al 2019b), if trade fails to meet the needs of regions that are not self-sufficient, then millions of people may become food insecure. Moreover, in the middle-of-the-road and business-as-usual scenarios the global demand for food commodities will not be able to be completely met through trade.
Future projections of global self-sufficiency differ depending on socio-economic pathways pursued and varying degrees of radiative forcing. Our results are more sensitive to the population and diet assumptions of the shared socioeconomic pathways than to climate change (figure 6). In fact, since we took the multi-model mean of percent-yield change across five GGCMs for three RCPs, our estimates of the effect of climate change on crop production for the four major crops do not show the uncertainties and variability associated with climate projections.

Figure 6. Sensitivity analysis of global net population that can or cannot be fed (in billions of people). Number of people (in billions) that can be fed (in green)—in addition to global population; and the projected number of people for whom there will not be enough crop production available to meet their caloric needs (pink). The first panel (left) represents year 2000 self-sufficiency, which shows the planet's ability to feed additional 2 billion people, while the remaining three panels represent the SSP1, SSP2 and SSP3 scenarios of per capita food demand. The blue dashed box denotes the UN population variant that best matches each of the SSP scenarios based on their underlying assumptions. The SSP1 diet with the low population is representative of the Sustainability scenario; the SSP2 diet with the medium population represents the Middle-of-the-Road scenario; and the SSP3 diet with the high population represents the Business-as-Usual scenario.
Download figure:
Standard image High-resolution image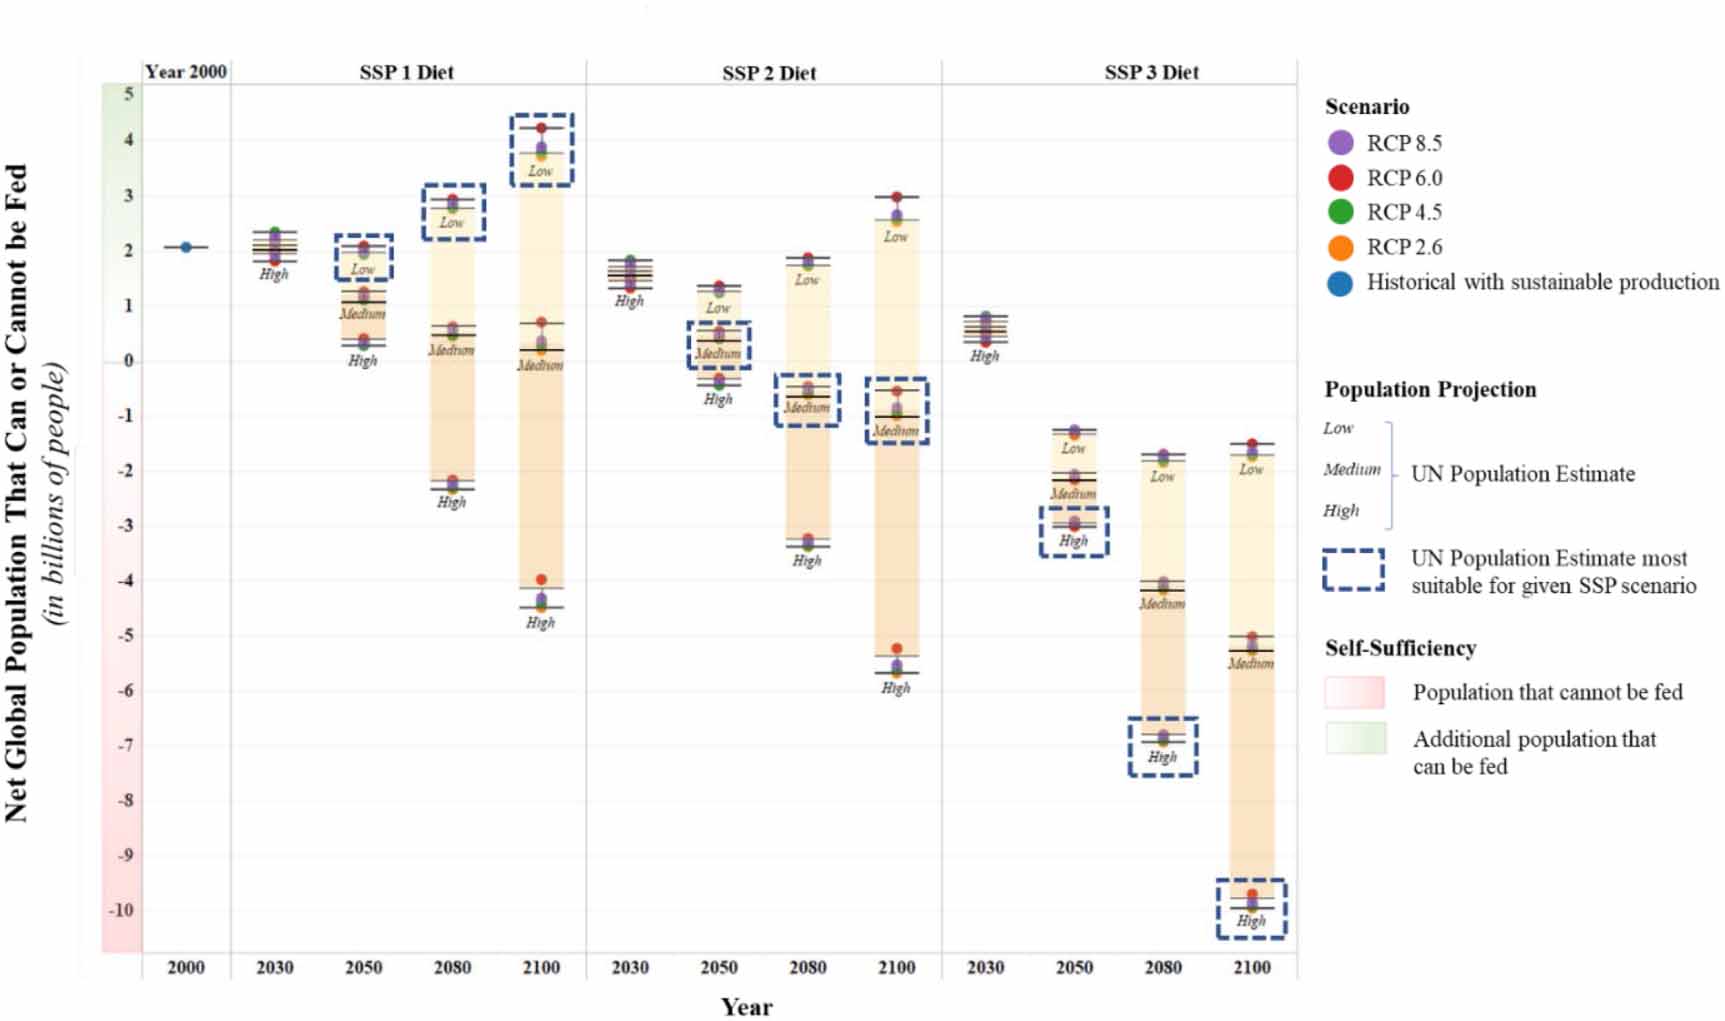
Our sensitivity analysis (figure 6) demonstrates the sensitivity of our global self-sufficiency projections to different diet, population and climate scenarios. The extent of each bar represents the sensitivity of global self-sufficiency to population growth scenarios under the diet scenario in each panel. For example, under the sustainability scenario with an SSP1 diet in the year 2100 and a low population scenario there is excess food production. However, under the same diet assumption and year but with a high population, there is not enough food produced to meet demand. By maintaining the population scenario and the year constant the differences in projected global self-sufficiency across all three diet scenario panels reflect the different results based on dietary assumptions (in other words, the sensitivity of global self-sufficiency projections to the different diets). For example, assuming a high population in year 2100, under each SSP diet scenario separately, approximately 4 billion (SSP1), 5.5 billion (SSP2), or 9.8 billion (SSP3) people cannot be fed. Thus, moderating diets (as well as reducing food losses, waste, and biofuel production—which are not explicitly accounted for in our scenario-based analysis) will be crucial strategies to increase food availability and minimize the number of food-insecure people when crop production becomes limited (Foley et al 2011, Davis et al 2014, Gephart et al 2016, Kummu et al 2017). As depicted in the figure, the effects of climate change on crop production (black interval bars) are minimal due to the averaging effect (see limitations and uncertainty section). Table 1 displays values of net population the can or cannot be fed in years 2050 and 2100 for the Sustainability, Middle-of-the-Road, and Business-as-usual scenarios as defined in the paper. The results of the various possible combinations of climate (RCP), diet (SSP), and population (UN) scenarios assuming 80% yield gap closure are shown as a sensitivity analysis in figure 6.
4.1. Limitations, assumptions, and uncertainties
The complexity of a global analysis often requires the adoption of suitable assumptions. Our study assumes an 80% yield gap closure globally based on the blue water availability estimates from Rosa et al (2018). Without narrowing the yield gap, food insecurity will be much higher than what our study forecasts. Unlike previous studies (e.g. Davis et al 2014) that quantified the size of the global population that could be fed at yield gap closure without accounting for the availability of water resources for irrigation, here it is assumed that irrigation is adopted to close the yield gap only in regions where it is water sustainable. In this study we consider potential future changes in food production (for the major 4 crops) from changes in precipitation and temperature regimes that could affect future water availability and crop production based on the HadGEM2-ES earth system model. However, we neither account for the effects of climate related shocks, such as droughts, floods, and other extreme climate events, nor for the impact of climate change on the sustainable expansion irrigation to rainfed areas. These points will be explored in future studies.
The rates of food loss or waste as well as the biofuel production per crop per country were based on the five-year average from 2009–2013 and were assumed to remain constant until 2100. We expect food loss and waste to continue to persist in the 21st century, but the rate of change is difficult to accurately predict and for this reason we kept them constant. The OECD-FAO Agricultural Outlook projects global biofuel production up to year 2028 (OECD/FAO 2019) with strong uncertainties. Hence, to not add further assumptions in our estimates, we assumed the current rate of biofuel production to remain constant as well.
To assess the effects of climate change on crop yields we considered five global gridded crop models. These models are subjected to substantial uncertainties from both model structure and parametrization as well as from calibration and input data quality (Elliott et al 2015, Müller et al 2017). There are significant differences among the crop model outcomes for changes in crop yields based on the three RCP scenarios evaluated. In this study we do not show the range of variability associated with GGCMs but took the multi-model mean for changes in crop yields. In taking the multi-model mean, the effects of climate change on crop production are minimal in our results (figure 6). Additionally, due to data availability, the percent yield change due to climate change was only considered for four major crops (maize, soy, wheat, and rice) which account for 70% of global crop production (D'Odorico et al 2014, Warszawski et al 2014). Crop yields data for the four major crops under different climate scenarios were aggregated to the current yield data of the remaining 18 crops (not accounting for climate change for these 18 crops) which account for a significant portion of the remaining crop production. Finally, this study solely considers the food availability pillar of food security and does not consider patterns of food access and utilization.
5. Conclusion
End of hunger, achievement of food security, and improvement in nutrition are at the heart of the United Nations' Sustainable Development Goals. This study evaluates the impact of sustainable irrigation expansion, climate change, population growth, and dietary changes on global self-sufficiency ratios through an integrative assessment approach for the remainder of the 21st century. Our results assume achievement of 80% yield gap closure globally through sustainable irrigation expansion onto currently rainfed croplands. This is a significant assumption, yet even with the increased production, our results show that global food availability will only meet the global food demand under the sustainability scenario. Under the middle-of-the road and business-as-usual scenarios, a multitude of nations and their people are at risk of food insecurity (in terms of food availability). Without sustainable irrigation expansion, global self-sufficiency ratios will worsen. Although climate change plays a role, self-sufficiency ratios are highly sensitive to population growth estimates and dietary changes based on socio-economic pathways pursued. Future societies' resilience against global challenges such as climate change hinges on successful implementation of policies, actions and development strategies (Andrijevic et al 2019). Hence, investing in girls' education and expanding people's access to family-planning services in the developing world where populations are projected to increase (Abel et al 2016); and reducing global meat consumption in emergent economies, in addition to sustainably increasing agricultural production will be essential measures for countries working towards resilience and sustainability in the face of climate change.
Acknowledgments
A B was funded by the NSF InFEWS Fellowship Grant No. DGE-1633740. L R was supported by The Ermenegildo Zegna Founder's Scholarship and by the AGU Horton Hydrology Research grant. P D was funded by the USDA Hatch Multistate project#W4190 capacity fund. We thank all those who made the data used in this study freely available, Dr Sebastian Ostberg of the Potsdam-Institute for Climate Impact Research for sharing crop-specific yield data under the RCP scenarios considered in this study, and Nick Dekutoski from the University of California Berkeley for his advice on constructing the code for data analysis.
Conflict of Interest
The authors declare no conflict of interest.
Author contribution
AB, LR, PD conceived the study; AB, LR designed the study; AB collected and analyzed data and performed research; AB, LR wrote the paper. PD supervised study design and writing.
Data Availability
The data that support the findings of this study are available from the corresponding author upon reasonable request.