

Abstract
Renewable natural gas (RNG) is a fuel comprised of essentially pure methane, usually derived from climate-neutral (e.g. biogenic or captured) carbon dioxide (CO2). RNG is proposed as a climate friendly direct substitute for fossil natural gas (FNG), with the goal of enabling diverse natural gas users to continue operating without substantial infrastructure overhauls. The assumption that such substitution is climate friendly relies on a major condition that is unlikely to be met: namely, that RNG is manufactured from waste methane that would otherwise have been emitted to the atmosphere. In practice, capturable waste methane is extremely limited and is more likely to be diverted from a flare than from direct atmospheric release in a climate-conscious policy context, which means that RNG systems need to be more destructively efficient than a flare to provide climate benefits versus the likely alternative management strategy. Assuming demand levels consistent with the goal of using existing FNG infrastructure, RNG is likely to be derived from methane that is either intentionally produced or diverted from a flare, so essentially any methane leakage is climate additional. Further, in a decarbonizing system, RNG will likely compete with lower-emissions resources than FNG and thus provides fewer net emissions benefits over time. Anticipated leakage is climatically significant: literature estimates for methane leakage from biogas production and upgrading facilities suggest that leakage is in the 2%–4% range (mass basis), up to as much as 15%. Policy makers should consider that under reasonable leakage and demand assumptions, RNG could be climate intensive.
Export citation and abstract BibTeX RIS

Original content from this work may be used under the terms of the Creative Commons Attribution 4.0 license. Any further distribution of this work must maintain attribution to the author(s) and the title of the work, journal citation and DOI.
1. Introduction
Climate change motivates an urgent global transition away from the use of fossil fuels for energy (Intergovernmental Panel on Climate Change 2014, Geels et al 2017, Mccauley and Heffron 2018, Davis et al 2018). Fossil fuels account for 85% of global commercial energy consumption (2018) (BP 2019) and dominate global energy infrastructure. Given the scale, costs, and economic implications of abandoning infrastructure before the end of its useful life, and given the challenge of transitioning energy systems quickly, there is substantial interest in the idea of renewable drop-in fuels (Rye et al 2010, Horvath 2016, Lynd 2017) that can use existing infrastructure without creating the problems of fossil fuel use. This interest is particularly salient in the context of end uses that use specific fossil fuels directly. For example, transportation services currently rely primarily on refined oil, and many industrial and other heating applications directly burn natural gas. These direct users of fossil fuels are often unable to accommodate alternative fuels without abandoning functional infrastructure (e.g. internal combustion engine cars and natural gas-fired water heaters) in favor of infrastructure compatible with the new fuels (e.g. electric cars and electric water heaters).
This work assesses renewable natural gas (RNG) (Götz et al 2016, Gasper and Searchinger 2018), here referring both to biomethane (Parker et al 2017, Paolini et al 2018) and power-to-gas (Götz et al 2016, Collet et al 2017), as a direct substitute for fossil natural gas (FNG). Drop-in substitutes for FNG specifically are valued due to the diversity of uses, and thus infrastructure, for FNG. In the United States (US), FNG accounts for about 30% of primary energy consumption (EIA 2018), split relatively evenly among power generation (∼40%), industrial uses (∼30%), and commercial and residential uses (∼30%) (Energy Information Administration 2020). RNG has been proposed as a way to decarbonize this system while leveraging existing fossil infrastructure, including pipelines and end use equipment like home and industrial heating devices (Washington State University Energy Program 2018, Bataille 2019). This substitution is particularly relevant for non-electricity uses because they are often more difficult to decarbonize (Davis et al 2018, Bataille 2019), though RNG is also valued as an electricity fuel because RNG plants could provide fully dispatchable electricity generation that could reduce the need for costly electricity storage or demand management (Tarroja et al 2020). Similarly, like hydrogen, RNG manufacturing has been proposed as a sink for excess variable electricity that can be stored for later use, in the form of power-to-gas schemas (Götz et al 2016).
Like FNG, RNG is primarily methane (Gasper and Searchinger 2018), a potent greenhouse gas (GHG) (Intergovernmental Panel on Climate Change 2014) second only to carbon dioxide (CO2) in its overall contribution to climate change (Weyant et al 2006). When RNG is produced from waste methane, converting it to CO2 by burning it has climate benefits because of methane's much higher climate forcing potential (Intergovernmental Panel on Climate Change 2014) relative to CO2. If the waste methane were going to be emitted to the atmosphere anyway, any system leakage (i.e. methane emissions) is a lost opportunity but not a climate stressor; otherwise, it contributes to climate change. This analysis shows that 1) RNG from intentionally produced methane, even from climate-neutral CO2 sources, has substantial climate impacts at methane leakage levels observed in the existing, mature biogas industry (Pertl et al 2010, Flesch et al 2011, Whiting and Azapagic 2014, Ravina and Genon 2015, Hijazi et al 2016, Liebetrau et al 2017, Paolini et al 2018, Vo et al 2018, Ramírez-Islas et al 2020); (2) for any meaningful system scale, RNG is likely to be derived from intentionally produced methane; and (3) even RNG from waste methane can have negative climate impacts relative to the most likely alternative of flaring, not venting, the methane when leakage from RNG production and use exceeds flaring loss rates.
2. Methods
This analysis evaluates the GHG intensity of RNG, focused on three methane feedstock pathways for RNG production: (1) from waste methane that would have otherwise been emitted to the atmosphere; (2) from waste methane that would have otherwise been flared; and (3) from intentionally created methane that would otherwise not have existed. The carbon for RNG is assumed to be climate neutral, for example, biogenic or sourced from a carbon capture activity. Reported GHG intensities use IPCC's Fifth Assessment Report (AR5) 20- and 100-year GWPs with climate-carbon feedback, distinguishing between fossil and nonfossil methane GWPs (see Working Group 1, chapter 8, Tables 8.7 and 8.A.1). For comparison, the GHG intensity of FNG, generic resources with life cycle 2050 GHG intensity consistent with 2 ºC warming (Pehl et al 2017), and zero carbon resources are also included. Full details and calculations are available in the Supplementary Data File.
The absolute GHG intensity of RNG is assumed to derive from methane leakage only (because combustion GHG emissions for RNG are climate neutral by assumption), drawing the system boundary at the point when the methane is diverted from the alternative management strategy (venting, flaring, or not existing) and excluding embodied GHGs in infrastructure or any of the production feedstocks. For example, power-to-gas pathways are implicitly assumed to use GHG-neutral power in facilities with zero embodied GHGs. GHG intensity is given as kilograms (kg) of carbon dioxide equivalent (CO2e) per gigajoule (GJ) of methane consumed—that is, the denominator is the amount of methane that is ultimately delivered to the entity that combusts it, which is less than the amount of methane that is produced or withdrawn if system leakage exceeds 0%. Emissions associated with leakage are thus calculated as follows:
where system leakage is mass methane emitted/mass methane produced. Net emissions relative to the alternative fate for methane are calculated by subtracting the counterfactual methane emissions. For Path 1 (waste methane would have otherwise been emitted to the atmosphere), counterfactual emissions are that system leakage = 100%. For Path 2 (waste methane would have otherwise been flared), counterfactual emissions are that system leakage = (1-flare efficiency). For Path 3 (methane would not otherwise have existed), counterfactual emissions are 0. Thus, net emissions are given as:
For the three paths, Equation 2 becomes:
Note that because of the presentation of results per unit of methane combusted by a user and the fact that methane production = methane delivered/(1—system leakage) (equation (1)), equation (3) reduces to  and is independent of leakage rate. For Path 2, emissions upstream of the flare are not considered because waste methane that is vented prior to diversion to the flare is not diverted to the flare, thus falling under Path 1.
Leakage from the RNG system is evaluated as a range because of substantial uncertainty about what leakage levels would be under future conditions, particularly if newer RNG pathways (e.g. power-to-gas) became widespread. This work considers the implications of RNG system leakage between 0%–15% mass leakage/mass produced in order to inform consideration of potential RNG futures. The range is most proximately based on Scheutz and Fredenslund's (2019) evaluation of 23 biogas plants, including seven facilities encompassing production through biogas upgrading to biomethane, where facility leakages from 0.4 to 14.9% of production were observed (see Supplementary Data File for details). Specific leakage sources are not always evident but might be correlated with plant complexity (e.g. number of units), maintenance regimes, and the status of biogas production as a core or non-core function (Scheutz and Fredenslund 2019). Published values in other studies and GHG protocols reflect ranges generally narrower than but consistent with Scheutz and Fredenslund's findings (Flesch et al 2011, Liebetrau et al 2013, 2017, Hrad et al 2015, Vo et al 2018, Bartoli et al 2019).
Leakage downstream of production and processing (i.e. during transportation, storage, and end use) is assumed to be identical for FNG and RNG. Although it is challenging to assign a value for these processes due to the diversity of end uses, lack of information about leakage during end uses, differential use of transmission, storage, and distribution by end users, and the dependence of transportation leakage on distance, a value of 0.8% (mass leaked per mass withdrawn or produced) was chosen in service of estimating absolute GHG intensities for comparison with zero-GHG systems. This value is based on assumptions and data from the literature (Liebetrau et al 2013, Lavoie et al 2017, Alvarez et al 2018) (see Supplementary Data File for details). For FNG, this value is added to an estimate of production and processing leakage of 2.1% mass leakage/mass withdrawn (Alvarez et al 2018), and for RNG, it is assumed to be included in the assessed 0%–15% range for full system potential leakage rates.
3. Results
3.1. GHG intensity of renewable natural gas
Table 1 shows the estimated GHG intensity of RNG for three production pathways as a function of system methane leakage: (1) RNG produced from waste methane that would have otherwise been emitted to the atmosphere (Path 1); (2) RNG produced from waste methane that would have otherwise been flared with 99% destructive efficiency (Path 2); and (3) RNG produced from intentionally created methane (Path 3).
Table 1. Renewable natural gas carbon dioxide equivalent intensity by pathway, assuming climate-neutral combustion emissions of carbon dioxide.
| (a) GWP-100, kg CO2e/GJ methane productively consumed | |||||||
| system leakage (mass CH4 emitted/mass CH4 produced) | 0 | 0.025 | 0.05 | 0.075 | 0.1 | 0.125 | 0.15 |
| Path 1: Waste methane diverted from emission to atmosphere | −680 | −680 | −680 | −680 | −680 | −680 | −680 |
| Path 2: Waste methane diverted from a 99% efficient flare | −7 | 10 | 29 | 48 | 68 | 89 | 112 |
| Path 3: Intentionally produced methane used | 0 | 17 | 36 | 55 | 76 | 97 | 120 |
| (b) GWP-20. kg CO2e/GJ methane productively consumed | |||||||
| system leakage (mass CH4 emitted/mass CH4 produced) | 0 | 0.025 | 0.05 | 0.075 | 0.1 | 0.125 | 0.15 |
| Path 1: Waste methane diverted from emission to atmosphere | −1720 | −1720 | −1720 | −1720 | −1720 | −1720 | −1720 |
| Path 2: Waste methane diverted from a 99% efficient flare | −17 | 26 | 72 | 121 | 172 | 226 | 283 |
| Path 3: Intentionally produced methane used | 0 | 44 | 91 | 139 | 191 | 246 | 304 |
In all cases, this analysis assumes that the CO2 emitted from burning RNG is climate neutral for the RNG user, e.g. because it is sourced from biogenic or captured carbon that was taken up from and returned to the atmosphere over a period of time that is short from a climate perspective. Further, to emphasize the particular challenge posed by methane leakage, this analysis assumes RNG has no GHG intensity other than that associated with net impacts from methane leakage or destruction—that is, inputs to RNG production like electricity, hydrogen, and support infrastructure are assumed to be climate neutral. This assumption is consistent with the notion that zero-GHG electricity or hydrogen are potential alternatives to RNG. Note that because conversion processes are never 100% efficient, any GHG intensity for RNG associated with electricity or hydrogen inputs would exceed that of the electricity or hydrogen available for use.
As table 1 shows, the GHG intensity of RNG is driven by the counterfactual—that is, what would have otherwise happened to the source methane. Path 1, waste methane diversion from the atmosphere, is highly GHG negative because the counterfactual is that all utilized methane would have been emitted as methane. Leakage is irrelevant to GHG impact per unit of utilized methane because any leaks are methane that would have escaped anyway. Although Path 2 also uses waste methane, the counterfactual is that the waste methane would have been nonproductively burned in a flare, so RNG is GHG negative in this case only if the RNG system's total leakage is lower than leakage from the flare (1%), which is unlikely given that a best-guess estimate of downstream emissions alone is 0.8%. Path 3 uses intentionally produced methane. Here, the counterfactual is that no methane would have been released to the atmosphere, so any system leakage is GHG positive.
3.2. Intentionally produced methane for RNG
A major finding of this analysis is that, as with FNG (Brandt et al 2014, Alvarez et al 2018, Grubert and Brandt 2019, Zhou et al 2019), RNG can have significant climate impacts associated with system methane leakage if the methane is intentionally produced (Path 3; table 1). Figure 1 shows the GHG intensity (kg CO2e/GJ CH4 productively consumed, e.g. for heat or electricity generation) of RNG from intentionally produced methane as a function of RNG system methane leakage.
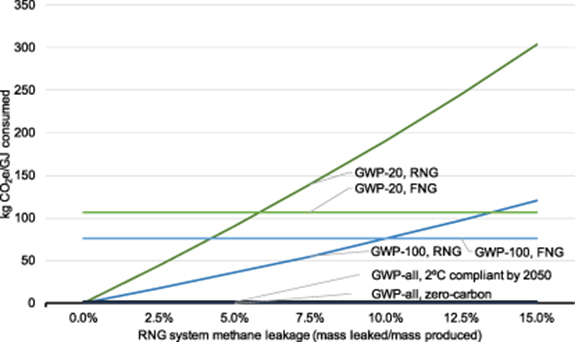
Figure 1. Greenhouse gas intensity of renewable natural gas from intentionally produced methane as a function of system methane leakage. GWP-20 and GWP-100 are shown for intentionally produced RNG for RNG system methane leakage of 0–15%, with GWP-20 and GWP-100 of FNG shown for reference.
Download figure:
Standard image High-resolution imageAs figure 1 shows, RNG from intentionally produced methane is always GHG positive unless total system leakage is 0. Given demonstrated transportation and end use leakage values on the order of 0.4–0.8% (Liebetrau et al 2013, Lavoie et al 2017, Alvarez et al 2018), RNG from intentionally produced methane cannot outperform zero-GHG hydrogen or electricity systems on GHG intensity. Although this analysis does not consider non-operational, non-methane GHGs, note that both hydrogen and electricity are likely inputs to intentionally produced methane for RNG, which therefore inherits and amplifies embodied emissions. The estimated methane-only GHG footprint of such RNG exceeds the combustion plus methane leakage GHG footprint of FNG when RNG system leakage is higher than about 10% (GWP-100) or 6% (GWP-20) on a mass leaked per mass produced basis. Accounting for IPCC stated uncertainty in the GWP of methane (Intergovernmental Panel on Climate Change 2014), the estimated leakage range within which RNG becomes more GHG intensive than FNG is about 9.1–11.1% (GWP-100) or 5.0–6.6% (GWP-20). Although power-to-gas systems and evaluations remain rare enough that data on leakage are not widely available (though leakage has been discussed (Vo et al 2018)), such leakage rates—particularly for a full system—are not uncommon for biogas to RNG systems (Liebetrau et al 2013, 2017, Scheutz and Fredenslund 2019). For electricity, assuming the heat rate of a US natural gas combined cycle power plant and GWP-100, RNG's operational methane GHG intensity surpasses the 15 kg CO2e/MWh total life cycle 2050 GHG intensity consistent with a 2 ºC warming limit (Pehl et al 2017) for system leakage of 0.3%, which is less than some observed leakage from power plants alone (Lavoie et al 2017). Calculations can be found in the Supplementary Data File.
3.3. At scale, most methane feedstocks for RNG would likely be intentionally produced
How much RNG is likely to come from intentionally produced methane, which includes all power-to-gas RNG and RNG produced from feedstocks that would not degrade anaerobically (i.e. to methane rather than CO2) absent intentional intervention (Meyer-Aurich et al 2012, Börjesson et al 2015, Agostini et al 2015)? The answer depends on assumptions about total demand and the availability of waste methane for diversion to RNG production. If the goal is to maintain the usefulness of FNG infrastructure, one potential assumption for RNG demand is that it would match current FNG demand. In 2017, US consumer consumption was 27.2 exajoules (EJ) of FNG, including 10.1 EJ for electric power and 8.7 EJ for often difficult-to-decarbonize industrial uses (see Supplementary Data File). The energy content of 2017 US uncontrolled methane emissions was about 1.6 EJ/year, about 0.3 EJ of which were emitted from biogenic sources (as opposed to, say, the FNG system) that could reasonably be captured (wastewater treatment plants and landfills, not enteric fermentation) (US EPA 2019, Grubert 2020), not all of which would become consumable RNG (i.e. due to parasitic energy requirements, conversion losses, etc). Thus, although some capturable waste methane (Paths 1 and 2) clearly exists, the degree to which RNG systems can depend on such resources at scale is low (<1%) relative to current natural gas demand.
One important observation for contextualizing these values is that not all methane from waste is waste methane. For example, the National Renewable Energy Laboratory (NREL) estimates that the energy content potential from methanogenic US wastes is about 5% the size of the US natural gas system (National Renewable Energy Laboratory 2013), including a methane potential estimate from wastewater (2.3 million tonnes/year) (National Renewable Energy Laboratory 2013) that is four times the US Greenhouse Gas Inventory (GHGI) estimate for methane emissions from wastewater treatment plants as of 2017 (0.57 million tonnes/year, Table 2–2) (US EPA 2019). Why? Unintentionally produced waste methane typically results from natural anaerobic digestion of wet organic wastes, like animal manure, sewage, and landfilled wastes, but this digestion process does not completely convert carbon wastes to methane. Rather, digestion produces biogas, a blend of methane and CO2 that can then be upgraded into near-pure biomethane, a form of RNG. Crucially, in part because biogas and biomethane can generate revenue, it is not only possible but expected to intervene in biological systems to increase methane production beyond what would have happened anyway when there is an incentive to do so (Hijazi et al 2016, Ferreira et al 2019, Garcia et al 2019). Thus, a single facility might produce both Path 1 (GHG-negative) and Path 3 (GHG-positive) methane from the same wastes.
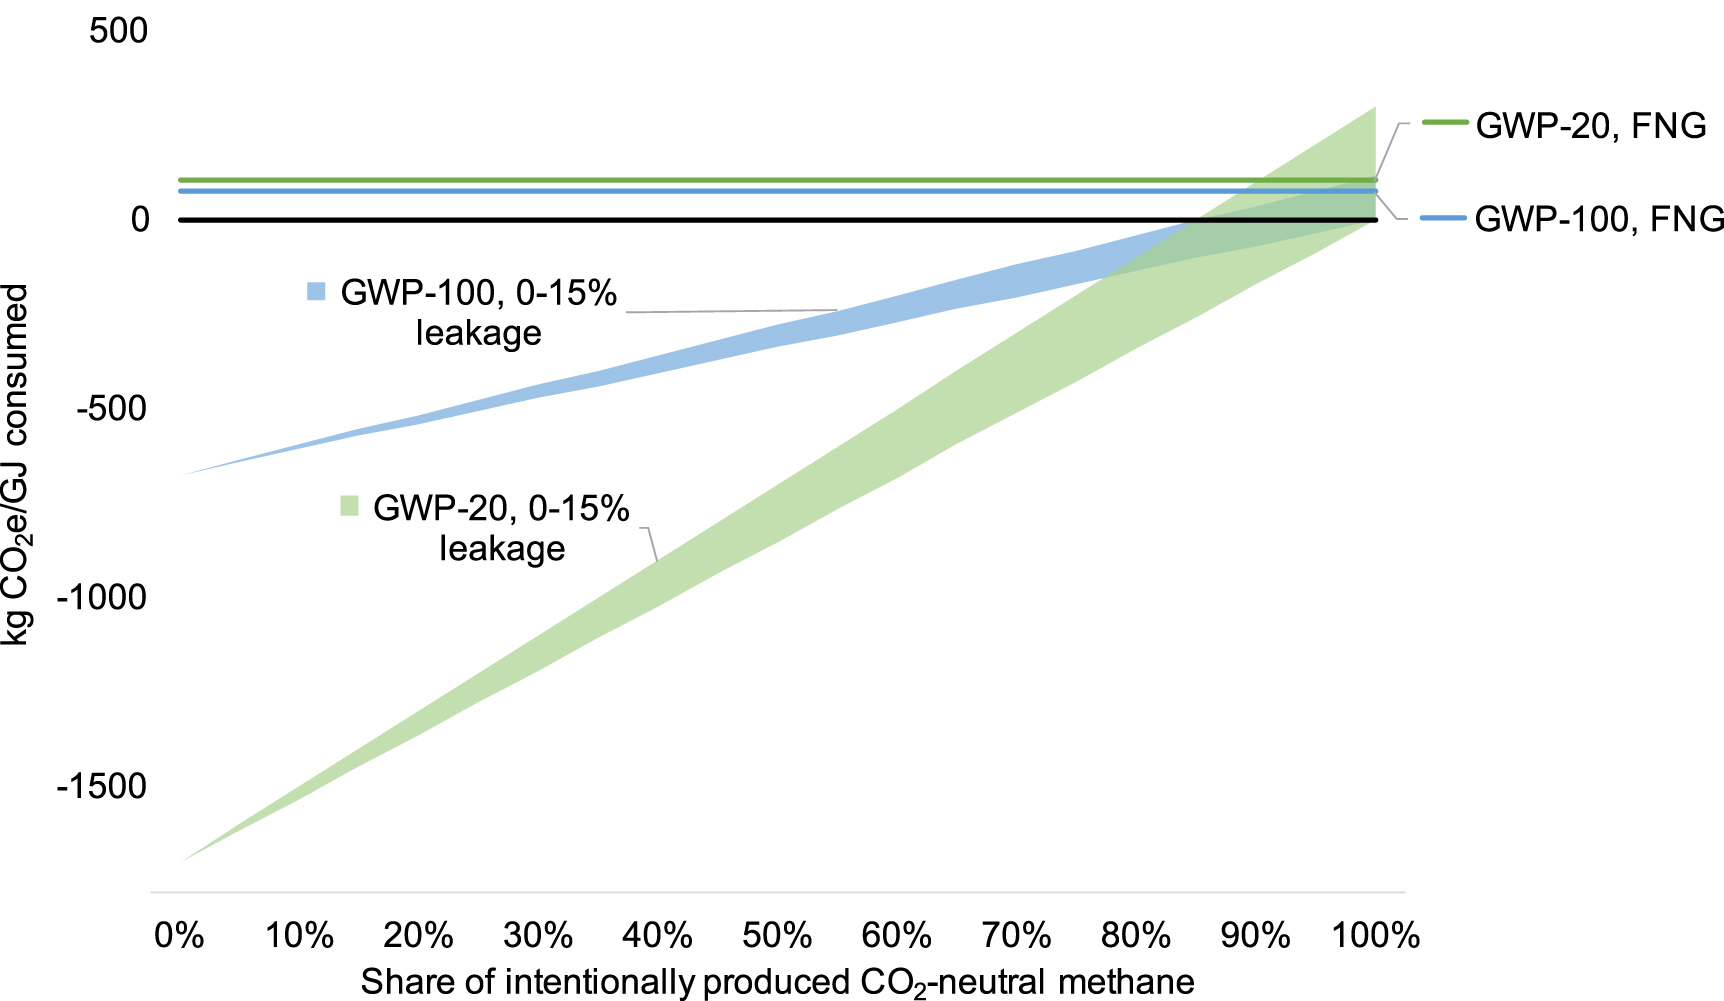
Despite its limited availability, Path 1 methane is so GHG negative (table 1) that it is reasonable to investigate whether climate benefits can be retained if small amounts of very climate-negative RNG are blended with RNG from intentionally produced methane. Figure 2 shows GHG intensity of RNG for blends of 0%–100% Path 3 methane (intentionally produced) with Path 1 methane (waste methane diverted from release).
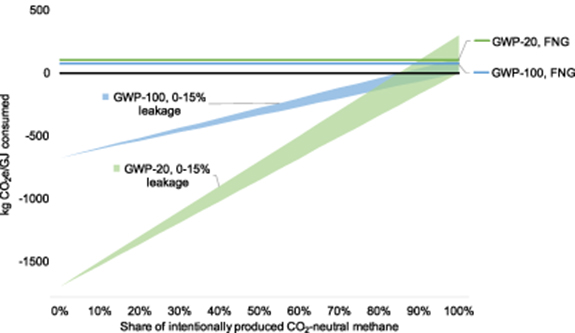
Figure 2. Greenhouse gas intensity of RNG systems that blend waste methane that would otherwise have been released to the atmosphere with intentionally produced methane, for 0%–15% system leakage. Lower bound of shaded areas = 0% system methane leakage for RNG; upper bound of shaded areas = 15% system methane leakage for RNG. GWP-20 and GWP-100 for RNG and FNG are shown for blends of 0% to 100% RNG from intentionally produced methane.
Download figure:
Standard image High-resolution imageFigure 2 suggests that blending very GHG-negative RNG with GHG-positive RNG can enable a fairly large RNG system that is overall at least somewhat GHG-negative, assuming leakage levels within a typically observed range (see Supplementary Data File for detailed calculations and values). Assuming all 0.3 EJ of uncontrolled methane emissions from landfills and wastewater treatment plants could be captured and converted to consumer-ready RNG, either current industrial demand or electric power demand for FNG could be fulfilled by an RNG system with up to about 3% system leakage and theoretically remain GHG-negative (GWP-100; see Supplementary Data File). As the next section shows, however, such an outcome is unlikely because of the actual nature of waste methane management.
3.4. Capturable waste methane would be flared, not vented
The possible conclusion that sufficient highly GHG negative methane exists to support a large (e.g. FNG electricity system-sized) GHG negative RNG system is based on the assumption that waste methane is diverted from emission to the atmosphere (Path 1). This assumption is flawed if one also assumes that GHG emissions reductions are a policy priority, as existing practice is not the appropriate baseline for determining the counterfactual management practice for waste methane that could be available for RNG production (Haya et al 2019). Specifically, if the methane can be captured for RNG production, it can be captured for diversion to a flare, and it is unrealistic to assume that capturable methane would be vented under a GHG conscious policy regime. Even without federal climate regulation, the US regulates methane emissions from new landfills (US EPA 2016), and many methanogenic facilities use methane capture with flares for safety reasons. Flaring destroys the methane with the same destructive benefit as combusting the methane productively. Figure 3 updates the assumptions used in figure 2 to show the same results, but assuming that RNG using Path 3 (intentionally produced) methane is blended with RNG using Path 2 (waste diverted from flare) rather than Path 1 (waste diverted from release) methane. Figure 3 assumes 99% flare efficiency, described in the GHGI as a median value (US EPA 2019). Figure S1 (available at stacks.iop.org/ERL/15/084041/mmedia) shows results assuming the GHGI's lower flare efficiency bound of 86 (US EPA 2019).

Figure 3. Greenhouse gas intensity of RNG systems that blend waste methane that would otherwise have been flared with intentionally produced methane, for 0%–15% system leakage. Panel A: Flare with 99% destruction efficiency. Panel B: Flare with 86% destruction efficiency. Lower bound of shaded areas = 0% system methane leakage for RNG; upper bound of shaded areas = 15% system methane leakage for RNG. GWP-20 and GWP-100 for RNG and FNG are shown for blends of 0% to 100% RNG from intentionally produced methane.
Download figure:
Standard image High-resolution image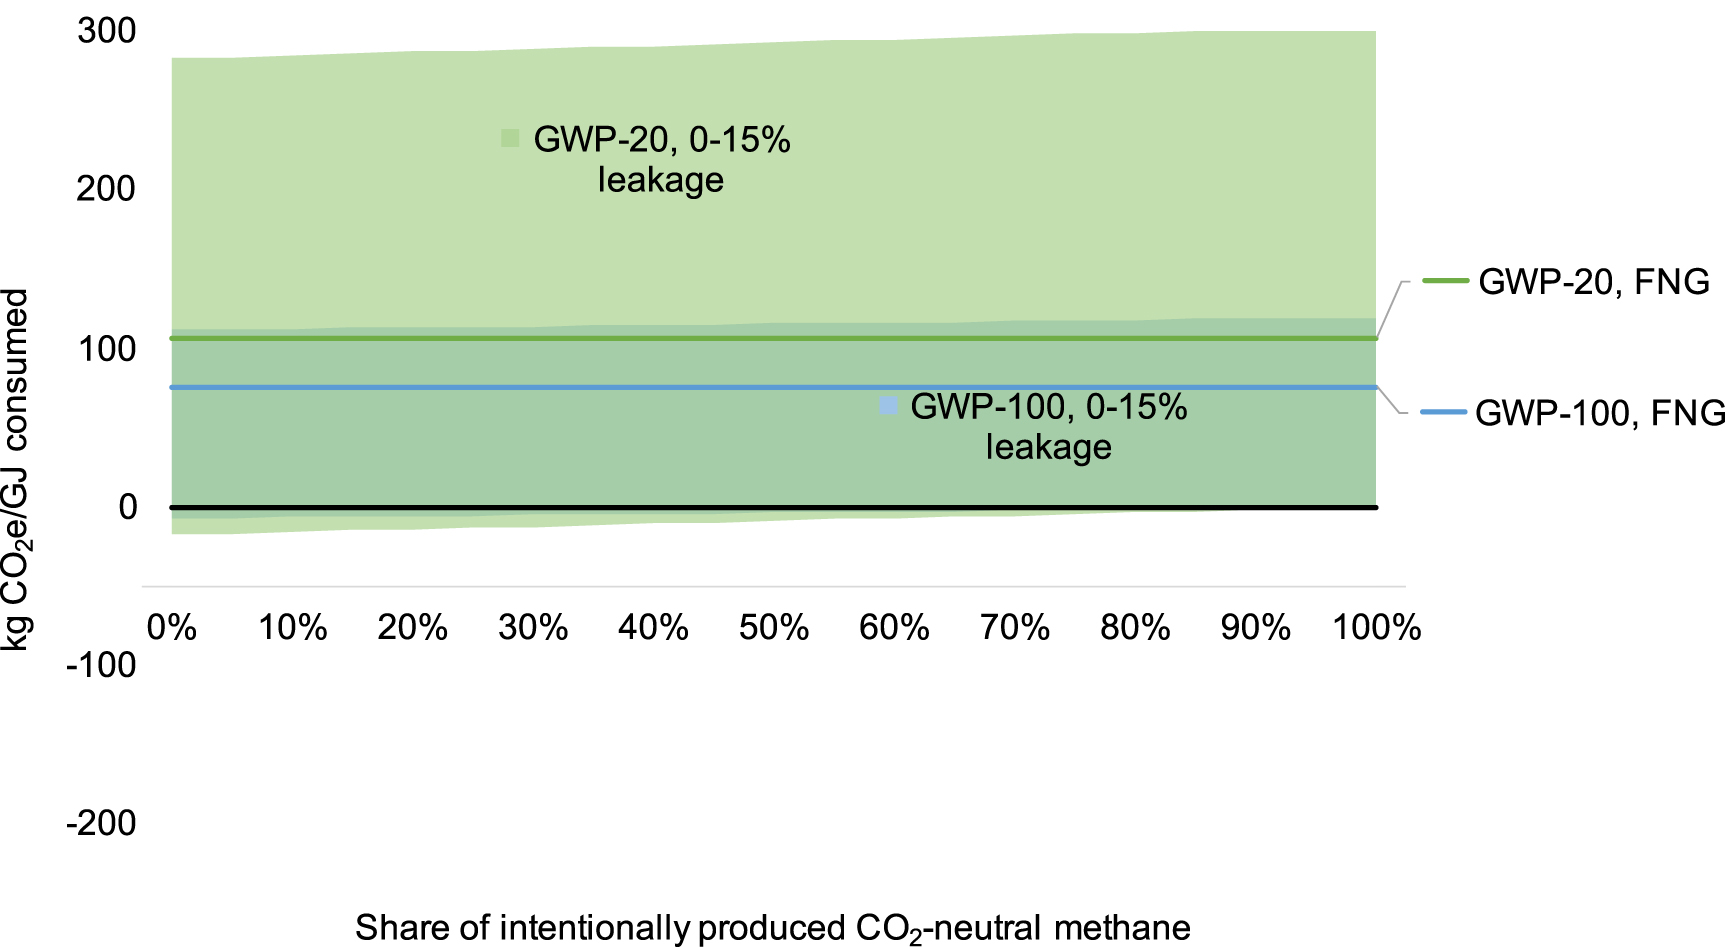
As figure 3 shows, conclusions about the viability of a large, GHG-negative RNG system change radically when the more realistic counterfactual of methane destruction rather than methane venting is applied. RNG system leakage would need to be essentially 0 (that is, lower than the flare's leakage) to be GHG-negative versus typical flare performance. Based on literature values for leakage, including the estimate of 0.8% leakage for processes downstream of production and processing, productive use of waste methane is unlikely to be more destructively efficient than a flare. Although waste methane being diverted for productive use arguably would not have been captured without the financial incentive of energy sales, given that capture infrastructure is not free, flaring is most likely the less GHG intensive alternative for waste methane once it has been captured. In a decarbonized energy system where RNG would be less likely to be replacing GHG-intensive fuels (and thus offsetting their emissions), and when a policy regime requiring or incentivizing destruction of GHG-intensive wastes might reasonably be expected to be in place, expected levels of methane leakage suggest that RNG is unlikely to be a low GHG energy resource relative to alternatives.
4. Discussion
RNG is not inherently climate friendly. Based on consideration of both the source of methane used to produce RNG and the likely alternative fate of that methane, and using reasonable assumptions about likely system methane leakage, it is unlikely that an RNG system could deliver GHG-negative, or even zero GHG, energy at scale. Substantial GHG benefits can be attained when waste methane is genuinely diverted from emission to the atmosphere, but the availability of such methane is low (Liu and Rajagopal 2019, US EPA 2019) relative to potential demand for climate friendly RNG, especially when considering that the alternative fate of capturable methane is more likely flaring than venting in a GHG-conscious setting. Under some system leakage rates that have been observed for biogas systems (Liebetrau et al 2017, Scheutz and Fredenslund 2019), RNG might not even meet the less stringent threshold of outperforming FNG from a GHG perspective.
Designing a system that depends on RNG, or delaying transition to a system that does not depend on natural gas because of the promise of RNG, could delay climate mitigation because of induced demand for intentionally produced methane. Particularly given that past experience demonstrates that policy can rapidly drive resource allocation to RNG (Bartoli et al 2019), RNG's environmental performance should be carefully compared with that of its likely long-term competitors—not just FNG—before resources are allocated. Current literature on RNG often assumes the context of a fossil-based system (see e.g. the reference systems for papers included in a review of LCA of biogas production (Hijazi et al 2016)), which leads to the crediting of lower environmental burden relative to this context (e.g. when RNG is given credit for avoided GHG impacts from FNG consumption (Scheutz and Fredenslund 2019, Ramírez-Islas et al 2020)). Such fossil-linked benefits disappear in a context where RNG could be substituting for zero-GHG alternatives like zero-GHG electricity or hydrogen rather than FNG, petroleum fuels, and GHG-intensive electricity.
Even beyond GHG emissions, environmental burdens associated with RNG that are acceptable relative to FNG merit deeper investigation when the alternative is, e.g. zero-GHG electricity. RNG is designed to be effectively indistinguishable from FNG at the point of use, so local combustion impacts are likely to be similar for clean RNG, and potentially worse for less pure RNG (Paolini et al 2018). Upstream of use, RNG would likely have different socioenvironmental impacts than FNG. Although RNG can use existing pipeline and user infrastructure, for example, it would obviate the need for FNG's production infrastructures, which have substantial socioenvironmental impacts (Jacquet et al 2018). RNG production facilities using primarily waste products (e.g. agricultural wastes, landfill gas, wastewater treatment gas, excess electricity generation) would likely not qualitatively change socioenvironmental impacts from those activities, though making certain practices financially viable could extend their life and extent (Haya et al 2019). Relatedly, having access to RNG could extend the life of existing fossil infrastructure, with mixed socioenvironmental outcomes.
To the extent that RNG facilitates lower impact energy systems, e.g. by avoiding the need for mineral (Sovacool et al 2020)- and cost-intensive electricity storage to help match supply and demand (Tarroja et al 2020), some of the marginal impacts of RNG could be offset by system benefits. These benefits are not guaranteed, however. As demonstrated by experience with renewable drop-in transportation fuels, the potential for drop-in renewable fuel use might not actually lead to renewable fuel use (Pouliot and Babcock 2017), and the renewable fuels themselves might have undesirable environmental characteristics (Liu and Rajagopal 2019). This work shows that RNG needs to be carefully evaluated in the context of expected long-run system conditions before it is adopted as a component of a zero GHG energy system, particularly given its potential for methane leakage-related climate pollution.
Acknowledgments
This research did not receive any specific grant from funding agencies in the public, commercial, or not-for-profit sectors. The author thanks two reviewers for their constructive comments.
Data Availability Statement
Any data that support the findings of this study are included within the article.