

Abstract
Bomb cyclones are explosively intensifying extratropical cyclones that can cause severe damage to life and property. However, the poor ability of coarse-resolution climate models to simulate bomb cyclones, including underestimation of the frequency of bomb cyclones, remains a problem. In this study, the dependence of bomb cyclone characteristics on horizontal resolution from 135 to 18 km is investigated by analyzing the outputs of HighResMIP historical simulations of atmospheric general circulation models and four reanalysis datasets. Robust resolution dependence of bomb cyclone characteristics is identified for both the models and the reanalyses. Finer horizontal resolution significantly increases the frequency of bomb cyclones and reduces their average horizontal size. A regression analysis indicates that bomb cyclone frequency is roughly doubled from 140 km to 25 km resolution. The overall increase in bomb cyclone number is associated with a large increase in small bomb cyclones and a moderate decrease in large ones. Bomb cyclones in higher-resolution models are also accompanied by a higher maximum wind speed and more extreme wind events, which is probably related to the increased pressure gradients due to the smaller size of the bomb cyclones. These results imply that high-resolution models should be used for evaluating the impacts of bomb cyclones.
Export citation and abstract BibTeX RIS

Original content from this work may be used under the terms of the Creative Commons Attribution 4.0 license. Any further distribution of this work must maintain attribution to the author(s) and the title of the work, journal citation and DOI.
1. Introduction
Bomb cyclones are explosively intensifying extratropical cyclones that develop in about a day (Sanders and Gyakum 1980) and are usually accompanied by strong winds, heavy precipitation, and high ocean waves, which can cause severe damage to life and property (Kocin et al 1995, Allen et al 2010). Most numerical studies of bomb cyclones were conducted using regional models (e.g. Kuo and Low-Nam 1990, Kuwano-Yoshida and Asuma 2008, Pradhan et al 2019), while the simulation of bomb cyclones remains problematic for atmospheric general circulation models (AGCMs) and coupled general circulation models (CGCMs), which are important tools for making climate predictions and assessing the effects of climate change due to global warming. Seiler and Zwiers (2016) analyzed the outputs of Coupled Model Intercomparison Project Phase 5 (CMIP5) and found that most models significantly underestimate the frequency of bomb cyclones compared with reanalysis data. They suggested that this bias is partly caused by the coarse horizontal resolution of the models, because the bias is smaller in the higher-resolution configuration than in the lower-resolution configuration of the same model. Jung et al (2006) and Champion et al (2011) also found that increasing the horizontal resolution of global models can alleviate the underestimation of the number of intense extratropical cyclones.
The atmospheric horizontal resolutions of the CGCMs examined by Seiler and Zwiers (2016) mostly range from 260 to 80 km, although higher resolutions may affect the development of bomb cyclones further, as found in regional modeling studies. Willison et al (2013) showed a larger number of bomb cyclones occurs in a regional model with 20 km resolution than with 120 km resolution. Seiler et al (2018) reported that downscaling with a 24 km resolution regional model reduces the low-frequency bias of bomb cyclones in a CGCM in CMIP5. A similar improvement was also reported by Zhang and Colle (2018) using a regional model of 0.2° resolution for downscaling. These regional modeling studies demonstrate the benefits of higher resolution in bomb cyclone simulations. However, the downscaling studies showed that downscaling can only reduce the biases but does not solve them, probably because the source of the biases in the parent climate models is inherited by the regional models.
Recent technical developments have allowed global climate models to be directly run at a comparable resolution as the aforementioned regional models. The importance of higher-resolution global models has also been discussed in recent review papers (M J Roberts et al 2018, Schultz et al 2018, Czaja et al 2019). Recently and concurrently, high-resolution climate model outputs with nominal atmospheric resolution of up to 25 km are becoming available to the research community from the HighResMIP project, which is a CMIP6-endorsed model intercomparison project (Haarsma et al 2016). In particular, the HighResMIP protocol is suitable for explicitly evaluating the effects of the horizontal resolution of models because experiments are repeated with lower and higher resolution configurations of the models with minimum additional tuning. By comparing multiple models under the same protocol, one can evaluate the effects of resolution more confidently than using a single model. The HighResMIP results have been analyzed for tropical cyclones (M J Roberts et al 2020), Arctic sea ice (Docquier et al 2019), cloud radiative effects (Thomas et al 2019), and global energy and water budgets (Vannière et al 2019), but have not been studied for bomb cyclones. Thus, in this study, the effects of horizontal resolution on bomb cyclone characteristics are investigated by analyzing the outputs of multiple models from the HighResMIP.
2. Data and methods
The outputs of HighResMIP simulations using six AGCMs for the historical period (1950–2014) were prepared by the EU Horizon 2020 project PRIMAVERA and analyzed in this study. Each model is run at two or three different resolution configurations (table 1). Hereinafter, the resolutions are defined using atmospheric grid spacing at 50°N because mid-latitude events are of interest. The highest model resolution reaches 18 km followed by two models of 25 km resolution, and these resolutions are higher than those used in previous global modelling studies of bomb cyclones. For example, the highest two resolutions analyzed by Seiler and Zwiers (2016) are 40 km and 80 km. The models generally have one ensemble member, whereas HadGEM3-GC31 has three at the time of data analysis. Details of the models can be found in CMCC-CM2-(V)HR4 (Cherchi et al 2019), ECMWF-IFS (C D Roberts et al 2018), CNRM-CM6-1 (Voldoire et al 2019), EC-Earth3P (Haarsma et al 2020), HadGEM3-GC31 (M J Roberts et al 2019), and MPI-ESM1-2 (Gutjahr et al 2019). The simulations start from January 1950 and are forced by observed sea surface temperature, sea ice (HadISST 2.2.0.0; Kennedy et al 2017), CO2 concentration, solar variability, and ozone concentration with fixed land use according to the HighResMIP protocol (Eyring et al 2016, Haarsma et al 2016). More detailed information about the experiment design can be found in Haarsma et al (2016).
Table 1. Models and reanalysis datasets used in this study. The resolutions in kilometers indicate atmospheric grid spacing at 50°N.
| Model name | Resolution | Reanalysis name | Resolution | Time period |
|---|---|---|---|---|
| HadGEM3-GC31 | N96 (135 km) | ERA-Interim | TL255 (72 km) | 1979–2016 |
| N216 (60 km) | ||||
| N512 (25 km) | ||||
| ECMWF-IFS | TCO199 (50 km) | ERA5 | TL639 (28 km) | 1979–2018 |
| TCO399 (25 km) | ||||
| EC-Earth3P | TL255 (71 km) | MERRA2 | 50 km | 1980–2015 |
| TL511 (36 km) | ||||
| CMCC-CM2 | 1° × 1° (64 km) | JRA-55 | TL319 (50 km) | 1959–2014 |
| 0.25° × 0.25° (18 km) | ||||
| MPI-ESM1-2 | T127 (67 km) | |||
| T255 (34 km) | ||||
| CNRM-CM6-1 | TL127 (142 km) | |||
| TL359 (50 km) |
The following reanalysis datasets are used for comparing and validating the model results: European Centre for Medium-Range Weather Forecasts (ECMWF) interim reanalysis (ERA-Interim; Dee et al 2011); NASA Modern-Era Retrospective analysis for Research and Applications, Version 2 (MERRA2; Gelaro et al 2017); Japanese 55-year Reanalysis (JRA55; Kobayashi et al 2015); and the recent Fifth Generation ECMWF Reanalysis (ERA5; Hersbach et al submitted). The reanalysis resolution and time period are also shown in table 1. The grid spacing at 50°N for ERA-interim, which was also examined by Seiler and Zwiers (2016) and Seiler et al (2018) for bomb cyclone studies, is 72 km, and those for MERRA2 and JRA55 are 50 km. The 50–70 km resolutions are coarser than about 20 km spacing of the aforementioned recent regional models, and this suggests that bomb cyclones can be underrepresented in those reanalysis datasets. Indeed, Kodama et al (2019), using a 14 km AGCM simulation, found that the simulated extratropical cyclones are deeper than those in JRA55. The 28 km grid-spacing of ERA5 is somewhat comparable to the regional models.
Global cyclone tracking using the TRACK algorithm (Hodges 1999, Hodges et al 2011) is applied to the model and reanalysis data to identify extratropical cyclone tracks. Cyclones are identified based on local maxima of the 850 hPa relative vorticity field at 6 h frequency with T42 resolution smoothing after the large-scale background is removed (Hoskins and Hodges 2002). Using a common T42 resolution reduces the effect of different original resolutions. The tracking is performed separately in four seasons (December–February, March–May, June–August, and September–November) for each year. To avoid including tropical cyclones, extratropical cyclones are limited to the cyclones with the major part of their life cycle poleward of 30°N/S. Only cyclone tracks that last at least 2 d are retained for further analysis.
Bomb cyclones are identified from the 6-hourly cyclone track data by calculating the 24 h deepening rate (DPR) of sea-level pressure (SLP) minimum in full resolutions normalized at 60° as
where t is the time of the analyzed time step, P is the SLP minimum value in hPa identified near the cyclone center within a certain radius (Bengtsson et al 2009), and ϕ is the latitude of the SLP minimum. The unit of the DPR is bergeron. If the DPR of an extratropical cyclone exceeds 1 bergeron (Sanders and Gyakum 1980) at any time of its life cycle, the cyclone is categorized as a bomb cyclone.
The size of bomb cyclones is then examined by measuring their radii. The cyclone radius is determined based on SLP gradients along radial directions, according to Patoux et al (2009), with the SLP field at the end of the first 24 h period during which DPR exceeds 1 bergeron. To reduce the effect of the original resolutions, SLP fields are regridded to a uniform 55 × 55 km grid using cubic spline interpolation before estimating the radius. Radial SLP gradients are then calculated along eight directions (45° intervals from 0° to 360°) from the cyclone SLP minimum. The radius of a bomb cyclone is determined as the average distance from the SLP minimum to a point where the radial SLP gradient is smaller than 2.5 × 10⁻⁵ hPa m−1 after passing through a local maximum. If the maximum radial SLP gradient does not reach the threshold within the maximum search distance of 1500 km, the distance from the SLP minimum to the gradient maximum is used for calculating the radius.
3. Results
To know how model resolutions influence the spatial distributions of bomb cyclones, bomb cyclone densities in the Northern Hemisphere (NH) is plotted using the locations of maximum 24 h DPR for ERA5 and three HadGEM3-GC31 configurations (figure 1). Bomb cyclones in the NH are generally concentrated near the Gulf Stream and the Kuroshio–Oyashio Extension region (Roebber 1984, Chen et al 1992, Sinclair 1997, Yoshida and Asuma 2004, Zhang et al 2017). The higher-resolution HadGEM3-GC31 configurations exhibit an overall increase in bomb cyclone frequency compared with the lower-resolution configurations, although the spatial distribution patterns of the three configurations are qualitatively identical. Similar increases in frequency in higher-resolution configurations with qualitatively identical spatial distributions are common in the other models in both hemispheres (supplementary figures 1 and 2 (available online at stacks.iop.org/ERL/15/084001/mmedia)). Although a higher horizontal resolution can result in better simulation of bomb cyclones near steep orography (e.g. Jung et al 2006), our results show that the spatial distribution of bomb cyclones is not generally affected by horizontal resolution, while the bomb cyclone frequency is sensitive to resolution.

Figure 1. Maps of bomb cyclone maximum deepening event distribution in NH for ERA5 and HadGEM3-GC31.
Download figure:
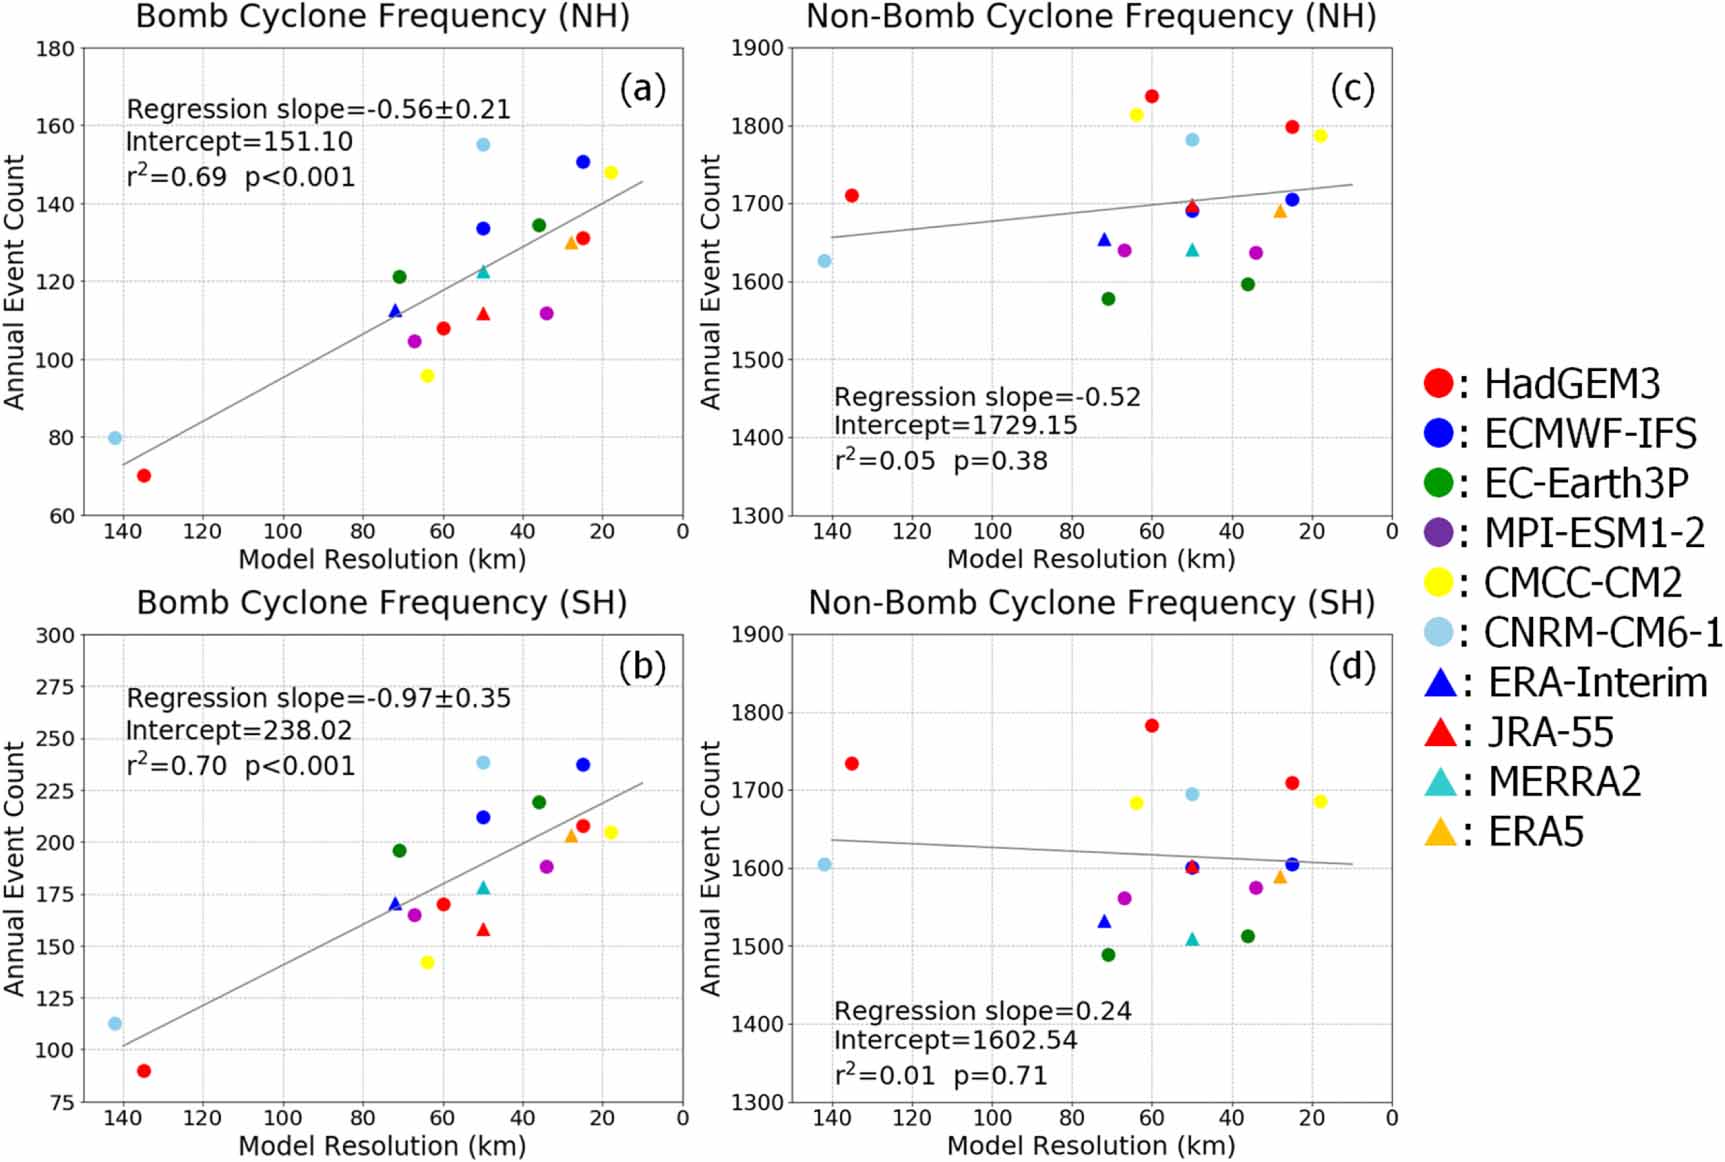
Standard image High-resolution imageTo assess the sensitivity of bomb frequency to resolution more quantitatively, the annual frequency of bomb cyclones and non-bomb cyclones for the models and reanalysis datasets are presented in figure 2. The bomb cyclone frequency exhibits a marked increase with increasing horizontal resolution. A regression analysis indicates an 88.6% increase in the NH and a 109.1% increase in the Southern Hemisphere (SH) as the horizontal resolution is increased from 140 to 25 km. This means that the bomb cyclone frequency in high-resolution simulations is roughly doubled compared to typical CMIP5 simulations (e.g. Seiler and Zwiers 2016). However, no substantial increase in frequency is observed for non-bomb cyclones (figures 1(c) and (d)). The strong dependence of bomb cyclone frequency on horizontal resolution is also common in the reanalysis data. For example, ERA5 with a 28 km resolution has a 15.3% (resp. 19.1%) higher bomb cyclone frequency than ERA-Interim with a 72 km resolution in the NH (resp. SH). In summary, bomb cyclone frequency increases with horizontal resolution in both the AGCMs and the reanalyses.
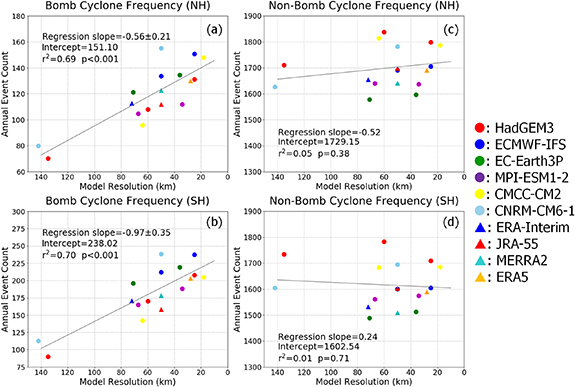
Figure 2. Scatter plots of annual mean bomb cyclone frequency in the (a) NH and (b) SH, and non-bomb cyclone frequency in the (c) NH and (d) SH plotted against model resolution. The linear regression lines are shown in gray. The 95% confidence interval of the regression slope is shown for p value <0.05.
Download figure:
Standard image High-resolution imageTo show how the changes in bomb cyclone frequency are related to the size distribution, histograms of bomb cyclone radii are presented in figure 3. Only bomb cyclones in winter (December–February for the NH, June–August for the SH) with an SLP minimum in the 30°–60°N/S latitudinal band are analyzed here to ensure that the events have similar environmental conditions and are still representative (>50% bomb cyclones occur in winter). For simplicity only NH results are shown in figure 3 since the SH results are very similar. Comparing the lower-resolution and higher-resolution configurations of the same AGCM demonstrates that with increasing resolution, the number of small bomb cyclones increases substantially, accompanied by a moderate decrease in large bomb cyclones (figures 3(a)–(f)). For the reanalyses, a similar difference is found between the 72 km resolution ERA-Interim and 28 km resolution ERA5 (figures 3(g)). These results mean that the overall bomb cyclone frequency increase with resolution shown in figure 2 is due to the greater increase in small bomb cyclones overwhelming the smaller decrease in large bomb cyclones. The significant increase in small-scale events reduces the average size of bomb cyclones for higher resolution in both hemispheres (supplementary figure 3).
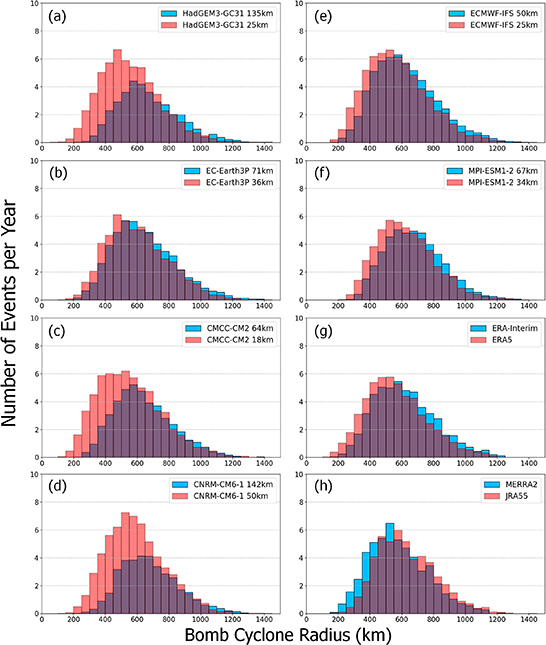
Figure 3. Histograms of wintertime NH bomb cyclone radii for the AGCMs and the reanalysis datasets. The differences of distributions for different resolutions in the same model are statistically significant (p-value <0.001) by a Kolmogorov–Smirnov test for all models.
Download figure:
Standard image High-resolution imageFurthermore, the contraction of the average bomb cyclone size suggests possible changes in the wind field associated with bomb events because winds are related to the SLP gradients near the center, which increase with decreasing bomb cyclone size. In particular, the maximum near-surface (10 m) wind speed attained during a bomb cyclone's lifetime is a key parameter for evaluating its potential damage, and thus analyzed next. The maximum near-surface wind speed for each cyclone track is identified by searching the original 6-houly instantaneous model output within a radius of 6° from the cyclone center, as in Hodges et al (2011). The highest maximum value of each cyclone track is then averaged across tracks. As in the radius analysis, only winter events with the SLP minimum at 30°–60° latitude are analyzed.
Figure 4 shows that the mean maximum near-surface wind speed increases in the AGCMs as the horizontal resolution becomes finer in both hemispheres. Although the reanalyses do not show a similar increase in the near-surface maximum wind speed, they show an increase in 925 hPa maximum wind speeds as the resolution increases (supplementary figure 4). This difference between the near-surface and 925 hPa wind speeds is possibly because the assimilated surface observational data more strongly affects near-surface wind than 925 hPa wind in reanalysis. Bengtsson et al (2009) also reported stronger cyclone winds for general extratropical cyclones at higher resolution, based on the comparison of T63 (208 km) and T213 (63 km) resolution configurations of a single model, but our results indicate that the maximum wind enhancment occurs at resolutions even higher than 60 km for all the models. The present results suggest that for both the AGCMs and the reanalyses, the mean maximum wind speeds of bomb cyclones are sensitive to horizontal resolution.

Figure 4. Scatter plots of the mean bomb cyclone maximum near-surface wind speed against model resolution for the (a) NH and (b) SH in respective winter seasons. The linear regression lines are shown in gray. The 95% confidence interval of the regression slope is shown for p value <0.05.
Download figure:
Standard image High-resolution imageFor a further examination of the maximum near-surface wind speed, its frequency distributions are presented in figure 5. For the same AGCM, the frequency of high wind events increases significantly as the distribution shows an overall shift to higher wind speed with enhanced horizontal resolution (figures 5(a)–(f)). Overall enhancement of maximum wind speed is also found for non-bomb cyclones (supplementary figure 5), but almost all high wind events with maximum near-surface wind >30 m s−1 are associated with bomb cyclones for both the AGCMs and reanalyses. These results indicate that in addition to the influence on mean winds, extreme winds associated with bomb cyclones are strongly enhanced in high-resolution models, and this may have important implications for the prediction of such extreme events in mid-latitudes under a changing climate.
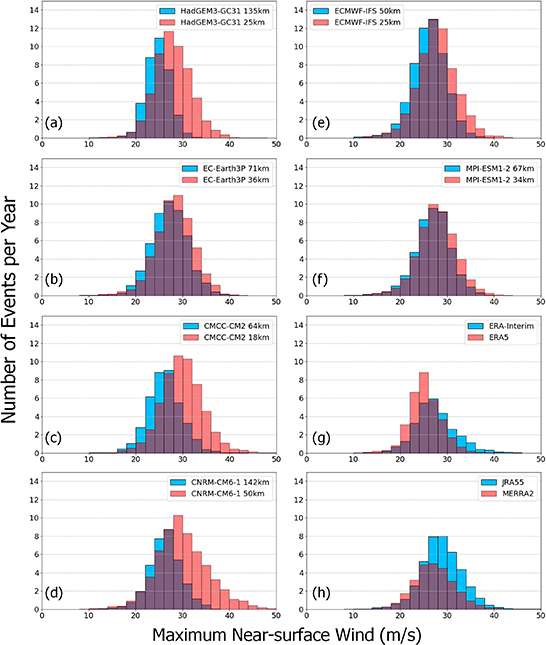
Figure 5. Histograms of wintertime NH bomb cyclone maximum near-surface wind speed for the AGCMs and the reanalysis datasets. The differences of distributions for different resolutions in the same model are statistically significant (p-value <0.001) by a Kolmogorov–Smirnov test for all models.
Download figure:
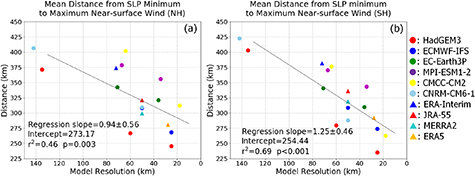
Standard image High-resolution imageThe distance from the maximum near-surface wind speed to the cyclone SLP minimum also exhibits resolution dependence. Figure 6 shows that in the models and reanalyses, this distance decreases as the horizontal resolution increases. Taken together with the results in figure 4, this result means that the maximum wind speed of bomb cyclones becomes stronger and is located closer to the SLP minimum as the horizontal resolution increases. These changes in the maximum wind can be explained by the aforementioned smaller average size of bomb cyclones caused by the significant increase in small-scale events, as steeper pressure gradients in smaller events are responsible for the stronger winds.
Figure 6. Scatter plots of the mean distance from the bomb cyclone SLP minimum to the maximum wind location against model resolution for the (a) NH and (b) SH. The linear regression lines are shown in gray. The 95% confidence interval of the regression slope is shown for p value <0.05.
Download figure:
Standard image High-resolution image
It is worth noting that somewhat similar tendencies of stronger maximum winds and smaller size are also found for non-bomb cyclones (supplementary figure 6). For the maximum near-surface winds, the difference in the regression lines between bomb cyclones and non-bomb cyclones are essentially the parallel shift (figure 4 and supplementary figures 6(a) and (c)). Interestingly, the regression slope of the mean distance from the cyclone SLP minimum to the maximum wind location is significantly steeper for bomb cyclones than non-bomb cyclones in addition to a parallel move (figure 6 and supplementary figures 6(b) and (d)). This suggests processes for resolution dependence can work differently between bomb cyclones and non-bomb cyclones, but to understand more specifically further studies are needed.
4. Conclusions and discussion
Historical AGCM simulations following the HighResMIP protocol conducted by the PRIMAVERA project along with four reanalysis datasets were analyzed to investigate the effect of model horizontal resolution on bomb cyclones. Higher resolutions resulted in a substantially larger frequency of bomb cyclones in the simulations (roughly doubled for a resolution increase from 140 to 25 km). A similar trend was found for the reanalysis datasets. The analysis of bomb cyclone radii revealed that the frequency increase was mainly due to the strong increase in the number of small bomb cyclones overwhelming the weak decrease in the number of large bomb cyclones, which is closely associated with the contraction of the average size of bomb cyclones in higher-resolution models and reanalyses. Another important result is that the maximum wind speed of bomb cyclones increased with increasing resolution, probably due to the stronger pressure gradients of smaller bomb cyclones. The frequency of high wind events with maximum near-surface wind >30 m s−1 also shows a significant increase with enhanced resolution. These results were robust across different AGCMs and were even valid for the reanalysis datasets, thereby indicating that horizontal resolution has a large effect on bomb cyclone simulations. Moreover, these results imply that high-resolution global models are necessary for evaluating the variability and change of global distribution of bomb cyclones. Tropical cyclone analysis of HighResMIP also revealed that there was a larger number of cyclones with stronger winds in high-resolution models than in low-resolution models (M J Roberts et al 2020).
To determine whether the characteristic changes in bomb cyclones are related to other aspects of atmospheric responses, the Eady growth rate (Lindzen and Farrell 1980) and cyclone domain-averaged precipitation (Pfahl et al 2012, Vannière et al 2016) have also been examined. The Eady growth rate can represent the dry dynamics and the precipitation is related to the moist dynamics. Kuwano-Yoshida and Minobe (2017) showed that these metrics are useful for bomb cyclone analysis in their AGCM experiments. However, consistent responses across models could not be identified for these fields (not shown), which suggests that these factors are not the main causes of the highly consistent changes in bomb cyclone characteristics. In a future study, we will investigate further what processes are associated with the differences in bomb cyclone characteristics across different model resolutions.
A caveat, which is not limited to this study, but common to all HighResMIP studies, is that the higher-resolution climate models are not tuned for their resolution and use the same parameterizations and schemes as their respective lower-resolution configurations. This experimental design is useful for clarifying the effect of horizontal resolution, but it means that higher-resolution simulations are not necessarily more realistic than lower-resolution simulations. This potential problem is alleviated here because the present results are supported by the consistent resolution dependence found in the reanalysis datasets, at least qualitatively. In the future, the model results shown in this study should be compared with observations. Promising observational data may be satellite-derived near-surface winds, especially swath data from scatterometer observation such as QuikSCAT to obtain high-resolution spatial structures of wind-stress fields around the center of bomb cyclones. Moreover, to obtain resolution dependence that is quantitatively more accurate, further model development and experiments are needed. In addition, regional modelling experiments can help evaluate the role of parameterizations in bomb cyclone simulation.
The present study demonstrates that the HighResMIP provides valuable datasets for bomb cyclone studies. There is significant room for future research development. How bomb cyclones will change under global warming is an important unanswered question, which we intend to address in a follow-up study using the outputs of future HighResMIP simulations.
Acknowledgments
We thank two anonymous reviewers for their helpful and constructive comments. S M is supported by the Japan Society for the Promotion of Science (JSPS) KAKENHI Grant Numbers 19H05704 and 18H04129. M J R, R H, D P, C D R, E S, L T, B V and P L V acknowledge support from the PRIMAVERA project, which received funding from the European Union's Horizon 2020 research and innovation programme under Grant Agreement No 641727.
Data availability statement
The reanalysis and model data that support the findings of this study are openly available. The HighResMIP simulation output can be obtained via the Earth System Grid Federation (ESGF) nodes, e.g., https://esgf-node.llnl.gov/projects/cmip6/. Further information can be obtained from the following: M J Roberts (HadGEM3-GC31; 2017a, 2017b, 2017c), C D Roberts et al (ECMWF-IFS; 2017a, 2017b), Voldoire (CNRM-CM6-1; 2017, 2018), Scoccimarro et al (CMCC-CM2-(V)HR4; 2017a, 2017b), EC-Earth Consortium (EC-Earth3P; 2018a, 2018b), and von Storch et al (MPI-ESM1-2; 2017, 2019). The reanalysis datasets can be assessed at: ERA-Interim (https://doi.org/10.5065/D6CR5RD9), ERA5 (https://doi.org/10.24381/cds.adbb2d47), JRA55 (https://doi.org/10.5065/D6HH6H41), MERRA2 (https://doi.org/10.5067/A7S6XP56VZWS).