


Abstract
On June 24th 2018 one of the largest UK wildfires in recent history broke out on Saddleworth Moor, close to Manchester, in north-west England. Since wildfires close to large populations in the UK have been relatively small and rare in the past, there is little knowledge about the impacts. This has prevented the development of effective strategies to reduce them. This paper uses a high-resolution coupled atmospheric-chemistry model to assess the impact of the fires on particulate matter with a diameter less than 2.5 µm (PM2.5) across the region and the impact on health from short-term exposure. We find that the fires substantially degraded air quality. PM2.5 concentrations increased by more than 300% in Oldham and Manchester and up to 50% in areas up to 80 km away such as Liverpool and Wigan. This led to one quarter of the population (2.9 million people) in the simulation domain (−4.9–0.7°E and 53.0–54.4°N) being exposed to moderate PM2.5 concentrations on at least one day, according to the Daily Air Quality Index (36–53 µg m−3), between June 23rd and 30th 2018. This equates to 4.5 million people being exposed to PM2.5 above the WHO 24-hour guideline of 25 µg m−3 on at least one day. Using a concentration-response function we calculate the short-term health impact, which indicates that in total over the 7-day period 28 (95% CI: 14.1–42.1) deaths were brought forward, with a mean daily excess mortality of 3.5 deaths per day (95% CI: 1.8–5.3). The excess mortalities from PM2.5 from the fires represented up to 60% of the total excess mortality (5.7 of 9.5 excess deaths), representing an increase of 3.8 excess mortalities (165% increase) compared to if there were no fires. We find the impact of mortality due to PM2.5 from the fires on the economy was also substantial (£21.1 m).
Export citation and abstract BibTeX RIS

Original content from this work may be used under the terms of the Creative Commons Attribution 4.0 license. Any further distribution of this work must maintain attribution to the author(s) and the title of the work, journal citation and DOI.
1. Introduction
The Saddleworth Moor fire in June 2018 was the largest UK wildfire in recent decades, with over double the burnt area of the most recent large wildfire in 2011, in Swinley, Berkshire (RBFARS 2011). It led to the evacuation of many residents from their homes, and caused elevated atmospheric pollutant concentrations across the Greater Manchester urban region (BBC). The fires began on June 24th 2018 and burned for three weeks over Saddleworth Moor (1.96°W, 53.54°N) and Winter Hill (2.52°W, 53.63°N) (figure 1). The fires, which are thought to have been deliberately started, peaked in size on 27th June, covering 8 km2 with flames reaching 4 m in height (GMCA). The fires burned on moorland that was dominated by heather with an underlying layer of peat (GMCA) (figure S1). Peat is exceptionally vulnerable to ignition during periods of drought and once alight it is extremely difficult to control and extinguish because it is a well oxygenated fuel source (Rappold et al 2011). As a result, peat fires can smoulder underground for long periods, re-emerging away from the original source (Rappold et al 2011). Fuel consumption is relatively large in peat fires, emissions per unit area are much higher than for other fuel types (Geron and Hays 2013). Consequently, peat fires emit large dense ground level plumes, meaning that local populations may be more susceptible to smoke exposure than for other wildfire types (Tinling et al 2016). Alongside this, although other studies have suggested that flaming smoke may be more toxic than smouldering smoke on a mass basis (Kim et al 2018, 2019), peat burning produces more smoke and so it has been suggested that the toxicity of smoke from peat fires is different to other wildfires (Reisen et al 2015, Tinling et al 2016), however there is currently limited research on this topic.
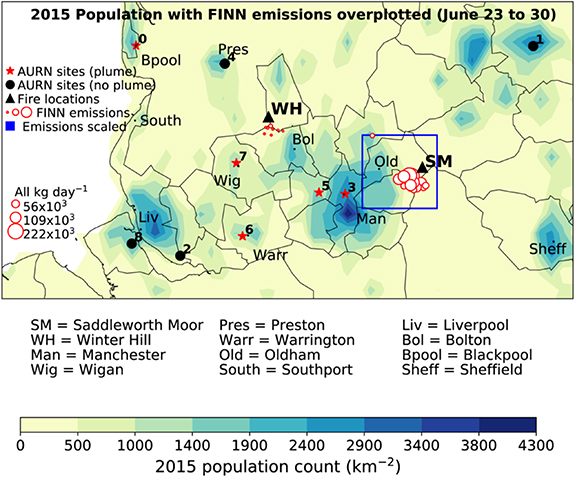
Figure 1. Population count (km−2) (2015) in the model domain with the Automated Urban and Rural Network (AURN) sites used in the model evaluation over plotted (table S1). Sites where elevated PM2.5 was observed are indicated by red stars and those where concentrations remained below 50 µg m−3 by black circles. The locations of Saddleworth Moor and Winter Hill are indicated by black triangles. Fire emissions, from FINNv1.5 (time-varying scaling), between June 23rd and June 30th are indicated by red circles—each circle represents a fire hotpot from MODIS, while the size of the circles is relative to the mass of PM2.5 emitted in kg day−1 (scale on left). The area over which scaling was applied to the FINN fire emissions is also shown by the blue box. More details on AURN sites can be found in table S1.
Download figure:
Standard image High-resolution imageJune 2018 was anomalously warm and dry across the UK. Average daily maximum temperatures were between 18 °C and 22 °C (2.5 °C warmer than the 1981–2010 average) (UKMO 2018) and less than 75 mm rainfall fell during the month (50% of the 1981–2010 average rainfall). There were fewer than 4 d with >10 mm rainfall (UKMO 2018). These conditions led to the peat on the moor becoming particularly susceptible to ignition.
Wildfires emit large amounts of pollutants and have substantial impacts globally on the radiative balance Hodzic et al 2007; Rappold et al 2011), cloud microphysical properties (Lu and Sokolik 2013, Jiang et al 2016), air quality (Jaffe and Wigder 2012; Reddington et al 2014, Crippa et al 2016) and therefore health (Rappold et al 2011, Johnston et al 2012, Liu et al 2015, Jones et al 2015). Wildfires are an increasing environmental and health concern that are projected to occur more frequently, become more intense and spread much more quickly in the future (IPCC 2014). It is projected that by 2080 the combination of higher temperatures, decreased summer rainfall and drier soils could led to a 30%–50% increase in UK wildfire risk (UK CC Risk Assessment 2012, 2012). Peat bogs, which account for over 22 000 km2 of UK land cover (Xu et al 2018), are particularly vulnerable to wildfire.
As a result of the predicted increase in wildfires, population exposure to pollutants from fires is also expected to increase. Substantial evidence supports the association of short-term exposure to PM2.5 from fires and respiratory and cardiac morbidity and mortality from both epdiemiological (Zanobetti et al 2009, Delfino et al 2009, Johnston et al 2011, Reid et al 2016) and toxicology studies (Naeher et al 2007). However, there is a large amount of conflicting research on the toxicity of different species and so equal toxicity between PM components is still commonly assumed (Atkinson et al 2014) but is an active area of research. The health burden of fires in the tropics and United States, Australia and Canada is well documented in the literature (Johnston et al 2011, 2012, Reisen et al 2011; Finlay et al 2012, Liu et al 2015, Crippa et al 2016, Reid et al 2016, Landis et al 2018) and is significant. The large wildfires during 2015 in Equatorial Asia led to 69 million people being exposed to unhealthy levels of PM2.5 and are estimated to have caused 11 880 excess mortalities due to short-term exposure (Crippa et al 2016).
Alongside the significant health impacts of wildfires there is also a large associated socioeconomic cost (Kochi et al 2012, Fann et al 2018). The concept of Value of Statistical Life, how much society is willing to pay to preserve a life or extend it, is used by studies to estimate the economic value of short-term excess deaths and hospital admissions during wildfires. Using this method it is estimated that in the US between 2008 and 2012 the economic cost of short-term exposure to wildfire air pollutants was $63bn (95% CI $6bn-$170bn), while for long-term wildfire air pollutant exposure the cost was $450bn (95% CI $42bn-$1200bn) (Fann et al 2018).
Since wildfires close to highly populated areas are relatively rare in the UK, little research into the health and economic impacts of UK wildfires has been carried out. However, as fires are predicted to increase with the warming climate and land-use change it is becoming increasingly important to examine wildfires in a UK context. Previous studies elsewhere in the world have found that public health tools and educational programmes to reduce exposure yield significant health benefits from reduced mortality and exacerbations of underlying illnesses (Rappold et al 2014). Many countries also have both 'Fire Danger Ratings' and 'Fire Warning Systems'. These are used to inform the public of the daily fire risk, based on weather forecasts and fuel loading, and provide updates on current active fires. Other countries also often have severe penalties for arson, with high conviciton rates every year, and high rewards for information on suspected arsonists (up to $50 K (DFES 2018)). However, at present, a lack of knowledge about the impacts of wildfires in the UK prohibits the development of effective strategies to reduce their impacts.
In this paper we use the Saddleworth Moor Fires in June 2018 as a case study to calculate the potential health and economic impacts of exposure to PM2.5 from wildfire on the UK population using a high resolution air quality model. The results of this study aim to quantify the population's exposure to PM2.5 from the fires and the subsequent health impact. This will help to inform legislation makers, based on the impacts of the Saddleworth Moor Fires, whether there is a need to introduce preventitive measures and emergency planning for fires to reduce the population's exposure to harmful pollutants.
2. Method
2.1. WRF-Chem
This study uses WRF-Chem v3.7.1 (Grell et al 2005), a fully coupled atmospheric chemistry model at 10 km resolution, to simulate hourly PM2.5 concentrations during the Saddleworth Moor fires 2018. The study domain covers northern England (−4.9–0.7°E and 53.0–54.4°N) and a population of 14 million people. Our simulations are performed using the same model version and set-up as Conibear et al (2018a), Reddington et al (2019) and Kiely et al (2019). For a more detailed model description refer to Conibear et al (2018a).
Meteorological initial boundary conditions (IBC) were provided by the National Centers for Environmental Prediction (NCEP) Global Forecasting System (GFS) reanalysis (meteorology) at 6-hour time steps and 0.5° resolution. Chemical IBC are from the Whole Atmosphere Community Climate Model (WACCM) (Marsh et al 2013) (NCAR 2018). An updated MOZART-4 (Emmons et al 2010) scheme is used to calculate gas-phase chemical reactions. Aerosol dynamics and processes were represented by the Model for Simulating Aerosol Interactions and Chemistry (MOSAIC), which included aqueous chemistry and extended treatment of organic aerosol (Hodzic and Knote 2014). Four bins were used represent aerosol size: 0.039–0.156 µm, 0.156–0.625 µm, 0.625–2.5 µm and 2.5–10 µm. WRF was nudged on all 33-vertical terrain following levels every 3 h in order to keep mesoscale meteorology in line with the reanalysis meteorology from GFS (NCEP 2007). Variables nudged included horizontal and vertical wind, potential temperature and water vapour mixing ratio.
Monthly anthropogenic emissions were from the Emission Database for Global Atmospheric Research with Task Force on Hemispheric Transport of Air Pollution version 2.2 (EDGAR-HTAP2) (Janssens-Maenhout et al 2015) at 0.1° resolution for 2010 (see SM section 3.2 for more information). Biogenic emissions were calculated online by the Model of Emissions of Gases and Aerosols from Nature (MEGAN) (Guenther et al 2006). Dust emissions are also calculated online using the GOCART with Air Force Weather Agency (AFWA) modifications (LeGrand et al 2019).
We calculate the contribution of the fires between June 16th and July 14th 2018 on PM2.5 surface concentrations by comparing simulations with and without fire emissions included.
2.2. Wildfire emissions
Wildfire emissions are taken from the Fire Inventory from NCAR version 1.5 (FINNv1.5). The FINNv1.5 emissions dataset combines satellite observations, land cover, biomass consumption estimates and emissions factors to calculate fire emissions globally at 1 km resolution every day. Satellite observations from the MODIS Thermal Anomalies Product provide detections of active fires with a nominal horizontal resolution of ∼1 km2. Burned area is assumed to be 1 km2 for each fire identified and scaled back based on the density of vegetation from the MODIS Continuous Fields (VCF) (i.e. if 50% bare =0.5 km2 burned area). The type of vegetation burned during a detected fire is determined using the MODIS Collection 5 Land Cover Type (LCT). This assigns each fire pixel to one of 16 possible land cover/land use classes and also the density of vegetation at 500 m resolution, scaled to 1 km. The 16 land cover types are then aggregated into 8 generic categories to which fuel loadings are applied (Wiedinmyer et al 2011). Fuel loadings are from Hoelzemann et al (2004) and emissions factors are from Akagi et al (2011), McMeeking (2008) and Andrae and Merlet (2001). FINNv1.5 includes all emissions from above ground vegetation but not from the combustion of peat (Kiely et al 2019).
We compare the FINN burned area (1 km resolution) with MODIS burned area (500 m resolution) in order to evaluate whether the resolution of the MODIS hotspot data used within FINN to estimate emissions is able to represent the fire size correctly, and thus emissions. We find the burned areas to be very similar for FINN (9.77 km2) and MODIS (8.43 km2) and the datasets to be in agreement spatially. The burned area in FINN is likely to be slightly higher than MODIS because of the lower resolution of the dataset. Since the Saddleworth Moor fires occurred on an area that is dominated by peat bog, with overlying vegetation including heather, grass and juniper (GMCA; Xu et al 2018) (figure S1), we are confident the need for scaling emissions is due to the missing peat emissions rather than an error relating to fire size.
We therefore scale all FINN emissions over the Saddleworth Moor region (figure 1 and figure S1) to account for the underestimation of emissions in the dataset due to the missing peat emissions. Scaling is performed equally across all FINN emission species, and is altered daily to match the daily mean observations of PM2.5 at AURN sites (see table S2 for AURN sites). We scale emissions by a factor 5 on June 26th and a factor 10 on 27th, 28th and 29th. On all other days, we use the original unscaled FINN emissions. More details on the evaluation of FINN scaling can be found in the supplementary material (SM sections 2 and 4 and figures S2 and 3).
2.3. Model evaluation
Hourly observations of PM2.5 from the Automated Rural and Urban Network (AURN) in the UK are used to evaluate the model's performance at hourly and daily temporal resolution. We evaluate the model against all AURN sites in the north-west and Yorkshire and Humber regions of England, which are mostly urban sites (see table S1 and figure 1 for more details). Daily means are calculated from hourly data for days where >90% of data is available at a given site.
2.4. Health impact assessment
The health impact from short-term exposure to elevated pollutants from the Saddleworth Moor fires can be calculated using an exposure response function:
where:
and:

Em represents the excess mortality caused by exposure to PM2.5 over the safe limit of exposure (X–X0) each day. N is the number of days within the simulation and i is the day in simulation, Bd is the baseline death rate, pop is the population exposed and AF is the attributable fraction of mortality due to exposure to PM2.5. The AF is calculated using the concept of relative risk (RR), this is the probability of mortality from a disease endpoint within an exposed population compared to the probability of mortality within an unexposed population (ß). The concentration a population is exposed to is given by X and the safe-limit of exposure is X0. Since there is little evidence to suggest a safe-limit of exposure to PM2.5 we assume X0 to be zero (Holgate 1998, Schmidt et al 2011, Macintyre et al 2016). We use beta values from Atkinson et al (2014) for PM2.5 (1.04% (95% CI: 0.52%, 1.56%) per 10 μg m−3 increase). Since short-term health impacts are assumed to be equal across ages, we use baseline mortality rates for all ages and population for all ages in the calculations (Atkinson et al 2014).
The health impact assessment is carried out using the 'subtraction' method, which is the one most commonly used in short-term health impact studies (Macintyre et al 2016; Crippa et al 2016). This method calculates the excess mortality from fires (Em FIRES ONLY) to be the difference between the excess mortality from PM2.5 in the simulation with fires on (Em FIRES ON) and excess mortality from PM2.5 when there are no fires in the simulation (Em FIRES OFF) (equation (4)).

We use population count data from the Gridded Population of the World, Version 4.11 (CIESIN 2018) for 2015 at 5 km resolution. The dataset is created by the Centre for International Earth Science Information Network (CIESIN) and was accessed from the National Aeronautics and Space Administration (NASA) Socioeconomic Data and Applications Centre (SEDAC). The dataset uses estimates of human population based on the national census and population registers. Input data from 2005–2014 are extrapolated to produce estimates of population for 5-year increments. A map of this population data in the north-west of England is available for reference (figure 1). Baseline mortality rate data for north-west England is taken from the Global Burden of Disease for 2015 (IMHE 2018).
2.5. Economic cost of fires
The economic cost of mortality caused by exposure to PM2.5 from the fires is calculated using the 'Value of Prevented Fatality' (VPF) from the UK Department for Transport. The VPF was initially used to evaluate transport projects which entail expected reductions in fatalities (Guria et al 2005). However, in recent years, many other government sectors, such as the UK Environment Agency and Health Protection Agency, have begun to utilise the concept (Deloitte 2009). Several other studies have used this method to quantify the benefits of air quality improvements from reduced mortality (Krupnick et al 1996, US EPA 1997). There is a large range in estimates for VPF so we use values from the Department for Transport since these are based on UK costs of mortality and lie within the range of other estimates (see SM table S4 and SM section 6 for more details). The estimates are broken down into human costs, medical costs, lost output and other costs. Values are given in GBP for 2008, which we scale to 2018 values in line with inflation (Bank of England 2019). The human cost component reflects the pain and suffering felt by the victim and relatives and the reduction in life quality during the period of injury. Thus, the human cost is derived from the 'Willingness to Pay' of the population to reduce this risk. Medical costs represent all treatment costs and lost output represents working days lost and therefore, the total expected lost earnings before tax, as well as national insurance payments. Other costs represent emergency services and benefits.
3. Results
3.1. AURN observations
AURN observations (figure 2) indicate PM2.5 concentrations at 5 locations in the north-west exceeded 100 µg m−3 between June 16th and July 14th 2018. As expected, concentrations were highest at sites near to Saddleworth Moor, reaching 140 and 225 µg m−3 on June 27th and 28th at Manchester Piccadilly and Salford Eccles respectively (figure 2). They also reached >175 µg m−3 at Wigan Centre, 50 km from the fires. Other sites in the network were relatively unaffected by the fires, with little variation in concentrations during the fires (figure 2).

Figure 2. Hourly observed and simulated surface PM2.5 between June 16th 2018 and July 14th 2018. Modelled values are from the time-varying scaling simulation (see sections 2.2, 3 and table 2), in magenta, and observations from AURN sites are in black. Locations where PM2.5 observations are elevated are shown by red stars and time series site names in red. The period when the Saddleworth Moor and Winter Hill fires occurred is indicated in grey shading.
Download figure:
Standard image High-resolution image3.2. Model evaluation
The model is evaluated using Pearson correlation coefficient (r), mean bias (MB), normalised mean bias (NMB), root mean square error (RMSE), mean absolute error (MAE) and normalised mean absolute error (NMAE). Firstly, when assessing model performance at the daily resolution, without scaling FINN fire emissions (no scaling), the model performs relatively poorly (table 1 and figure S2). The Pearson correlation score is similar to the simulation without fire emissions (no fires) (0.69 and 0.62 respectively). RMSE (5.06 µg m−3), NMB (−0.22) and NMAE (0.33) are also similar to with no fire emissions (5.30 µg m−3, −0.24 and 0.34 respectively). Referring to the time series from each AURN site it becomes clear the poor performance of the model is dominated by sites where fire emissions are not being captured well (see figures S2 and S3). When a factor 10 scaling (10 × scaling) is applied to FINN emissions over Saddleworth Moor the correlation is improved (0.74) and NMB is substantially improved (0.10) (table 1). The RMSE (4.31 µg m−3) and NMAE (0.31) also improve. However, the model still over predicts PM2.5 in the early stages of the fire (see SM figure 2). The over prediction may be due to a change in fuel source through the fire lifetime, from the surface vegetation (heather and grass) initially, which FINN accounts for, to underlying peat once the surface vegetation has been consumed (GMCA 2019). Peat has much higher emissions per unit burnt (9.1 g kg−1 burned (but estimates range from 6–30 g kg−1) compared with 6.3–15.3 g kg−1 for other vegetation types burned (GFEDv4)). Alongside this, FINNv1.5 does not account for whether burning is smouldering or flaming, which can change emissions significantly, particularly in peat fires where emissions are highest during smouldering due to colder combustion temperatures (Stockwell et al 2016). To try to account for the change in fuel type we perform a simulation where we adjust the scaling of the fire emissions each day (see section 2.2 for more details on scaling). Using a daily time-variant scaling (Time-varying scaling) we improve RMSE (4.27 µg m−3) and Pearson correlation (0.77) and find the simulation has a similar NMAE (0.31) when compared with factor 10 scaling (10 × scaling: RMSE = 4.31 µg m−3, r = 0.74 and NMAE = 0.31) (see table 1). Time-varying scaling also performs best at hourly time resolution with improved correlation (0.42), RMSE (7.11 µg m−3) and NMAE to 0.47 (compared with factor 10 scaling and no scaling simulations (r = 0.37 and 0.351, RMSE = 7.557 and 7.78 µg m−3))and the removal of the over prediction at the start of the fires (see SM figure 2). We therefore use the time-variant scaling of FINN emissions as our best-estimate (more details in SM sections 2 and 4)
Table 1. Model evaluation statistics for WRF-Chem simulations with different FINNv1.5 options for daily mean PM2.5. Statistics shown are the mean value of Pearson correlation coefficient (r), mean bias (MB), normalised mean bias (NMB), root mean squared error (RMSE), mean absolute error (MAE) and normalised mean absolute error (NMAE) at each AURN site for the entire simulation (June 16th 2018 to July 14th 2018). Simulations shown are for FINNv1.5 with no alterations (no scaling), FINN v1.5 with factor 10 scaling over Saddleworth Moor (10x scaling), FINN v1.5 with changing scaling to account for the different stages of the fire (time-varying scaling) and simulations with (no fire emissions). See section 2.2 and figure S1 for more details on time-varying scaling.
| Daily Evaluation Statistic | Time-varying Scaling | 10x Scaling | No Scaling | No Fire Emissions |
|---|---|---|---|---|
| Pearson Correlation (r) | 0.77 | 0.74 | 0.69 | 0.62 |
| Mean Bias (MB) | −1.59 | −0.95 | −1.84 | −1.98 |
| Normalised Mean Bias (NMB) | −0.19 | −0.10 | −0.22 | −0.24 |
| Root Mean Square Error (RMSE) | 4.27 | 4.31 | 5.06 | 5.30 |
| Mean Absolute Error (MAE) | 2.30 | 2.22 | 2.48 | 2.59 |
| Normalised Mean Absolute Error (NMAE) | 0.31 | 0.31 | 0.33 | 0.34 |
3.3. Impact on air quality
Using WRF-Chem simulations we calculate the percentage increase in PM2.5 at the surface due to fires as  , where PM2.5 from the simulation with fire emissions is labelled as PM2.5 Fires and PM2.5 from the simulation without fire emissions is labelled as PM2.5 No Fires. Between June 23rd and June 30th 2018 model simulations indicate the mean increase in PM2.5 due to fires (figure 3(c)) is largest in the area surrounding Oldham (>300% increase). However, there is also a 150%–200% increase in PM2.5 in Manchester, Bolton and Wigan. Areas as far away as Liverpool, Preston and Warrington are also affected with 10%–50% increases in PM2.5 observed. Daily mean percentage increase in PM2.5 from fires indicates that the largest increase in PM2.5 observed is due to the Saddleworth Moor fires (figure S6) on the 26th and 27th June. Results indicate PM2.5 increases of >600% in Manchester, Bolton and Wigan and >1000% in Oldham were due to the fires (figure S6). Large areas of the north-west also experience >350% increase in PM2.5, including Wigan, 50 km from the fires, and a 100% increase is observed as far west as the Irish Sea. Simulations indicate the Winter Hill fires on June 29th and 30th were also associated with PM2.5 increases of 100 to >600% in Bolton, Wigan and Southport (40 km away) (figure S6). The Winter Hill fire was substantially smaller and occurred further north where the population density is lower. In summary, WRF-Chem simulations of wildfire impacts on atmospheric composition indicate an extensive area in which particulate matter concentrations were enhanced, far above normal regional and UK levels.
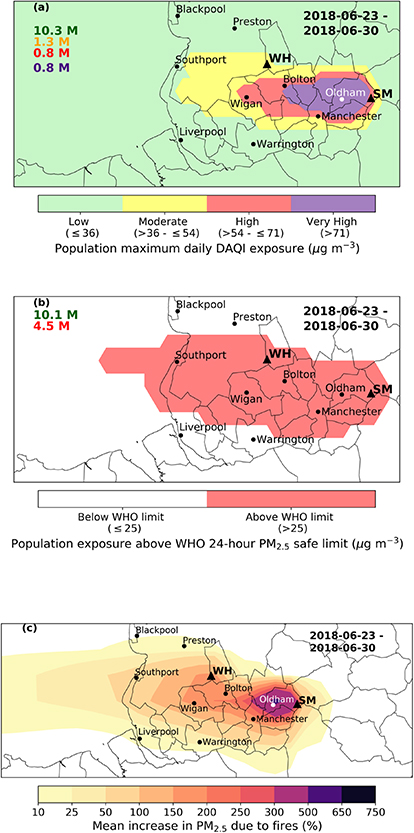
Figure 3. (a) Areas of low (≤ 36 µg m−3), moderate (36— ≤ 53 µg m−3), high (54— ≤ 70 µg m−3) and very high (> 71 µg m−3) PM2.5 as defined by the Daily Air Quality Index (DAQI). Coloured numbers correspond to total number of people exposed to each DAQI level on at least one day between June 23rd and June 30th 2018. See table S2 for more information on the DAQI. (b) Areas where PM2.5 is above the WHO 24-hour limit of 25 µg m−3 and total population exposed to PM2.5 below (green) and above (red) this threshold on at least one day between June 23rd–June 30th. (c) Mean increase (%) in PM2.5 due to fires between June 23rd and June 30th 2018. Calculated as,  , where 10 represents a 10% increase in PM2.5. Locations of large urban areas and Saddleworth Moor (SM) and Winter Hill (WH) are also indicated for reference.
Download figure:
Standard image High-resolution image3.4. Daily air quality index and WHO guideline
To put these results into the context of air quality guidelines, we use the Daily Air Quality Index (DAQI) values and the World Health Organisation (WHO) 24-hour guideline for PM2.5 combined with population count to estimate the population exposure (figures 3(a) &(b)). A limitation of this method is that it assumes the population living in the affected area is exposed to PM2.5 from the fires, however this may vary based on whether the environment they are in provides any passive or active filtration (e.g. indoor air filtration) and does not account for how much time is spent outdoors. The DAQI is used to advise the UK population on recommended behaviour changes during air pollution events. For example, the advice for PM2.5 within the very high DAQI band is for everyone to reduce outdoor activity, and for those with asthma to be aware for the potential need for increased medication (see table S2 for more details on DAQI bands). Between June 23rd and June 30th 0.8 million people were exposed to the highest DAQI band (very high: >71 µg m−3) in areas close to the Saddleworth Moor fire (figure 3(a)). This exposure was dominated by PM2.5 on June 27th (0.5 million exposed) but 0.2 million people were also exposed to very high levels of PM2.5 on June 26th (see figure S4) (note totals may not add up due to rounding). 0.8 million people were exposed to concentrations above 54 µg m−3 (high DAQI: 54–70 µg m−3) and 1.3 million people to 36–54 µg m−3 (moderate DAQI) (figure 3(a)). The degradation in air quality was dominated by the Saddleworth Moor fires since exposure to the Winter Hill fire accounted for only 5% of the total moderate DAQI exposure (0.06 million to moderate DAQI levels on June 30th) (see figure S4). This is likely in part because the area surrounding Winter Hill is more sparsely populated. Nonetheless, these results indicate almost a quarter of the population within our simulation domain (22% of the total 14 million people in the model domain) were exposed to concentrations of >36 µg m−3 on at least one day between June 23rd and 30th due to the Saddleworth Moor and Winter Hill fires. When we compare these results with the PM2.5 No Fires simulation (figure S7), in which no day exceeds the low DAQI, it is clear that the fires are responsible for the degradation in air quality during this time period.
We also frame our results in the context of the WHO 24-hour guideline of 25 µg m−3 (figure 3(b)). Results show that 4.5 million people were exposed to PM2.5 above this guideline for at least one 24-hour period between June 23rd and 30th. The impact was widespread, affecting Oldham, Manchester, Wigan and areas of high population on the coast north of Liverpool (for further detail see figure S5).
In addition, we examine the fraction of the total annual DAQI high (48–71) and very high (71+) hourly exceedances which the fires represent at each of the AURN sites used in this study. We find that hourly DAQI exceedances during the fire period (June 23rd–June 30th) represented a large fraction of the total annual high (48–71) and very high (71+) DAQI hourly exceedances at many sites (table S5(a)). At Manchester Piccadilly, Salford Eccles and Wirral Tranmere 31%, 77% and 58% of total annual hourly DAQI very high exceedances occurred within the week of the fires (see table S5(b) for more details). Thus, not only did the fires have a large impact on air quality between June 23rd and 30th but they also represented a large fraction of the annual hourly DAQI exceedances.
3.5. Health impact assessment
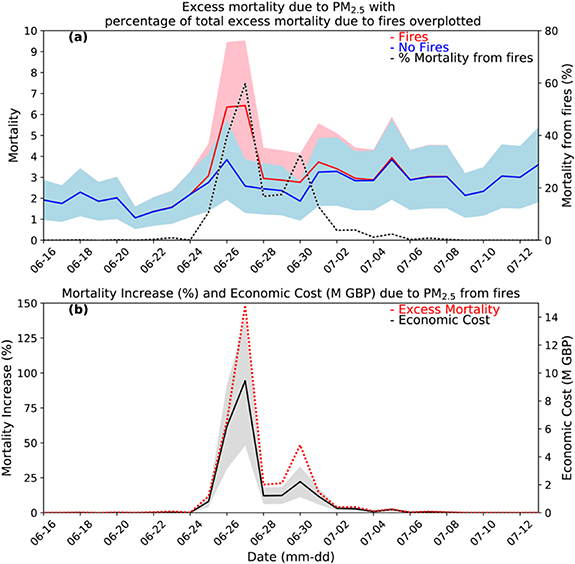
Finally, we calculate the short-term mortality burden due to exposure to PM2.5 from the fires and the economic cost, using the subtraction method detailed in section 2.5. We use the concentration response function of Atkinson et al (2014) with no assumed safe-limit of exposure (0 µg m−3) since there is little evidence in the current literature to suggest that there is a safe level. In total over the 7-day period of the fires there were 28 (95% CI: 14.1–42.1) deaths brought forward with a mean daily excess mortality of 3.53 deaths per day (95% CI: 1.77–5.26) (figure 4(a)). This comprises a large fraction of the total 81 deaths brought forward over the four-week simulation (16th June–14th July). When the fraction of daily mortality from fires is calculated (i.e.  ) the impact of the fires is even more apparent (figure 4(a)). On June 23rd and 24th, the fraction of total excess mortality caused by fires is very low (0.08%–0.9%) but substantially increases during the fires (25th and 26th–11%–39%), peaking at ∼60% on June 27th and 33% on June 30th. Thus, the increase in excess mortality observed during June 23rd–30th 2018 was dominated by the Saddleworth Moor and Winter Hill fires
Figure 4. (a) Total Excess Mortality (Em) across the entire simulation domain from PM2.5 in the fires and no fires simulations. The fraction of mortality due to fires across the model domain between June 16th–July 14th 2018 is also shown, calculated as ( ). 95% confidence intervals, based on uncertainty in the concentration-response function, are indicated by red and blue shading. (b) Percentage increase in excess mortality (Em) due to fires (
 ), with the economic cost of mortality from fires (in millions of pounds (M GBP)) also shown.
Download figure:
Standard image High-resolution image
In order to make our results comparable to other research in the literature we also calculate the percentage increase in excess mortality (Em) due to short-term exposure to PM2.5 from the fires only ( . This gives a result that is independent of the population size, since the population in the domain is relatively small (14 million) in comparison to other studies. The results indicate that up to 3.8 of 6.4 excess mortalities were due to exposure to PM2.5 from the fires, representing a 165% (95% CI: 84%–246%) increase in Em across the region due to exposure to PM2.5 from the fires (figure 3(b)). While, the Winter Hill fire was associated with 1.9 of 2.8 total excess mortalities, a 96% (95% CI: 48%–131%) increase in Em. In total over the 7-day period of the fires there were 7 (95% CI: 4–11) deaths brought forward with a mean daily excess mortality of 0.9 deaths per day (95% CI: 0.5–1.4) (figure 4(a)). This comprises a large fraction of the total 20 deaths brought forward over the four-week period simulated (June 16th–July 14th 2018). Thus, the increase in excess mortality observed during June 23rd–30th 2018 was dominated by the Saddleworth Moor and Winter Hill fires.
3.6. Economic impact
The economic cost of mortality caused by exposure to PM2.5 from the fires is calculated using the 'Value of Prevented Fatality' (VPF) from the Department for Transport. (see section 2.4, table S4 and supplementary material section 6 for more details). Our results indicate the fires were associated with a £21.1 m economic cost between 23rd–30th June (95% CI: £10.7 m–31.2 m based on calculated excess mortality uncertainty (95% CI)) (see table 2(a) for more details). The estimates are broken down into human costs, medical costs, lost output and other costs (table 2(b)) (see section 2.4 for more details). This indicates the economic cost of the fires is dominated by the human cost (£13.9 m) and lost output (£7.0 m). The estimated economic cost of the fires suggests there are large economic gains to be made through the introduction of policies and education programmes to reduce the population's exposure to harmful air pollutants from fires.
Table 2. (a) The economic cost of fatality during the Saddleworth Moor Fires, calculated using the value of protected fatality (VPF) from the Department for Transport (DfT). The cost is calculated using the lower, mid and upper excess mortality from short-term exposure to PM2.5 between June 23rd and 30th 2018 and the VPF for 2018 (£1.9 M—see supplementary material table 3(a) for more details). (b) The cost breakdown is also shown (see table S4(b) for further details), based on the central excess-mortality estimates.
| (a) | Lower | Mid | Upper | |
|---|---|---|---|---|
| Excess Mortality Estimate (June 23rd–30th) | 4.4 | 8.6 | 12.7 | |
| Economic Cost of Fatality (using 2018 DfT VPF) | £ 10.7 M | £ 21.1 M | £ 31.3 M | |
| Total VPF | 21.1 M | |||
| Human Cost | 13.9 M | |||
| Medical | 0.07 M | |||
| Lost Output | 7.0 M | |||
| Other costs | 0.15 M | |||
4. Discussion and conclusions
In order to contextualise our work, we compare our results to previous studies on wildfires and UK air quality. Work by Kollanus et al (2016) calculated the mortality across Europe from vegetation fires during 2005 and 2008, aggregated by country. They found that in the UK the total attributable deaths in 2005 and 2008 from vegetation fires were 52 (95% CI: 40 & 65) and 42 (95% CI: 32 & 52) respectively. Equivalent to a total of 0.08 (95% CI: 0.06 & 0.11) and 0.07 (95% CI: 0.05 & 0.08) deaths per 100 000 population. Although our results are not directly comparable to those of Kollanus et al (2016), due to the Kollanus et al (2016) estimate being for long-term exposure, it is still interesting to note that the Saddleworth Moor and Winter Hill fires alone led to 0.008 deaths per day per 100 000 population.
Our results also lie within the range of estimates from studies on the short-term health impacts of fires elsewhere in the world. Hänninen et al (2009) found that long-range transport of PM from wildfires in eastern Europe led to an additional population-weighted exposure of 15.7 µg m−3 for 2 weeks in August 2002. The study estimated the excess mortality burden to be 17 deaths in a population of 3.4 million during the two-week period. This equated to 0.0353 deaths per day per 100 000 population—substantially higher than the estimates in this study (0.008). This may be as a result of Hänninen et al (2009) overestimating exposure in non-urban areas of Finland, since they used 8 monitoring sites to characterise exposure over a 100 000 km2 area with 3.4 million inhabitants. Our estimates are closer to those of Fann et al (2018) who calculated the health and economic impact of wildfires across the US between 2008 and 2012. The study used the same method as this study but using the CMAQ air quality model run with and without fire emissions. They found that on average 0.00171 excess mortalities per 100 000 population each day were caused by PM2.5 exposure from wildfires. A limitation of our work and previous work is that the exposure response function used treats all PM2.5 as equally toxic and the effects of concentration to be linear. This is because of a lack of studies in the literature investigating toxicity of PM2.5 and composition. Despite this, recent toxicology and epidemiological studies suggest that particulate matter from peat fires causes lung inflammation and cardiac responses and has a significant effect on respiratory and cardiac health (Rappold et al 2011, Kim et al 2014).
Finally, although they are not directly comparable, it is important to put the calculated health impact of the fires into context of the long-term impact of exposure to ambient pollution in this region. The long-term impact of ambient PM2.5 on the population in the north-west and Yorkshire regions is ∼4400 deaths per year, based on 2010 PM2.5 concentrations (Gowers et al 2014). This long-term chronic effect of ambient PM2.5 is somewhat larger than the calculated impact of the fires, however the impact of the fire episode represents an important acute increase in mortality over the short-term.
To conclude, this study is the first to quantify the impact of the 2018 UK wildfires on human health. We have shown that the fires had a substantial impact on air quality in the north-west of England, with observations of PM2.5 concentrations reaching up to 225 µg m−3 at some locations. This equated to up to a >1000% increase in PM2.5 and led to 22% of the population (2.9 million) in the simulation domain being exposed to PM2.5 concentrations of 36 µg m−3 or above on at least one day during the fires (June 23rd−30th). 4.5 million people (or 32% of the population) were exposed to PM2.5 above the WHO 24-hour guideline of 25 µg m−3 on at least one day. When we calculated the excess mortality from fires we found that there were 81 (28) excess deaths over the month (fire week) simulation due to PM2.5 exposure, with 8.6 (8.6) excess deaths attributable to PM2.5 from fires. Daily excess mortality indicated that during the fires (June 23rd–30th 2018), up to 60% of mortality (3.8 of 6.4 excess mortalities) was attributable to PM2.5 from fires. This represented up to a 165% increase in excess mortality compared to without fires. In addition to this, the fires also had a substantial economic impact (£21.1 m). Previous studies have found public health tools and educational programs to reduce exposure yield significant health and economic benefits from reduced mortality and exacerbations of underlying illnesses. Since wildfires are likely to become more common due to climate change our work demonstrates the importance of the introduction of both public health tools and educational programs to reduce the impacts of such events.
Acknowledgments
Observations of PM2.5 were accessed from the Department of Environment, Food and Rural Affairs (DEFRA) online from: https://uk-air.defra.gov.uk/data/. Gridded population data was accessed from: Center for International Earth Science Information Network (CIESIN) http://dx.doi.org/ 10.7927/H4639MPP. All-cause mortality data was taken from the Global Burden of Disease for 2015: http://vizhub.healthdata.org/gbd-compare.
This work was supported by the UK Natural Environment Research Council (NERC) by providing funding for the National Centre for Earth Observation (NCEO), Grant No. NE/R016518/1.
Data availability
The data that support the findings of this study are available upon request from the authors.